Technology Systems (ICET’16) Pp. 96 - 100 (2016)
96
ADAPTIVE CENSUS AND INTERPOLATION BASED DISPARITY ESTIMATION USING
WEIGHTED AUTOREGRESSIVE MODELS
Iswariya, E
1and Rajesh Kannan, R
2Department of Electronics and Communication Engineering, St.Joseph’s college of Engineering, Chennai-119, Tamilnadu, India
ABSTRACT
This paper deals with an adaptive general scale interpolation algorithm that is capable of arbitrary scaling factors considering the non-stationarity of natural images. The proposed AR terms are modeled by pixels with their adjacent unknown HR neighbors. A novel stereo matching algorithm is proposed that utilizes color segmentation on the reference image and a self-adapting matching score that maximizes the number of reliable correspondences. Modified Census Transform is a form of non-parametric local transform used in image processing within a square window to a bit string, thereby capturing the image structure. The centre pixel’s intensity value is replaced by the bit string composed of set of boolean comparisons such that in a square window, moving left to right. A new technique is used and found a solution for correspondence problem that makes use of non-parametric local transforms as the basis for correlation. Non-parametric transforms rely on the relative ordering of local intensity values, and not on the intensity values themselves. Correlation using such transforms can tolerate a significant number of images. This can result in improved performance near object boundaries when compared with conventional methods such as normalized correlation.
Index Terms—Disparity mapping, Fast Census Transform, modified fuzzy C means segmentation, AR model, interpolation
I.INTRODUCTION
Stereo matching is the key issue in 3D computer vision [2,10]. Two different types of stereo matching algorithms exist here they are local approach and global approach [2]. The local approach compares the windowed regions around the reference pixel and matching pixel of the corresponding matching image. Hence the global method to strengthen global smoo-thing [2]. 3D image reconstruction from multiple ima-ges is the creation of three-dimensional models from a set of images. It is the reverse process of obtaining 2D images from 3D view.
The essence of an image is a projection from a 3D scene on to a 2D plane, during which process the depth is lost. The 3D image point is constrained to be on the line of sight. From a single image, it is impossible to determine the image points. If two images are avail-able, then the position of 3D point can be found as the intersection of two projection rays.
In this proposed technique, the size of the image is reduced interms of KB and the quality of image is improved when interpolation technique is used [1]. An interpolation technique which reduces the visual distor-tion caused by the fracdistor-tional zoom calculadistor-tion, where the fractional part of the pixel address is used to com-pute a weighted average of pixel brightness values over a small neighborhood of pixels. The interpolation technique is used for zooming and shrinking images.
Image interpolation is the process that generates high resolution(HR) images utilizing the information from low resolution (LR) images [7]. The major task of image interpolation is to estimate the HR pixels inter-oplated into the LR image. Several types of interop-lation techniques are used in digital image processing, such as bilinear and bicubic, edge triggered interop-lation, orientation adaptive interpointerop-lation, iterative curve based interpolation, direct cubic convolution interpolation, new edge triggered interpolation, implicit
piecewise AR model based image interpolation …etc [1,7]
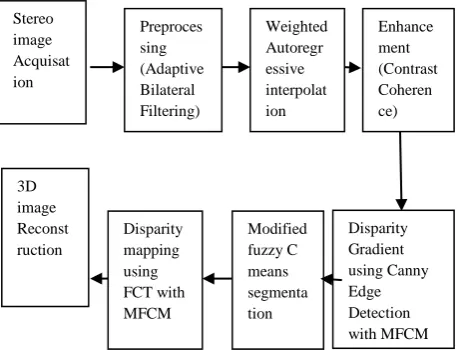
II. BLOCK DIAGRAM OF PROPOSED METHOD The main aim of our paper is to improve the accuracy of the disparity map and reduce the HR pixels by removing the mismatches caused by both occlusions and false targets.
Figure 2.1 Block diagram for WAR interpolation method
2.1 PREPROCESSING
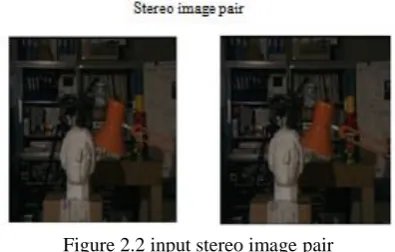
The first stage processing is to load the left and right stereo image pairs. The middle bury dataset is used to evaluate the results of the proposed algorithm. The image pairs like Tsukuba, Teddy, Cones, Venus are popoular and widely used stereo vision community [12]. For example, Tsukuba image is taken as input for our proposed algorithm is shown in figure 2.2
Stereo image Acquisat ion
3D image Reconst ruction
Preproces sing (Adaptive Bilateral Filtering)
Weighted Autoregr essive interpolat ion
Enhance ment (Contrast Coheren ce)
Disparity Gradient using Canny Edge Detection with MFCM Modified
fuzzy C means segmenta tion Disparity
97
Figure 2.2 input stereo image pair2.1.1 GAUSSIAN NOISE
Stereo Images are corrupted by various noises. Introduction of noise in image causes variation in brightness or colour information. Various noises such as Gaussian, Impulse, Speckle, Periodic and Poisson noise determines the picture quality
Gaussian noise is a statistical noise having a probability density function (PDF) which is equal to that of the normal distribution, also known as the Gaussian distribution. In other word the values that the noise that the noise can take on are Gaussian-distributed. The PDF of a Gaussian noise is given by,
where Z represents the gray value and μ is the mean value and σ is the standard deviation.
A special case is white Gaussian noise, in which the values at any times are identically distributed and statistically independent. The principal sources of Gaussian noise in digital images arise during acquisi-tion e.g sensor noise caused by poor illuminaacquisi-tion and/or high temperature such as electronic circuit noise.
Figure 2.3 Gaussian noise added stereo image pair 2.1.2 ADAPTIVE BILATERAL FILTER
Filtering is a technique to remove the unwanted information or noises from an image. Various types of filters are used to remove the noises from image. The filters used to remove Gaussian noise are Hybrid Median Filter, Adaptive Bilateral Filter.
This paper proposes an improved modified adaptive Bilateral Filter to remove Gaussian noise from colour images. In MATLAB-9 implemented this technique and various performance matrics taken into considera-tion are: Peak Signal to Noise Ratio (PSNR), Mean Square Error (MSE), Mean Absolute Error (MAE), and
Normalized Colour Difference (NCD). This result shows that the proposed technique gives the best result than all other techniques.
The two most common form of degradation, an image suffers a loss of sharpness or blur, and noise. In this paper, an attempt is made to first developed a sharpening method that increases the slope of edges without producing overshoot and undershoot, which gives clean, crisp, and artifact-free edges, thereby improving the overall appearance of the image. In this paper, the adaptive bilateral filter (ABF)is used for sharpness, enhancement and noise removal.
The impulse response of ABF is
f[m, n] =Σ Σ h[m, n; k, l]g[k, l] k l
where f[m, n] is restored image, h[m, n; k, l] is the response at [m, n] to an impulse at [k, l], and g[m, n] is the degraded image.
Figure 2.4 Adaptive Bilateral Filtered output
2.2 WEIGHTED AUTO REGRESSIVE (WAR) INTER-POLATION
The autoregressive (AR) model has been widely used in signal processing for its effective estimation, especially in image processing.
Figure 2.5 WAR interpolated output image The 2× interpolation algorithms adopt the AR model to describe the strong correlation between low-resolution (LR) pixels and high-low-resolution (HR) pixels [7]. However, these AR model-based methods depend on the relative position between LR pixels and HR pixels that are nonexistent in the general scale inter-polation. The weighted autoregressive (WAR) interop-lated stereo image pair output is shown figure 2.5.
Technology Systems (ICET’16) Pp. 96 - 100 (2016)
98
2.3 IMAGE ENHANCEMENTColor image enhancement will require improvement of color balance or color contrast in a color image. The enhancement of color image becomes a more difficult task not only because of the added dimension of data but also due to the added complexity of color perception[8]. Edge enhancement, an image-processing filter that increases the contrast of shape borders to improves acutance (apparent sharpness). To increase the brightness, contrast of the image we use enhancement techniques.
Figure 2.6 Enhanced output image
2.4 DISPARITY GRADIENT USING CANNY EDGE DETECTION
Modified Expectation Maximization is used to estimate the gradient of the image. An image gradient is a method to change the intensity or color in an image. Image gradients may be used to extract information from images.
The algorithm runs in 5 separate steps:
1. Smoothing: Blurring of the image to remove noise, to increase intensity.
2. Finding gradients: The edges should be marked if the gradientsoftheimagehave large magnitudes. 3. Non-maximum suppression: only local maxima
should be marked as edges.
4. Double thresholding: Edges are determined by thresholding techniques.
5. Edge tracking by hysteresis: Final edges are determined by suppressing every edge that are not connected to a very certain (strong) edge. 2.5 MODIFIED FUZZY C MEANS SEGMENTATION
Clustering is the task of grouping a set of objects in the same group that are more like each other than those in other groups. MFCM works by assigning membership to each data point according to the distance between the cluster center and the data point. More the data is near to the cluster center more is its membership towards the cluster center. Summation of membership at data point should be equal to one. The MFCM gives best result than k-means algorithm. Unlike k-means the data point must exclusively belong to one cluster center here data point is assigned by membership to each cluster center because of which data point may belong to more than one cluster center.
Figure 2.7 modified fuzzy C means segmented output image
2.6DISPARITY MAPPING USING FAST CENSUS TRANSFORM
The intensity based area correlation techniques have been investigated extensively for commercial applications in stereo vision but are also one of the newest methods used in computer vision.
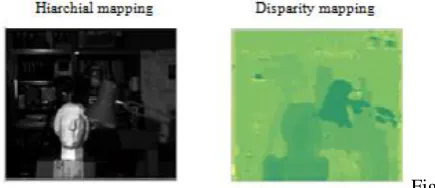
The algorithm that we are about to describe falls in the category of the correlation based stereo algorithms The tokens which are used in the correspondence process are the image pixels themselves with one feature the intensity at the pixel The algorithm uses two geometric constraints the epipolar constraint to reduce the search for correspondences and the constraint that the disparity or depth is locally constant in the vicinity of a pixel The second constraint is clearly only an approximation The algorithms also uses the constraint that the intensities at two corresponding pixels are approximately the same This is in fact a physical constraint related to the hypothesis that the observed objects are approximately. Figure 2.8 a) demonstrate the coarse disparity map result obtained by using Fast Census Transform (FCT) for Tsukuba image pair. This coarse disparity map estimated and left mean segmen-ted image are given as input to generate disparity map using Fast Census Transform (FCT) as shown in Figure 2.8 b) which computes the disparity for each segment.
Fig ure 2.8 (a) hiarchial mapping (b) Disparity mapping using FCT with MFCM
III. OUTPUT OF PROPOSED PROJECT 3.1 3D IMAGE RECONSTRUCTION
99
Figure 2.9 3D Reconstructed outputThe essence of an image is a projection from a 3D scene on to a 2D plane, during which process the depth is lost. The 3D point to a specific image point is constrained to be on the line of sight. From a single image, it is impossible to determine the image point. If two images are available, then the position of a 3D point can be found as the intersection of two projection rays
3.2 PARAMETER ANALYSIS 3.2.1 RMSE
The square root of the mean/average of the square of all the error is known as Root Mean Squared Error. The RMSE is commonly used and it makes an exce-llent general purpose error metric for numerical predic-tions. Compared to Mean Absolute Error, RMSE amp-lifies and severely punishes large errors [12].
The RMSE is the square root of the variance of the residuals. It indicates the absolute fit to the data- how close the observed data points are to the models predicted values. Lower values of RMSE indicates better fit. RMSE is a good measure of how accurately the model predicts the response, if the main purpose of the model is prediction.
Where N is the total number of pixels, dC (x,y) is the resultant disparity map, dT (x,y) is the ground truth map [12].
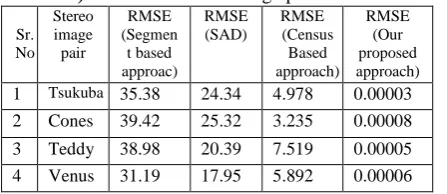
The performance of the proposed algorithm is summarized in table1. Table1 shows the final disparity maps estimated by our proposed approach with respect to the weighted autoregressive interpolation with modified FCM.
Table 3.1)RMSE for stereo image pairs
Sr. No
Stereo image pair
RMSE (Segmen t based approac)
RMSE (SAD)
RMSE (Census
Based approach)
RMSE (Our proposed approach)
1 Tsukuba 35.38 24.34 4.978 0.00003
2 Cones 39.42 25.32 3.235 0.00008
3 Teddy 38.98 20.39 7.519 0.00005
4 Venus 31.19 17.95 5.892 0.00006
3.2.2 DISC and Occlusion
The image is partitioned based on, abrupt changes in gray level is known as discontinuity. There are three basic types of grey level discontinuis in digital images:
Points
Lines
Edges
We typically find discontinuities using mask and correlation due to partitioning. Point detection can be achieved simply using the mask.
Occlusion means that there is something you want to see, but can't able to see the other object, or some event due to hidening. Exactly how it manifests itself or how you deal with the problem will vary due to the problem at hand.
If you are using a range camera, then occlusion is
areas where you do not have any information. Some laser range cameras work by transmitting a laser beam onto the surface and then having a camera setup which identifies the point of impact of that laser in the resulting image which gives the 3D-coordinates of that point. However, since the camera and laser is not necessarily aligned there can be points on the surface which the camera can see but the laser cannot hit the surface (occlusion). The problem here is more a matter of sensor setup.
The same can occur in stereo imaging if there are part of the scene which are only seen by one of the two cameras. No range data can obviously be collected from these points.
Table 3.2)Disc and non-occlusion values for stereo image pairs
Algorithm
Tsukuba Venus
Non occ
All disc Non
occ
all disc
Proposed
method 0.4 1.735 5.548 0.76 0.721 2.340
Base Paper 1.99 2.65 6.77 0.62 0.96 3.20
MRDPA 0.6 3.112 19.75 0.56 2.84 17.39
ADCensus 1.07 1.48 5.73 0.09 0.25 1.15
RDPA 1.12 1.57 6.08 0.28 0.47 2.98
Cost Filter 1.51 1.85 7.61 0.20 0.39 2.42
In the evaluation of stereo matching algo-rithms, the percentage of bad matching pixels E is computed for (1) nonoccluded pixels only (Nonocc), (2) all pixels (All) and (3) pixels that are close disparity disconti-nuity (Disc). In addition, a computed disparity value is defined to be erroneous if the absolute difference from the ground truth is more than one as
Technology Systems (ICET’16) Pp. 96 - 100 (2016)
100
IV. CONCLUSIONA Local Matching technique has been imple-mented for disparity mapping using the Fast Census Transform (FCT) with Modified Fuzzy C means Clus-tering(FCM). The matching quality is further improved using Canny Edge Detection. Subsequently, the dis-parity map has been improved and the bad pixel count and occlusion has been reduced. Finally, a 3G image is constructed with reduced size and quality of image is improved.
V. REFERENCE
1. Christine M. Zwart and David H. Frakes, Segment Adaptive Gradient Angle Interpolation. IEEE Transactions On Image Processing 22(8): (2013). 2. Doaa A. Altantawy and Sherif kishk, Graph Based
3-D Collaborative Disparity Map Estimation Technique, IEEE (2015).
3. Eric T.Psota, Jedrzej Kowalczuk, Mateusz Mittek and Lance C.Perez, MAP Disparity Estimation using Hidden Markov Trees, IEEE (2015).
4. Feba.J. F, S. K. Raman and B.Sudeesh, Evaluation of disparity estimation techniques and its application in mapping, IEEE (2012).
5. Gururaj Putraya, Basavaraja S. V., Mithun Uliyar, and Ravi R. Shenoy, Subspace Based Disparity Estimation for Plenoptic Cameras, IEEE (2014). 6. Ketan Tang, Oscar C. Au, Yuanfang Guo, Jiahao
Pang and Jiali Li, Arbitry Factor Image Inter-polation Using Geodesic Distance Weighted 2D Autoregressive Modeling, IEEE (2013)
7. Mading Li, Jiaying Liu, Jie Ren and Zongming Guo, Adaptive General Scale Interpolation Based
on Weighted Autoregressive Models, IEEE Trans-action on Circuits and Systems for Video Techno-logy 25(2): 200-211 (2015).
8. Mahdad Hosseini Kamal, Paolo Favaro and Pierre Vandergheynst, A Convex Solution to Disparity Estimation from Light Fields via the Primal-Dual Method, IEEE (2015).
9. Qiang Li, Moyuresh Biswas, Mark R. Pickering and Michael R. Frater, Accurate Depth Estimation Using Structured Light and Passive Stereo Dispa-rity Estimation, IEEE International Conference on Image Processing (2011).
10. S.Rajesh Kannan and Reeba Korah, Improved CRC Based Disparity Estimation of Vision System using Local Adaptive Hue Census and Mean Shift Clustering. National Academy Science Letters 39(1): 35- 38 (2016).
11. Shruti H. Mahajan and Varsha K. Harpale, Adap-tiveandNon-AdaptiveImage Interpolation Techni-ques, International Conference on Computing Communication Control and Automation (2015). 12. Viral H.Borisagar and Mukesh A. Zaveri, Census
and Segmentation-Based Disparity Estimation Algorithm using Region Merging. SCIRP Journals of signal and Information Processing 6: 191-202
(2015).