Statistical Analysis of Surface Roughness Parameters for
Weft Knitted Fabrics Measured by the Textile Surface
Tester (TST)
Najeh Maâtoug, Mehdi Sahnoun, Faouzi Sakli
Textile Engineering Laboratory, ISET Ksar Hellal, Monastir University, Monastir TUNISIA
Correspondence to:
Najeh Maâtoug email: [email protected]
ABSTRACT:
The present paper concerns the statistical analysis of the surface roughness evaluation of knitted fabrics by the Textile Surface Tester. The main objectives were, firstly, focused on investigating the effect of knitted fabrics structural factors and the test conditions on the surface absolute roughness, the total roughness and the standard deviation. Secondly, the relationship between sample characteristics (face, yarn count, loop length), the test conditions (the force and the slipping speed of the sensor feeler on the sample and signal sampling time), and the surface roughness parameters were analyzed and modeled through regression analysis. The combined effects of the input parameters and their two-way interactions on the test bench outputs were investigated using the analysis of variance (ANOVA). The percent contribution ratio was used to show the influence of inputs and their interactions on surface roughness parameters.
The results show how much surface roughness is mainly influenced by the knits structural factors. Also, it is underlined that the applied force by the sensor feeler on the fabric has an important effect on outputs. Finally, the sensor slipping speed on the sample and the signal sampling time have no important effects on outputs. Models were developed using experimental results from a full factorial experimental design. The adjusted coefficients of determination R2
adj were found to be greater than
80%.
Keywords: Knitted fabric, TST, Fabric surface
roughness, ANOVA, Statistical model.
INTRODUCTION
Surface properties are important parameters to objectively evaluate the hand of knitted fabrics [1, 2, 3]. The evaluation of fabric hand is made by using apparatus designed for the measurement of the fabric mechanical properties and physical characteristics.
Many systems have been designed and many researchers attempt to adapt apparatus for measuring the physical and mechanical properties of knitted fabrics for this purpose.[4,5]. To use the Kawabata Evaluation System (KES-FB) for the evaluation of the hand of knitted fabrics, many adjustments must be carried out to adapt the system to this kind of sample because of its extensibility and compressibility [1,4]. To evaluate fabric surface properties, many systems were developed such as the Multi-directional tribometer [6], Optical Multidirectional Roughness Meter [7], and the vibrating blade [8]. In the case of knitted fabrics, the measurement of surface properties such as roughness and friction are very important to objectively evaluate hand [4]. Otherwise, fabric roughness, wrinkle and smoothness are important factors for quality control during manufacturing as well as aesthetic aspects for consumer choice [9].
To evaluate the surface roughness properties of knitted fabrics, we designed an apparatus which we called the Textile Surface Tester (TST). The measurement is taken by using an inductive sensor of displacement LVDT, and the sample rotates under the sensor feeler to take a multi-directional measurement.
The aim of the present paper was to study the effect of the input factors and their two-way interactions on the roughness parameters measured by the TST. We mean by input factors all the sample characteristics and the test conditions by the test bench. For each roughness parameter, we computed a linear regression model. The significance of each model was tested by using a statistical analysis based on Analysis of Variation (ANOVA) and the coefficients of determination (R2 and R2
MATERIAL AND METHODS Principle of Measurement by the TST
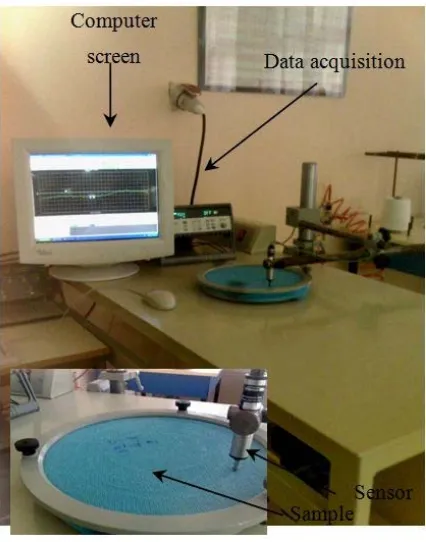
The Textile Surface Tester (Figure 1) is a patented
test bench [10] which is dedicated to the measurement of the surface roughness parameters of textile fabrics, especially the knits. The sample rotates under an inductive sensor of displacement and the fabric relieve animate the sensor feeler in vertical vibrations. These vibrations are transformed to an electric stream which is measured in real time during the test. The sensor feeler has a hemispherical shape with a radius of 1.5 mm to make it penetrate partially into the sample cavities. The spring integrated in the sensor core makes it possible to apply force on the fabric to help the feeler to penetrate through the fabric sites.
The signal produced by the sensor is digitized and stored online onto the computer hard disk by using a data acquisition box. This permits the adjustment of sampling time (Ts) and the number of samples or the run-time of the measurement.
FIGURE 1. The Textile Surface Tester.
Always, the obtained signal seems to be sinusoidal with low frequency and high amplitude with high frequency noise. The sinusoidal form is caused by the fact that the plane of the surface is not perfectly horizontal. The part of the signal which represents the sample surface roughness is observed as noise.
By decomposing this signal in two parts; low and high frequency, we can isolate our interesting part. To extract the part of the signal which represents the sample surface properties, we applied a decomposition process by using the Fourier and the wavelet transforms. The choice of wavelet and the level of decomposition were taken according to the signal sampling time. Data obtained after each test represents the altitude of the contact point (y). For each contact point there is the horizontal positions (x) measured in meters (m), and the vertical position (y) measured in mm such as in Figure 2.
FIGURE 2. Signals obtained from arbitrary chosen tests.
The sample is fixed on the sample plate. The feeler-sample contact point is chosen according to the radius of the feeler trajectory and slipping speed on the sample. The height of the sensor is regulated to fix the applied force by the sensor feeler on the sample.
The test bench was calibrated by measuring the roughness parameters of the paper surface with three different peaks. The peaks widths and heights were measured by using a vernier caliper (VC). The relative variation for each roughness parameter is acceptable for every peak.
Surface Roughness Parameters
The test bench generates a profile containing peaks and valleys (Figure 2) from which we extract
roughness parameters by using a statistical calculation according to the standard ISO 4287 norm [11]. Surface roughness is defined as closely spaced, irregular deviations on a scale smaller than that of waviness. There are different surface roughness parameters and below we define the most used ones.
The absolute roughness (Ra): the deviation of the
profile compared its average measured in mm.
0
1 L a
R y y dx
l
(1)x (m)
0 0.2 0.4 0.6 0.8 1 1.2
y(mm)
1.7 1.75 1.8 1.85 1.9 1.95
The total roughness (Rt): represents the difference
between the maximum and the minimum of the profile measured in mm.
t max min
R y y (2)
The standard deviation (σr): it evaluates the
difference between the maximum or minimum peak and the average of the roughness measured in mm.
1 2 2
0
1 /
L
r y y dx
l
(3)Were l is the profile length measured in millimeter.
The Experiments Design
Samples were produced with jersey structure medium densities by using a 7 gauge knitting machine. Yarn was of 50/50 cotton/acrylic and had a count (C) of C1=125 tex and C2=150 tex. Two levels of the machine tension, 3.6 and 4.6, were taken into account for the manufacturing of the samples on the knitting machine. The loop length (L) of the knitted fabric was measured according to the French standard NF G 07-101 (June 1971) to determine the unit loop length. Two values of the loop length were calculated (L1=0.78 cm and L2=0.92 cm). For each sample the measurement was carried out on the two sides; the upper face (UF) and the back face (BF). In calculation, UF and BF are replaced by 1 and 2 respectively. So we obtain the levels of the three structural factors; Face, L and C. The other three factors are related to the test conditions as shown below.
The force (F) applied by the sensor on the samples takes 4 levels by fixing the turns of the crank at the corresponding number. The sample was fixed on the plate which rotates at a constant radial velocity of
ω=0.17 (rad/s). The trajectory radius of the sensor feeler on the sample takes three levels to determinate the influence of the linear slipping speed (S) of the feeler on the fabric during the measurement. The signal sampling time takes also three levels.
In this study, the effects of the above described factors were experimentally investigated. The combination of the six factors (sample characteristics and test conditions) is arranged according to general full factorial set and give 288 tests [12]. The factors and factor levels used in this study are summarized in
Table I.
TABLE I. Factors and levels used in full factorial set.
Factor
Level Face C(tex) L(mm) S(mm/s) F(N) Ts(ms)
1 UF 125 7.8 9.35 0.63 5
2 BF 150 9.2 13.60 0.83 12
3 17.85 1.08 20
4 1.27
Statistical Analysis
The effect of one factor (A) at a level i on a response (R) is the difference between the average of the response when A is at a level i (M (Ai)) and the general average of the response (M(R)): [13]
Ai
E M ( Ai ) M ( R ) (4)
For modeling of surface roughness parameters with sample characteristics and test conditions, linear regression has been used. In the present case, the model chosen includes the main effects of the six factors and its two-way interaction. Representing the surface roughness parameter “y”, the regression model [14] can be expressed as:
6 5 6
0
1 i i 1 1 ij i j
i i j i
y
x
x x
(5)Where xi and xj are variables representing factors,
i
and ij are regression coefficients that depend on
main effects and two-way interaction effects respectively, and represents the error associated with the model.
The above equation in matrix form becomes:
Y XE (6)
Thus, the least squares estimator of is
1
t t
ˆ ( XX ) XY
(7)
The fitted regression model is
ˆ
Y X (8)
The difference between the experimentally measured and the fitted values of response is a residual.
ˆ ˆ
To compute the coefficients of the model, a regression analysis technique using least squares estimation was applied.
The tests for the significance of the regression and individual model coefficients were performed to verify the goodness of fit for the obtained model. The analysis of variance (ANOVA) was applied to summarize these tests [15]. The significance of the effect of each factor and interaction is evaluated by the percentage contribution ratio (PC %). This parameter is calculated by dividing each sequential sum of squares (SeqSS) by the total sequential sum of squares and multiplying by 100.
Additionally, plots of main effects and interactions were constructed. These plots are used to investigate the influences of factors on the surface roughness parameters.
The statistical significances of the fitted models were evaluated by the Fexp values of ANOVA. Values are
given in Table II. When Fexp values are less than F0.1%
(or 99.9% confidence), the obtained models are considered to be statistically significant. It demonstrates that the terms chosen in the model have significant effects on the responses. The other important coefficient is the determination coefficients, R2, which is defined as the ratio of the
explained variation to the total variation and is a measure of the degree of fit. When R2 approaches to
unity, the better the response model fits the actual data.
For the selection of the best model, the adjusted coefficient of multiple correlations 2
adj
R was
considered:
2 1 1 1 2
adj
R ( n )( R ) /( np ) (10)
where; 2
R is the usual coefficient of multiple
correlation, n is the data size and p is the number of parameters [14].
RESULTS AND DISCUSSION Factors Main Effects and Interactions
In the figures below, the main effects and interactions are plotted. It is clearly observed that the structural factors strongly affect surface roughness parameters. The sample face has an increasing effect on the three roughness parameters from upper to back faces. The yarn count has a decreasing effect because loop becomes tighter by using a broader yarn. The loop length has an important and increasing effect because the surface cavities become deeper by increasing L.
The higher the loop length the more significant the roughness parameters are. That was expected.
Ra 1 2
0,045
0,040
0,035
0,030
0,025
150
125 7,8 9,2
17,85 13,60 9,35 0,045
0,040
0,035
0,030
0,025
1,27 1,08 0,83
0,63 5 12 20
Face C(tex) L(mm)
S(mm/s) F(N) Ts(ms)
FIGURE 3. Main effects plot for the absolute roughness Ra.
R
t
2 1 0,40
0,35
0,30
0,25
150
125 7,8 9,2
17,85 13,60 9,35 0,40
0,35
0,30
0,25
1,27 1,08 0,83
0,63 5 12 20
Face C(tex) L(mm)
S(mm/s) F(N) Ts(ms)
FIGURE 4. Main effects plot for the total roughness Rt.
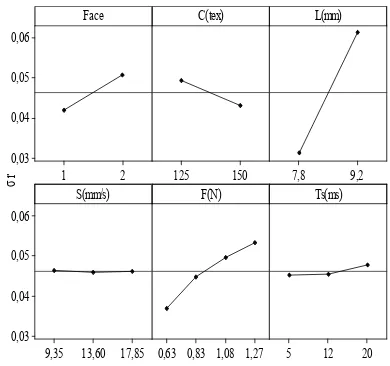
σ
r 1 2
0,06
0,05
0,04
0,03
150
125 7,8 9,2
17,85 13,60 9,35 0,06
0,05
0,04
0,03
1,27 1,08 0,83
0,63 5 12 20
Face C(tex) L(mm)
S(mm/s) F(N) Ts(ms)
The applied force by the sensor feeler on the sample, F, has an important and increasing effect. The sensor feeler penetrates more in the cavities by applying more pressure on the sample. There is no significant change observed on surface roughness parameters due to the variation of the sensor sleeping speed of the fabric (S) and the signal sampling time (Ts). Indeed, the signal shape does not change by changing the sampling time. Therefore, the tested profile will have always the same shape and the roughness parameters calculated from this profile does not undergo a significant change. The factor (S) is varied by varying the radius of the sensor trajectory on the sample, since the roughness properties are almost the same over the entire sample surface, we did not find
significant effects of S on the measured roughness parameters.
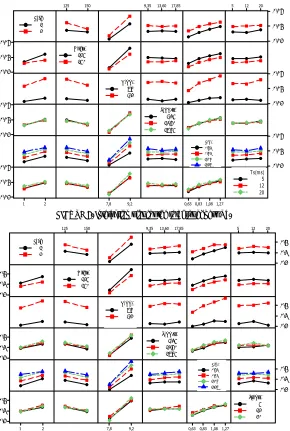
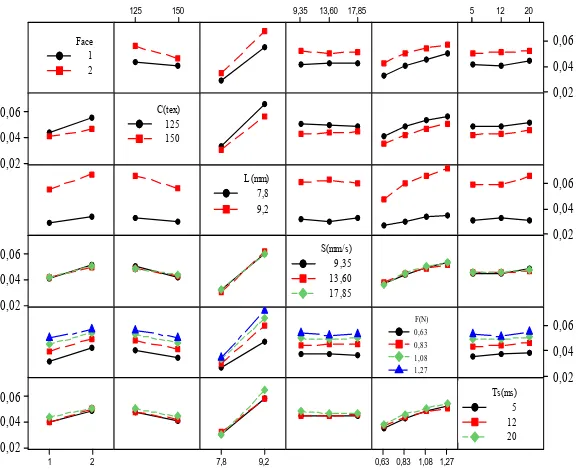
The interaction plots show a significant interaction between the construction parameters (Face, C and L). The effect of the yarn count increases by increasing the loop length and is more important on the back face than the upper face. It is clearly seen that there is a significant interaction between L and F. The effect of F increases more by increasing L. Indeed, when L increases, the loop becomes larger which makes the sensor feeler penetrates more in the sample cavities under the effect of the force. The interaction plot shows a non-significant interaction between S, Ts and the other factors.
Face Face L(mm) L(mm) S(mm/s) S(mm/s) F(N) F(N) Ts(ms) Ts(ms) C(tex) C(tex) 150
125 9,35 13,60 17,85 5 12 20
0,06 0,04 0,02 0,06 0,04 0,02 0,06 0,04 0,02 0,06 0,04 0,02 0,06 0,04 0,02 2 1 0,06 0,04 0,02 9,2
7,8 0,630,831,081,27
Face 1 2 C(tex) 125 150 L(mm) 7,8 9,2 S(mm/s) 17,85 9,35 13,60 F(N) 1,08 1,27 0,63 0,83 Ts(ms) 20 5 12
FIGURE 6. Interaction plot for the total roughness Ra.
Face L(mm) S(mm/s) F(N) Ts(ms) C(tex) 150
125 9,35 13,60 17,85 5 12 20
0,4 0,3 0,2 0,4 0,3 0,2 0,4 0,3 0,2 0,4 0,3 0,2 0,4 0,3 0,2 2 1 0,4 0,3 0,2 9,2
7,8 0,63 0,83 1,081,27
Face 1 2 C(tex) 125 150 L(mm) 7,8 9,2 S(mm/s) 17,85 9,35 13,60 F(N) 1,08 1,27 0,63 0,83 Ts(ms) 20 5 12
Face
L(mm)
S(mm/s)
F(N)
Ts(ms) C(tex)
150
125 9,35 13,60 17,85 5 12 20
0,06
0,04
0,02 0,06
0,04
0,02
0,06
0,04
0,02 0,06
0,04
0,02
0,06
0,04
0,02
2 1 0,06 0,04
0,02
9,2
7,8 0,630,831,081,27
Face 1 2
C(tex) 125 150
L(mm) 7,8 9,2
S(mm/s)
17,85 9,35 13,60
F(N) 1,08 1,27 0,63 0,83
Ts(ms)
20 5 12
FIGURE 8. Interaction plot for the standard deviation σr.
The interaction plots (Figure 6, Figure 7 and Figure 8) show significant interactions between the
construction parameters (Face, C and L). The effect of the yarn count increases by increasing the loop length and is more important on the back face than the upper face. It is clearly seen that there is a significant interaction between L and F. The effect of F increases more by increasing L. Indeed, when L increases, the loop becomes larger which makes the sensor feeler penetrates more in the sample cavities under the effect of the force. The interaction plot shows a non-significant interaction between S, Ts and the other factors.
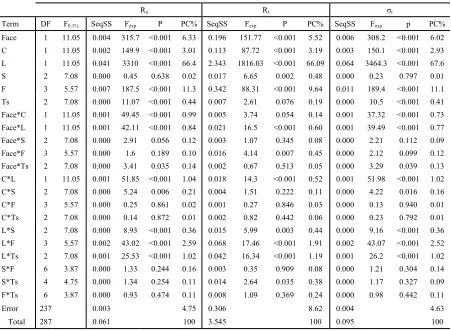
Analysis of Variance
Table II gives the ANOVA with F-values p-values
and percentage of contribution. Since the P-value in the ANOVA table is less than 0.001, there is a statistically significant relationship between the variables at the 99.9% confidence level. From this
table, it can be seen that Face, C, L and F are significant terms on surface roughness parameters: Ra, Rt and σr. The most significant factor on the
roughness parameters is the loop length (L), which explains, respectively, 66.4%, 66.9% and 67.6 contributions of the total variation. The next largest contribution on Ra, Rt and σr comes from the force
(F) with contributions of 11.3%, 9.64 and 11.1 %, respectively. The contributions of the sample face (Face) and the yarn count on the roughness parameters are around 6% and 3% respectively. ANOVA supported this conclusion by yielding statistically significant factors; F is greater than the tabulated values of F0.1% and p< 0.001. The sleeping
speed of the sensor feeler (S) has not significant effects on Ra, Rt and σr; p>0.05. All the factors
interactions with S are not significant for the roughness parameters, except L*S. This interaction has a few significant effects on Ra and Rt were F is
TABLE II. Analysis of variance (ANOVA) for roughness parameters Ra, Rt and σr.
Ra Rt σr
Term DF F0.1% SeqSS Fexp P PC% SeqSS Fexp P PC% SeqSS Fexp p PC%
Face 1 11.05 0.004 315.7 <0.001 6.33 0.196 151.77 <0.001 5.52 0.006 308.2 <0.001 6.02
C 1 11.05 0.002 149.9 <0.001 3.01 0.113 87.72 <0.001 3.19 0.003 150.1 <0.001 2.93
L 1 11.05 0.041 3310 <0.001 66.4 2.343 1816.03 <0.001 66.09 0.064 3464.3 <0.001 67.6
S 2 7.08 0.000 0.45 0.638 0.02 0.017 6.65 0.002 0.48 0.000 0.23 0.797 0.01
F 3 5.57 0.007 187.5 <0.001 11.3 0.342 88.31 <0.001 9.64 0.011 189.4 <0.001 11.1
Ts 2 7.08 0.000 11.07 <0.001 0.44 0.007 2.61 0.076 0.19 0.000 10.5 <0.001 0.41
Face*C 1 11.05 0.001 49.45 <0.001 0.99 0.005 3.74 0.054 0.14 0.001 37.32 <0.001 0.73
Face*L 1 11.05 0.001 42.11 <0.001 0.84 0.021 16.5 <0.001 0.60 0.001 39.49 <0.001 0.77
Face*S 2 7.08 0.000 2.91 0.056 0.12 0.003 1.07 0.345 0.08 0.000 2.21 0.112 0.09
Face*F 3 5.57 0.000 1.6 0.189 0.10 0.016 4.14 0.007 0.45 0.000 2.12 0.099 0.12
Face*Ts 2 7.08 0.000 3.41 0.035 0.14 0.002 0.67 0.513 0.05 0.000 3.29 0.039 0.13
C*L 1 11.05 0.001 51.85 <0.001 1.04 0.018 14.3 <0.001 0.52 0.001 51.98 <0.001 1.02
C*S 2 7.08 0.000 5.24 0.006 0.21 0.004 1.51 0.222 0.11 0.000 4.22 0.016 0.16
C*F 3 5.57 0.000 0.25 0.861 0.02 0.001 0.27 0.846 0.03 0.000 0.13 0.940 0.01
C*Ts 2 7.08 0.000 0.14 0.872 0.01 0.002 0.82 0.442 0.06 0.000 0.23 0.792 0.01
L*S 2 7.08 0.000 8.93 <0.001 0.36 0.015 5.99 0.003 0.44 0.000 9.16 <0.001 0.36
L*F 3 5.57 0.002 43.02 <0.001 2.59 0.068 17.46 <0.001 1.91 0.002 43.07 <0.001 2.52
L*Ts 2 7.08 0.001 25.53 <0.001 1.02 0.042 16.34 <0.001 1.19 0.001 26.2 <0.001 1.02
S*F 6 3.87 0.000 1.33 0.244 0.16 0.003 0.35 0.909 0.08 0.000 1.21 0.304 0.14
S*Ts 4 4.75 0.000 1.34 0.254 0.11 0.014 2.64 0.035 0.38 0.000 1.17 0.327 0.09
F*Ts 6 3.87 0.000 0.93 0.474 0.11 0.008 1.09 0.369 0.24 0.000 0.98 0.442 0.11
Error 237 0.003 4.75 0.306 8.62 0.004 4.63
Total 287 0.061 100 3.545 100 0.095 100
On the other hand, the sampling time (Ts) has no important effect on Ra and σr with a PC% around
0.4% and F equal to 11.07 and 10.5 respectively. All interactions of Ts with the other factors have no significant effect on the roughness parameter, except its interaction with L were PC% is slightly greater than 1%.
Linear Models of Surface Roughness Parameters The initial analysis of the responses obtained from ANOVA includes all parameters and their interactions. Different functions that represent the relationship between the surface roughness parameters as responses and the sample characteristics and the test conditions as independent variables may be proposed. The proposed relationship for analyzing the roughness parameters (Ra, Rt and σr) will be given by the Eq. (5). The
results obtained when this analysis is performed are shown in Table III.
Comparing F (0.001; 21; 267) to Fexp for the three
responses, we can reject the null hypothesis that the models are adequate. The models are reduced by eliminating terms with no significant effect on the
responses. Through the elimination process, the final linear models of response equations in terms of actual factors are presented as follows:
TABLE III. ANOVA table of Ra, Rt and σr modeling.
Source DF SeqSS Fexp F0.1%
Ra
Model 21 0.0569 175.25 2.34
Error 266 0.0041
Total 287 0.0611
Rt
Model 21 3.158 103.249 2.34 Error 266 0.387
Total 287 3.545
σr
Model 21 0.089 181.813 2.34 Error 266 0.006
Total 287 0.095
3 a
R *10 =-167+13.1*Face+1.39*C+19.7*L-84.5*F s
-1.92*T -0.23*Fca*C+3.82*Face*L-0.17*C*L (11)
s
-0.08*L*S+13.3*L*F+0.26*L*T
2 93 3 2 92 7
adj
3 t
R *10 =-551-43.8*Face+5.73*C+102*L-588*F +24.6*Face*L-0.91*C*L+86.6L*F
S
+2.04*L*T (12)
2 89 1 2 88 2
adj
R . R . %
3
R*10 =-198+11.5*Face+1.65*C+24.6*L-107*F
s
-2.49T -0.2*Face*C+4.56*Face*L-0.21*C*L S
+16.4L*F+0.32*L*T (13)
2 93 5 2 93
adj
R . R %
The adjusted coefficient of determination R2 adj is
calculated using the Eq. (10) and is more than 80% for all the above models developed, which shows the high correlation existing between the experimental and predicted values.
CONCLUSION
In this paper, the effect of sample characteristics and test conditions on surface roughness properties was investigated. The evaluation of Ra, Rt and σr was
carried out by using the Textile Surface Tester as a new test bench dedicated to this target. Six factors are combined and arranged according to general full factorial design of experiments.
Analysis of variance and Percentage Contribution ratio (PC%) show that the most influential factors on Ra, Rt and σr are the structural factors (L, C and Face)
and also, the applied force by the sensor feeler on the sample (F) which increases the values of the measured parameters. There are many interactions between factors. The important effects of interactions are between structural factors and F.
In this work, mathematical models of surface roughness parameters were obtained by applying regression techniques. Results delivered from ANOVA show that elaborated mathematical models allow prediction of surface roughness parameter values with a 99.9% confidence level and a high adjusted coefficient of determination (R2
adj greater
than 80%).
REFERENCES
[1] Finnimore E., "Objective handle parameters of knitted outwear fabrics," in 3rd Japan-Australia Symposium on Objective Measurement: Applications to Product Design and Process Control, Osaka, Japan, 1985, pp. 45-53.
[2] Kawabata S., "The development of the objective measurement of fabric handle," in of the Japan-Australia Join Symposium on Objective Specification of Fabric Quality, Mechanical Properties and performance, Kyoto, 1982, pp. 31-59.
[3] Bishop D.P., "Fabrics: Sensory and mechanical properties," Textile Progress, vol. 26, no. 3, 1996, pp. 1-58.
[4] Chen P.L., Barker R.L., Smith G.W. et Scruggs B., "Handle of weft knit fabrics," Textile Research Journal, vol. 62, no. 8, 1992, pp. 200-211.
[5] Scardino F., "Evaluation of industrial fabrics with the KES-F," in Proceedings of 3rd Japan-Australia Symposium on Objective Measurement: Applications to Product Design and Process Control, Osaka, Japan, 1985, pp. 633-639.
[6] Bueno M. A., Lamy B. et Renner M., "Effect of grain size and abrasion duration on the state of textile fabric surfaces," Wear , vol. 253, 2002 , pp. 448–457.
[7] Bueno, M.A., Durand, B., Renner, M., A non-Contact Measurement of the Roughness of Textile Fabrics Techniques, Experimental Techniques, vol. 24, no. 2, 2000, pp. 23-27. [8] Fontaine, S., Marsiquet, C., Nicoletti, N.,
Renner, M. & Bueno, M.A., "Development of a sensor for surface state measurements using experimental and numerical modal analysis," Sensors and Actuators A, vol. 120, 2005, pp. 507–517.
[9] Harlock S.C., "Fabric objective measurement: 2, Principles of measurement," Textile Asia, vol. 20, no. 7, 1989, pp. 66-71.
[10] Maâtoug N. Sahnoun M. and Sakli F., "Banc d'essais pour la mesure des caractéristiques physiques d'état de surface des tricots," Tunisian Patent 19934, January, 12, 2009. [11] ISO 4287, Geometrical Product Specifications
Surface texture: Profile method – Terms, definitions and surface texture parameters, 1st ed., 1997.
[12] Fisher R., The design of experiments, 1st ed. Edinburgh and London: Oliver and Boyd, 1935.
[13] Droesbeke J.J. , Fine J. et Saporta G.. , Plan d’expérience: Application à l’entreprise. Paris: T editions Technip, 1997.
[15] Nelson P. R. , "A comparison of sample seizes for the analysis of means and analysis of variances ," Journal of Quality Technology, No. 15, 1983, pp. 33-39.
AUTHORS’ ADDRESSES Najeh Maâtoug
Mehdi Sahnoun Faouzi Sakli
Textile Engineering Laboratory ISET Ksar Hellal