on Cloud
Systems
Research Article
Security Analytics and Benchmarking Log Aggregation
in the Cloud
Purvi Pathak
1,*, Dr. Kumar Rangasamy
2and Theophilus Selvaraj
31 M.Tech (CSE with Specialization in Cloud Computing), School of Computing Sciences and Engineering, VIT, Chennai,
India
2Associate Professor, School of Computing Sciences and Engineering, VIT, Chennai, India 3Information Security Analyst, Broadridge Financial Solutions, Bangalore, India
Abstract
With increase in popularity of Cloud computing, most organizations are moving towards the Cloud. The main concern for these organizations when migrating to the Cloud is securing their data in the Cloud. There are security measures that can be deployed to address the risk the organization faces to the security threats posed within the Cloud. This project illustrates how the problem can be solved using data protection techniques and security analytics of the log data within the Cloud deployment. In PaaS implementation of Cloud, the customer and the Cloud vendor has a shared responsibility model and the project will discuss what customer can do for their responsibility in the areas highlighted above.
Data is of paramount importance to any organization and protection of data becomes more complex in a Cloud offering as the storage is located off premise. Like any other environment devices, servers and applications in Cloud produce logs that can be aggregated and analyzed to identify security anomalies. Comparison of various log aggregation tools can give a detailed idea about what tool is better. Two log aggregation tools Splunk and the Elastic stack have been compared in this project. A combination of the above described strategies can address and point on various security risks, and help reduce the risk of the organization to a significant degree.
Keywords: cloud, log aggregation, security, analytics.
Received on 22 March 2018, accepted on 06 April 2018, published on 11 April 2018
Copyright © 2018 Purvi Pathak et al., licensed to EAI. This is an open access article distributed under the terms of the Creative Commons Attribution licence (http://creativecommons.org/licenses/by/3.0/), which permits unlimited use, distribution and reproduction in any medium so long as the original work is properly cited.
doi: 10.4108/eai.11-4-2018.154464
1. Introduction
Logs are detailed information about system status, performance, user activity and information relating to applications. Logs can give us a huge amount of information and can be critical in order to help make decisions relating to how the system works and any problems like security issues and system issues can be detected easily using these logs. Any security incident occurring in the system can be detected using logs. Log management is the process of handling large volumes of logs which are made up of a large number of processes, like log collection, log aggregation, storage, rotation, analysis, search, and reporting. Cloud computing is a distributed
*Corresponding author. Email:[email protected]
model where the resources are located at a remote location and can be accessed by any system having connection to the network or the Internet. All the systems present in the cloud also generate logs similar the what a local machine or a server located on-premise will generate, so the logs generated by the infrastructure present on the cloud can be used for similar purposes.
and audit compliance requirements which require logs to be stored and analysed to check if compliance is being followed. AWS (Amazon Web Services) is the IaaS (Infrastructure as a Service), which is very popular has been used for analysing the security of the environment. AWS provides logs for its different services like EC2 (Elastic Compute Cloud), S3 (Simple Storage Service), VPCs (Virtual Private Cloud), IAM (Identity and Access Management) and other services. The types of logs provided by AWS are CloudTrail logs which is a separate service which collects all logs relating to the environment used in AWS, CloudWatch metric logs which provide detailed logs relating to the alarms that have been setup and different metrics about the various services provided by AWS. In addition to these logs we also get access logs like S3 access logs, VPC flow logs, cloudfront access logs, billing information etc. All of these logs have been used to perform security analytics on the AWS environment with the help of Splunk which a log aggregation tool on which dashboards and visualizations can be developed.
Analytics of the logs collected from the cloud can help keep in check regulatory and audit compliance, security policy compliance, trouble shooting, forensics, faster response to security incidents and monitoring the behaviour of the users on-line. The process of using data collection, aggregation, and analysis tools for security monitoring and threat detection is called security analytics. Security analytics tools can incorporate large and diverse data sets into their detection algorithms. Security analytic tools with technological advancements can make use of machine learning algorithms to create adaptive learning systems which can fine tune the detection models and the logic for anomaly detection.
Benchmarking the indexing performance of two very popular log aggregation tools Splunk and Elastic Stack has been done. Splunk is a licensed application, which provides functionalities like writing queries to create visualizations and tables, dashboards, reports and alerts can also be created to view and send alerts to users in case of any event occurring. Elastic stack is open source but is equally popular and consists of three different applications called ElasticSearch, Logstash and Kibana together. Logstash is the engine that collects data from various sources and sends them to Elasticsearch. Elasticsearch is a search and indexing engine that is based on Apache Lucene. Elasticsearch collects data from Logstash and indexes the data depending upon the type of data. Kibana is the graphical tool which can be used to create visualizations and dashboards for the logs coming in through Elasticsearch. Indexing is the process where the application gets the log and processes it to parse according to some predefined system and also differentiate it from the different types of data that are present in the log.
The rest of this paper is organized as follows. Section II contains the literature survey. Section III contains the
Experimental Design and Setup. Section IV contains the Results and Section V is the conclusion of this paper.
2. Literature Survey
In this paper Daniel Sun et al. have used Amazon Web Services and DevOps (software DEVelopment and IT OPErations) to detect anomalies with the help of the metrics data and logs that were provided by the public cloud [1]. They trained multiple classifiers based upon the monitored data for different environments using Support Vector machine. They have used a specific time window for anomaly detection which gives performance metrics, entropy and the moving average of metrics contained in every window. They have trained multiple classifiers using SVM (Support Vector Machine) for multiple environments which are indicated by the applications and operations information given by the logs. When using detection, the logs that are retrieved during runtime are used to identify and select the classier precisely and the metrics data is streamed into a support vector machine classier to perform anomaly detection. Once the analysis on the CloudWatch data is done, they have used a moving window, moving average and the entropy features and used them for the purposes of training and detection of anomalies. Their experimental results have shown that the methods they used for non-intrusive anomaly detection are effective in detecting anomalies.
They achieved an accuracy of more than 90\% and their false positive rate was as low as 10\%. They came to a conclusion that without low-level and real-time information and by only using data given by cloud providers for detection anomalies in cloud environments can be achieved non-intrusively but at the cost of the detections not being real time and a delay being inevitable.
S. Berger et al have discussed the problem revolving around the protection of cloud infrastructure and workloads with the help of logging, smart auditing and satisfying compliance requirements [2]. Cloud Security Intelligence (CSI) is a systematic approach that they have used for collection, aggregation, correlation and analysis of data on different planes of cloud based infrastructure, by making use of a closed-loop architecture. The different planes that have used are control, management and data planes of the cloud based infrastructure. They have cross-correlated two planes i.e. data plane and control plane and compared the data access patterns and configuration using the desired specifications and privileges. They also have automatically derived dynamic rules relating to audit and the rate of audit with the help of historical and real-time audit traffic and adapting logging according to these rules.
which controls the user access over data and sends reports user actions and privileges. The framework for scalable closed-loop workload configuration monitoring and remediation integrates the analytics on the storage and network controls.
Shridhar T et. Al. in this paper have proposed an approach to maintain logging and monitoring to help consumers using the cloud to identify abnormal activities and re-mediate the problems that come up accordingly [3]. Using the logs provided by the cloud service provider they have created a tool that parses the logs and gives the user information which helps them to understand their activity in the cloud and also can help report any anomaly that has occurred. They have used OpenStack as the cloud platform and created a tool which authenticates the user and the second section of this tool has a window which displays the logs generated by the various services available in OpenStack. They have mapped the authentication page to Horizon which is the authentication service provided by OpenStack.
They have made use of usage logs and server node logs that are retrieved from a static file and using Java they are analyzed and parsed with the help of simple pattern matching. Their logging analytics tool sorts large amounts of information and displays the exact amount of information so that the user can know if there is some anomaly occurring or some threat like an attack or data theft is occurring in the cloud.
Winai Wongthai et. Al. in this paper have addressed the number one threat defined by Cloud Security Alliance (CSA) that is the malicious activities that are performed in consumers' virtual machines/VMs which can compromise the security of the cloud consumers as well as the cloud service provides [4]. They have designed and implemented a prototype of a proposed logging solution in an Infrastructure as a Service cloud which records the history of the VM files belonging to the consumers. They have used the VM log files to identify the malicious activities mainly spamming occurring in the virtual machine which can be advantageous to the Cloud service provider. They have made use of Xen to replicate the IaaS environment and have addressed the attacks occurring on customers critical files which include the files that require total confidentiality and loss of these files can be a big problem.
They have processed the behavior of log files so as to assist in remediating and mitigating risks associated with the malicious activities occurring in the Virtual machines and also the risks that are associated with spamming. The logging system in this project aims to record the history of critical files and once that is done the history is stored in a log file which can then be used to identify any malicious activity or any security threat to the data since all history relating to how that file was accessed is already stored.
In this paper Ci-Bin Jiang et al. have proposed a distributed management architecture and evaluated its performance. They have also researched the effects on the system caused by background traffic ratio and the bandwidth [5]. Their proposed architecture saves time and reduces the load of log transmission which can be used to monitor services provided by the cloud. Their proposed transmission data framework uses in-network computation architecture in order to promote the systems performance and also reduced the amount of data that is transmitted to the manager node and the time the user needs to wait for multiple transmission scenarios.
They have setup the virtual machines to generate and receive background traffic along the routing path. The log collection load has been improved by their architecture in the cloud and they have also show that distributed log computing is advantageous for cloud managers. Their proposed log system comes with in-network computation which can integrate a huge amount of log data for purposes like tracking cloud based long term situations. Better performance is shown by in-network computation architecture for diverse background traffic and bandwidth ratios when transmitting higher number of logs and a larger number of VMs.
Meryam Amar et al have proposed a centralized log file architecture and a diagnostic approach on the basis of anomaly detection and misuse techniques and the FP-growth algorithm has been given for prevention of consecutive violations [6]. There are two methods for anomaly detection manual and automatic. They have proposed an automatic approach for detection of anomalies. For detecting misuse, they have compared the logs with a global database that contain the defined ground of known attacks and also those that have been defined previously and if it is a match then it is considered as an attack.For anomaly detection they have learned the users normal behavior and after that any unusual behavior is considered as an anomaly and is reported as suspicious. The system then records normal use, defines grounds of what is normal behavior, and then sees if the protocol's behavior is similar to the previous determined protocols. Their goal is to give a comprehensive and secure architecture in order to manage the log files by defining the logs characteristics, centralization and its limits.
The flow they have proposed consists of generating log files, transferring the logs, sorting the logs so as to distinguish their origin and alerting and reporting. Finally, the results of this analysis are used to update the rules of every security tool that is involved. They also say that centralization of log files has its shortcomings like the central computer failing, administrative quality and sufficient resource availability which they have covered in their work.
IaaS clouds defined by the Cloud Security Alliance (CSA) [7]. They have researched the extent to which the logging systems can help reduce the risks and they also have proposed a generic architecture template for logging and have encompassed all instantiations that were possible for IaaS clouds. All different logging solutions have been mapped to their template and have discussed how their template can be used to do a systematic analysis of the logging systems for the purposes of security before they are deployed in production in any organization. They have mapped an existing logging solution called HP Flogger for performing security analytics. The number one threat spamming and misuse of emails defined by CSA also has been addressed by them for security log analytics.
3. Experimental Design and Setup
3.1. Splunk
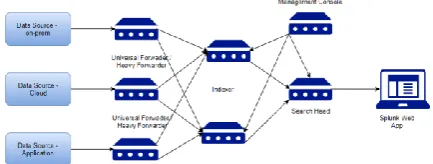
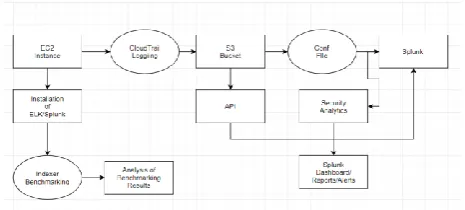
Splunk is based on Python, so it uses the Boto3 libraries in order to get logs from AWS buckets to Splunk. The first step uses an adapter file that contains the IAM credentials of the user that has been created to pull the logs. This file runs and gains access to the AWS account from which the logs need to be collected. The second file pulls the logs from the S3 bucket into Splunk. There is a third file which contains the code to un-encrypt the logs and also extract the AWS log files since all log files stored in and S3 bucket are stored in gzip format. Once this is done we can add inputs to Splunk which will index the data and display it. All of these transactions occur in JSON format. Once all of this is done the logs have to be given specific source-types based upon the type of log in a file called props.conf. The Splunk Sample architecture is described in Figure 1.
Figure 1. Splunk Sample Architecture
3.2. Elastic Stack
ElasticSearch, Logstash and Kibana together make the ELK stack. ElasticSearch is a search engine and a distributed real time document storage mechanism. Logstash acts as the data collection engine and works towards the collection and transportation of logs. Kibana provides a Graphical user interface which can be used for the visualization of data. Figure 2 displays the sample architecture of the Elastic Stack.
Logs are collected from different sources by Logstash using plugins or configuration files which contain the details about where the data is generated or stored. Once data is collected by Logstash it is sent to ElasticSearch that indexes the data and creates indexes depending upon the type of data it is. Once ElasticSearch is done indexing the data we can view the data on the visual tool called Kibana. ElasticSearch is highly scalable and allows you to store, search, and analyse large volumes of data in a short amount of time and in near real time. Logstash is a source data collection engine that has real-time pipelining capabilities. Logstash can unify data from different sources and normalize it data into the destinations you choose dynamically. Kibana is the analytics and visualization platform which is designed to work with Elasticsearch. Kibana can be used to search, view, and interact with the data that is stored in the Elasticsearch indices.
Figure 2. Elastic Stack Sample Architecture
3.3. Security Analytics
Figure 3. Splunk Sample Authorize VS Revoke activity for Security Groups
From the AWS CloudTrail logs the event names were used to find out the error activities occurring for S3 buckets like unencrypted buckets or buckets open to the world and other error conditions like unauthorized access by some account to read data from the bucket without adequate permissions. Using the S3 access logs the traffic accessing the S3 bucket can be monitored, the status of the request and the number of error events. In Security groups monitoring if the security group is open to the Internet and the error events occurring in the security group was monitored.
3.4. Benchmarking
Benchmarking of two very popular tools discussed above has been done on on-premise virtual machines and Cloud instances created on AWS. A T2.medium instance has been used which has 2 vCPUs(Virtual Central Processing unit), 4 GB RAM(Random Access Memory) and a 20 GB EBS(Elastic Block Storage) volume on an Amazon AMI for the cloud instance and the virtual machine is a CentOS instance with 4vCPUs, 3 GB RAM and a 30 GB virtual disk. Both the cloud instances and virtual machines were run as standalone instances for the ELK and Splunk setup.
In order to benchmark the indexing performance of the Elastic stack, a benchmarking tool called Rally has been used. Rally is a micro benchmarking framework which sets-up ElasticSearch and tears it down. Rally generates different types of data and indexes it into ElasticSearch. Benchmarking has been performed on the cloud as well as on a virtual machine. Rally calculates the time needed for indexing different types of data, the latency and the throughput at different percentiles of data indexing. Rally generates Syslog data which is then indexed to calculate how ElasticSearch performs.
Splunk was benchmarked using two Splunk Apps SplunkIt for the generation of data and Splunk on Splunk for calculating the performance. SplunkIt uses Python generate about 50 GBs of Syslog data and has two configurations called server and client where the server generates the data and the Client indexes all the data into Splunk after which Splunk on Splunk has been used to visualize the indexing performance of Splunk.
Both these benchmarking tools generate Syslog so windows machines cannot be used to perform benchmarking using these tools.
Figure 4. Splunk Sample Authorize VS Revoke activity for Security Groups
3.4. Comparison between Spunk and Elastic
Stack
Splunk is a licensed tool whereas the Elastic stack is Open source. Shipping of data in Splunk is done with the help of Splunk forwarders whereas Logstash and beats can be used to ship data to ElasticSearch. Data on-boarding on Splunk is easier since the data once indexed is already there but data types need to be defined in ELK. Both ELK and Splunk are provided on cloud and can be installed either on-premise or on cloud environment. Splunk search heads can be used to create dashboards where as in ELK Kibana can be used to get a proper Graphical user Interface. Splunk makes use of a proprietary language called Splunk Processing Language whereas ELK makes use of Query DSL with underlying JSON formatted syntax. Even though ELK is open-source there are many costs like infrastructure costs, maintenance costs, installation costs which are also involved in Splunk in addition to the license costs incurred in Splunk. Security is available in Splunk as a part and parcel of the package whereas ELK provides Xpack for authentication and other security features which is not free. Splunk and ELK both are extremely popular tools for log aggregation and can be used depending upon the requirements.
4. Results
Figure 5. ElasticSearch Virtual Machine Results
latency at the 50th percentile which took about 200K ms and the service time at the 50th percentile was at 350K ms. The latency at the 100th percentile was at 390K ms. The error rate was at 0\%. The total indexing time was 2 minutes. The merge time and refresh time took less than 1 minute. The maximum throughput for the virtual machine was about 100,000 documents/second, the minimum throughput was 60,000 documents/second and the median throughput was about 80,000 documents/second. The total amount of data that has been indexed is 0.8 GB and the size of the index is 0.4 GB.
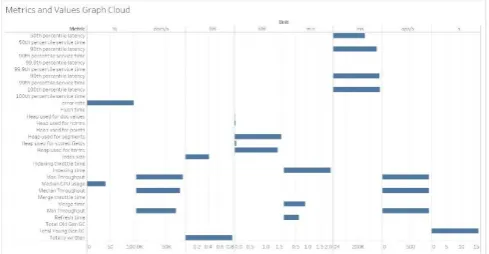
Figure 6 displays the results for the results of the Cloud Instance that was run using Rally. The graph shows the latency at the 50th percentile which took about 230K ms and the service time at the 50th percentile was at 250K ms. The latency at the 100th percentile was at 300K ms. The error rate was at 0\%. The total indexing time was 2 minutes. The merge time was 0.8 minutes and refresh time was 0.6 minute. The maximum throughput for the cloud machine was about 95,000 documents/second, the minimum throughput was 70,000 documents/second and the median throughput was about 85,000 documents/second. The total amount of data that has been indexed is 0.8 GB and the size of the index is 0.4 GB.
Figure 6. ElasticSearch Cloud Instance Results
Figure 7 displays the estimated time taken by Splunk to index different documents of indexes against a specific period of time. The two data types that have been indexed are cloud logs and syslog. This graph shows the data indexed over a 10-minute period in Kilobytes per second. The maximum data indexed is about 3000 KB/s and the minimum amount of data indexed was 700 KB/S over this period of time.
Figure 7. Splunk Virtual Machine Results
Figure 8. Splunk Cloud Instance Results
Figure 8 displays the estimated time taken by Splunk to index different documents of indexes against a specific period of time. The two data types that have been indexed are cloud logs and internal logs. This graph shows the data indexed over a 40 minute period in Kilobytes per second. The maximum data indexed is about 3 KB/s and the minimum amount of data indexed was 1 KB/S over this period of time.
The performance of the Virtual machine and the Cloud instance in ElasticSearch is almost the same. There was no error generated for any of the indexes generated and the cloud instance gave a higher throughput with a larger median throughput by indexing a higher number of files as compared to the virtual machine. The latency of the cloud instance was also lower and the service time for the cloud instance was also comparatively lower. The Splunk instance running on the cloud and the VM took almost equal amount of time to index data because they had similar configuration, though the instance running in the cloud environment took a little less amount of time to absorb and index the logs.
5. Conclusion
Acknowledgements.
I would like to thank Dr. Kumar R., Professor, School of Computing Science and Engineering, VIT, Chennai for guiding me through this project. I would also like to thank my peers and faculties for having guided me and inspiring me through the course of this research.
References
[1] Daniel Sun, Min Fu, Liming Su, Gouqiang Li, Qinghua Lu. 'Non-Intrusive Anomaly Detection with Streaming Performance Metrics and Logs for DevOps in Public Clouds: A Case Study in AWS.' IEEE, 2016.
[2] S. Berger, S. Garion, Y. Moatti, D. Naor, D. Pendarakis, A. Shulman-Peleg, J. R. Rao, E. Valdez, Y. Weinsberg. ' Security intelligence for cloud management infrastructures.' International Business Machines Corporation, 2016
[3] Sridhar T, V.Vivek and Shekhar R. 'Seclogmon : Security In Cloud Computing Using Activity Log For Consumer Data Protection.' , 2nd IEEE International Conference On Recent Trends in Electronics Information & Communication Technology, 2017.
[4] WinaiWongthai, Francisco Rocha and Aad van Moorsel. ' Logging Solutions to Mitigate Risks Associated With Threats in Infrastructure as a Service Cloud.' School of Computing Science, Newcastle University, UK. International Conference on Cloud Computing and Big Data, 2013.
[5] Ci-Bin Jiang, I-Hsien Liu, Yi-Chen Chen, Jung-Shian Li and Chuan-Gang Liu. ' Distributed Log System in Cloud Digital Forensics.' IEEE International Computer Symposium, 2016. [6] Meryem Amar, Mouad Lemoudden, Bouabid EI Ouahidi. 'Log File's Centralization to Improve Cloud Security. ' Laboratoire de Recherche Informatique, IEEE, 2016.
[7] Winai Wongthai, Francisco Liberal Rocha, Aad van Moorsel. 'A Generic Logging Template for Infrastructure as a Service Cloud.' School of Computing Science, New-castle University, UK, IEEE, 2013
[8] Benchmarking Tool Rally: https://github.com/elastic/rally
[9] Benchmarking App SplunkIt:
https://splunkbase.splunk.com/app/749/
[10] Splunk App for AWS:
https://splunkbase.splunk.com/app/1274/
[11] App Splunk on Splunk:
https://splunkbase.splunk.com/app/748/
[12] Elastic Stack Documentation: