INDICATORS ON LIFE EXPECTANCY: AN EXPLORATORY
DATA ANALYSIS
Ed Neil O. Maratas
JRMSU, Main Campus, Dapitan City
Abstract
In the statistical sense, life expectancy is the expected number of years in life remaining at a given age. Life expectancy increases during the years of childhood, as he survives mortality risks, hence high mortality rates is then associated with childhood health status. This study focused on the various indicators that effect on life expectancy. The descriptive-correlational method was used on this study with the aid of various sources on website to gather the needed data. The research only focused on the indicated 28 countries under East Asia & Pacific region. After which, a purposive sampling was conducted to represent the population of the region. The Cluster and Regression Analysis was used to treat and analyze the available data. The results showed that health expenditures, improved water sources and incidents of tuberculosis were the selected indicators that would affect life expectancy. Therefore, the better performance of government health service, the higher the chances of life longevity. When one country is able to ensure health security of its citizenry and provide access to potable water sources this will minimize the number of incidents of vector – borne diseases. Thus, life expectancy depends on health status and proper sanitation of the country.
Introduction
After Juan Ponce de Leon's searched for the Fountain of Youth in 1513, nearly 500 years ago, the general public as well as researchers in many disciplines remain fascinated with prolonging life and avoiding death. Recent opinions as to the extent to which prolonging life expectancy is possible are quite divided. Olshansky et al. (2001) take the view that combined male-female life expectancy at birth is unlikely to exceed 90 years in the 21st century without scientific advances allowing modification of fundamental aging processes. However, progress in the developing world, where life expectancy is usually constrained to 45-55 yrs, is clearly available, through alterations in socioeconomic and medical conditions. But more surprisingly, Oeppen and Vaupel (2002) in a review of longevity data from many developed countries found that life expectancy increases steadily by three months per year.
Over the past 200 years, countries with Black or African populations do not have generally the same improvements in mortality rates enjoyed by populations of European origin. Even in countries with a majority of White people, such as USA, England, and France, Black people tend to have shorter life expectancies than their White counterparts although often the statistics are not analyzed by race. For example, in the U.S. White Americans are expected to live until age 78, but African Americans only until age 71. Climate may also have an effect, and the way data is collected may also influence the figures. According to the U.S. Census Bureau, Andorra has the world’s longest life expectancy of 83.5 years.
In more recent times there have been tales of people living extremely long lives in primitive and mountainous regions of Pakistan, Ecuador, and Russia. These areas include the province of Hunza in northwestern Pakistan, the isolated village of Vilcabamba in the Andes Mountains of Ecuador, and the district of Abkhazia in the Caucasus Mountains of the USSR. These places have been the targets of extensive scientific studies by many investigators. In 1978 an international convention was held to examine all the known information about these modern-day Shangri-Las. It was revealed that all three areas have much in common. Life involves hard physical labor. The diets taken into consideration (by Western standards) are low in calories, protein, and fat. And the aged continue to be active and respected members of their communities into advanced age.
(2) You would like to have some more time to have a chance to. Clearly, longevity has no value unless it is accompanied by a great love for and a great enjoyment of living.
In the statistical sense, life expectancy is the expected number of years of life remaining at a given age. Encyclopaedia Britannica, (2010) stated estimates of the life expectancies of the population as a whole. In many instances’ life expectancy varied considerably according to class and gender. In the study of Young (2002) which asserts that more used of disability adjusted life expectancy method showed that indicator healthy population increases the life expectancy and the quality of life in most advanced countries in the world.
Climate change is a significant threat to human population as well as their life expectancy. Carbon dioxide emissions (CO2) is one of the indicators of climate change which may affect the life expectancy of people. Carbon dioxide emissions are those stemming from the burning of fossil fuels and the manufacture of cement. They include carbon dioxide produced during consumption of solid, liquid, and gas fuels and gas flaring. Various literatures cite these impacts, specifically on human health, which demand immediate action on the affected countries.
Life expectancy is also likely to be affected by exposure to high levels of highway air pollution or industrial air pollution. Thus, occupation may also have a major effect on life expectancy. Well – educated professionals working in offices have high life expectancy while coal miners do not. Other factors affecting an individual’s life expectancy are genetic disorders, obesity, and access to health care, diet exercise, smoking, drug use and excessive alcohol use.
There are numbers of factors that have been shown to correlate with longer –life expectancy. Some factors that appear to influence life expectancy include family history, marital status, economic status, physique, exercise, diet, drug use including smoking and alcohol consumption, disposition, education, environment, sleep, climate, and health care. Another factor that greatly affects life expectancy worldwide is mostly caused by differences in public health, medical care and diet from country to country. Much of the excess mortality rates in poorer nations is due to war, starvation, and diseases (AIDS and MALARIA, etc.).
From the foregoing, the researcher was then interested to look into the factors affecting human life expectancy.
Objectives of the study
This study focused on the three objectives: 1) to determine which group of countries have a higher and lower life expectancy; 2) to determine how health status affects life expectancy; 3) to identify the indicators that affect to human life expectancy.
Materials and Methods
were retrieved from the World Data Bank. Majority supplementary data from other sources were also utilized to get the most complete data as possible.
This research focused on the East Asia and Pacific region as indicated on the web http://www.google.com/publicdata/home which includes 34 countries. The gathered data were then organized eliminating the countries with no available data on the specific variables considered. Thus, this research includes only 28 countries under East Asia & Pacific regions. After which, a purposive sampling was conducted to represent the population of the region.
After the organization of data, it underwent to Cluster Analysis and Regression Analysis with the aid of the MINITAB Software. The Cluster Analysis is a multivariate exploratory data analysis method which aims to group individuals according to their similarities on certain measurable factors and variables. This method was specifically used in the study to group the countries according to the set of variables used in the study. The Regression Analysis is a confirmatory data analysis method that seeks to determine the relationship between a dependent variable (life expectancy) and independent variables (health status).
From the results of cluster analysis and regression analysis, hypotheses were formed which were then used as bases for the development of the theory.
Results and Discussions
Figure 1 shows the three groups of countries with similarities according to health status indicators. There were 25 countries with lowest life expectancy and only two countries with highest life expectancy.
13 8 14 12 26 21 5 16 9 20 19 23 11 28 15 6 24 27 4 25 3 18 22 10 2 17 7 1 57.16 71.44 85.72 100.00 Countries Si m ila rit y Dendrogram
Single Linkage, Euclidean Distance
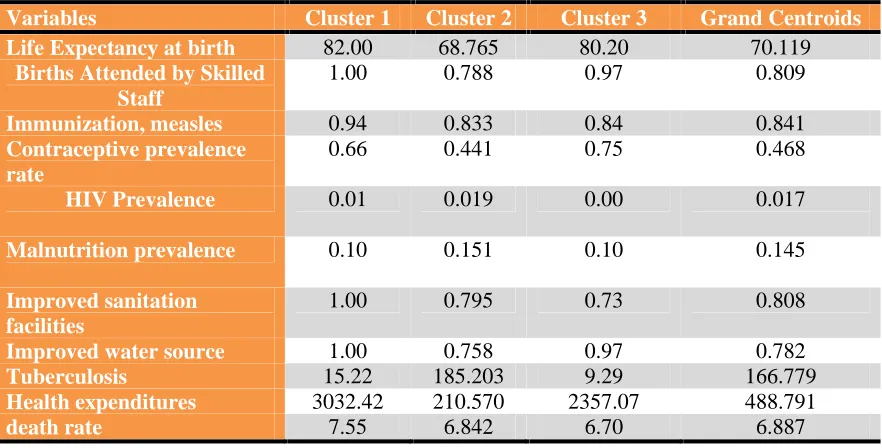
Table 1 presents the cluster analysis results on the health status indicators of life expectancy by countries. Cluster one (1) includes countries with high life expectancy and cluster two (2) with lower life expectancy. Cluster two (2) is the 25 countries with lowest life expectancy and Philippines is one of them.
Table 1 Cluster Analysis on Health Status Indicators of Life Expectancy by Countries
Variables Cluster 1 Cluster 2 Cluster 3 Grand Centroids
Life Expectancy at birth 82.00 68.765 80.20 70.119
Births Attended by Skilled Staff
1.00 0.788 0.97 0.809
Immunization, measles 0.94 0.833 0.84 0.841
Contraceptive prevalence rate
0.66 0.441 0.75 0.468
HIV Prevalence 0.01 0.019 0.00 0.017
Malnutrition prevalence 0.10 0.151 0.10 0.145
Improved sanitation facilities
1.00 0.795 0.73 0.808
Improved water source 1.00 0.758 0.97 0.782
Tuberculosis 15.22 185.203 9.29 166.779
Health expenditures 3032.42 210.570 2357.07 488.791
death rate 7.55 6.842 6.70 6.887
Table 2 shows the regression analysis between life expectancy and health status indicators. It revealed that improved water sources, incidents of tuberculosis and health expenditures are among the significant indicators on life expectancy.
Table 2 The Regression Analysis Between Life Expectancy and Health Indicators
Predictor Coef SE Coef T P
Constant 59.36 8.675 6.84 0
Births Attended by Skilled Staff 3.478 5.62 0.62 0.544
Immunization, measles 6.036 4.791 1.26 0.225
Contraceptive prevalence rate 5.489 2.75 2 0.062
HIV Prevalence -25.47 17.83 -1.43 0.171
Malnutrition prevalence 22.91 17.26 1.33 0.202
Improved sanitation facilities -5.458 5.121 -1.07 0.301
Improved water source 7.69 3.2 2.4 0.028
Incidents of tuberculosis (%) -0.03352 0.008161 -4.11 0.001 Health expenditures 0.001893 0.000782 2.42 0.027
death rate 0.068 0.4253 0.16 0.875
S = 2.76655 R-Sq = 89.8% R-Sq(adj) = 83.8%
According to the United Nations Population Division’s World Populations Prospects and other sources stress that life expectancy refers to the number of years a newborn infant would live if prevailing patterns of mortality at the time of its birth were to stay the same throughout its life. However, birth attended by skilled health staff, immunization of measles, contraceptive prevalence, HIV prevalence, malnutrition prevalence, improved sanitation facilities, improved water sources, incidents of tuberculosis, health expenditures and death rate are selected indicators to life expectancy.
public standpipe, borehole, protected well or spring, and rainwater collection. Unimproved sources include vendors, tanker trucks, and unprotected wells and springs. Reasonable access is defined as the availability of at least 20 liters a person a day from a source within one kilometer of the dwelling according to World Health Organization and United Nations Children's Fund, Progress on Drinking Water and Sanitation (2008). Total health expenditure is the sum of public and private health expenditures as a ratio of total population. It covers the provision of health services (preventive and curative), family planning activities, nutrition activities, and emergency aid designated for health but does not include provision of water and sanitation. Sources is taken from World Health Organization National Health Account database (www.who.int/nha/en) supplemented by country data.
To identify the significant factors that affect on life expectancy, regression analysis will then be applied to analyze the available data. The result showed that improved water sources, the number of incidents of tuberculosis and health expenditures are the significant indicators to life expectancy. Thus, the regression line equation of life expectancy is;
Life Expectancy = 59.4 + 7.69 Improved water source
-
0.0335 tuberculosisincidents + 0.00189 health expenditures
The results implied that; (1) the better access to water sources, the longer the life expectancy; (2) the lower the number of incidents of tuberculosis, the higher the chances of life expectancy; (3) the bigger its health expenditures, the longer the life span. The foregoing hypothesis leads to the proposition “the better the accessibility to drinking sanitation, the greater the chances of longevity”. Furthermore, “good and proper health implementation of the government leads to least chances of vector – borne diseases the better the quality of life”. From this viewpoint, the following theory conceptualized,
“Survival of human species from natural selection is a function of every government. The better performance of government health service, the higher the chances of longevity. When one country is able to ensure health security of its citizenry and provide access to water sources this will minimize to the number of incidents of vector–borne diseases. Thus, the long-life expectancy depends on health status and proper sanitation of the country.
References
Murray et. al., (2008) “The Reversal of Fortunes: Trends in County Mortality and
Cross-County Mortality Disparities in the United States”. Retrieved July 26, 2010.
Encyclopaedia Britannica, (2010). Retrieved July 26, 2010
http://data.worldbank.org/data-catalog/world-development-indicators?cid=GPD_WDI. Retrieved July 26, 2010
http://www.google.com/publicdata/home. Retrieved July 26, 2010
http://www.plosmedicine.org/article/info:doi/10.1371/journal.pmed.0050066. Retrieved July 26, 2010
http://www.absoluteastronomy.com/topics/Life_expectancy. Retrieved July 26, 2010