A Projector-Camera System for Ironing Support
with Wrinkle Enhancement
Kimie Suzuki
1,∗, Kaori Fujinami
1,†1Department of Computer and Information Sciences, Tokyo University of Agriculture and Technology, 2-24-16
Naka-cho, Koganei, Tokyo 184-8588, Japan
Abstract
Ironing is one of troublesome houseworks, in which the goal of the task is to remove wrinkles caused during washing. A projector has advantages in physical world instruction over an instruction sheet, a Head Mounted Display, or a smartphone/tablet PC because of direct mapping of instructive information on the target object. In this article, we propose a method to detect wrinkles using machine-learning and a system to present detected wrinkles by enhancing the area of wrinkles through a projector. In total, 47 infrared image features are defined, from which 15 features are finally used, to classify 32 pixels squares (about 4.5 cm squares) of regions of interest into one of four classes includingwrinkle,flat,sagging, andtuck. A RandomForest classifier successfully identified 93.0 % of the wrinkle class. The comparison of wrinkle enhancement methods implies that presenting all ROIs on an ironing board at a time is more effective in removing wrinkles than enhancing an area around and ahead of an iron. Also, we found that making a user realize the effect of wrinkle removal is important to reduce wrinkles efficiently and showed prospective solutions for this issue.
Receivedon17 April 2017;acceptedon 25 August 2017;publishedon 28 August 2017
Keywords: Projector-camera system; Ironing; Domestic computing; Image processing; Machine-learning; Fractal dimension; Feature selection
Copyright © 2017 Kimie Suzuki and Kaori Fujinami, licensed to EAI. This is an open access article distributed under the terms of the Creative Commons Attribution license (http://creativecommons.org/licenses/by/3.0/), which permits unlimited use, distribution and reproduction in any medium so long as the original work is properly cited.
doi:10.4108/eai.28-8-2017.153047
1. Introduction
Ironing is one of troublesome houseworks. A number of people do not like to iron. In a questionnaire survey from 1000 women, 435 answered that they did not like ironing [16]. Studies on systems to instruct efficient operations of household work have emerged because of the proliferation of information technologies in domestic environment such as cooking [3, 33] and cleaning [26]. Suzuki and Fujinami investigated an ironing support system using a video projector to instruct effective way of ironing a shirt. A pilot study showed that presenting regions of wrinkles was found to be important [32].
Due to the improvement of the performance and downsizing of a projector, the potential of a projector as a mean to support various daily tasks has been explored. A video projector can be utilized as a method of
∗This work was performed when she was a graduate student of Tokyo University of Agriculture and Technology
†Corresponding author. Email:[email protected]
presenting information directly on physical environment. We consider that frameless presentation [28] in contrast to the conventional “frameful display” has the potential of a new user interface. The basic characteristics of a projector-based interaction are as follows. Firstly, spatial information such as pointing a particular object or place in an environment can be provided [4,9,10,24,31–33]. Secondly, visual characteristics of physical world can be changed by projected light [1]. Thirdly, the projected information can be shared with co-located people in a relatively large display space to facilitate face-to-face interaction, e.g. briefing in a military operation [23]. The first characteristic represents spatial-awareness, which we consider a unique characteristic of a projector-based interface and allows a system to navigate a user to “move from here to there”. Additionally, the field of view is equal to the field of view. These characteristics make projector-based interface competitive among other modalities such as a smartphone/tablet and a Head-Mount Display (HMD) [9].
EAI Endorsed Transactions
In this article, we present a method of wrinkle area detection for a shirt, as well as the instruction of removing the detected wrinkles through a projector. The articles shows an insight into an application of a projector-camera system for ironing a shirt. The remainder of the article is organized as follows. In Section
2, related work is examined from the view points of the advantage of projector-camera systems and applications of projector-camera systems. Section 3 describes major components of the proposed system including the definition of the states of clothes, the classification method, and presentation method of wrinkle. In Section
4, the performance of the proposed system is evaluated, in which a subset of defined classification features is selected and analyzed. A user study is presented in Section 5 by comparing the residual ratio of wrinkles among three types of instruction methods. Finally, Section6 concludes the article.
2. Related work
A projector-camera system is a system that utilizes a camera as an input to control a video projector or to present an appropriate content from a video projector. Regarding the effect of projection-based interaction, Sokan et al. showed that presentation of an alert message close to a target object decreases the possibility of mis-interpretation of the message and accelerates the reaction time in the context of chemistry experiment support system [30]. Funk, et al. carried out an experiment to understand the effectiveness of projection-based interface in order picking by comparing with paper-based, audio-based, and vision-based (using HMD) methods [10]. The result showed that the projection-based picking shortened the task completion time, decreased the error rate, and reduced the mental demands, in which the in-situ feedback provided directly on the target were considered more helpful than paper-based and HMD-paper-based approach. Similar superiorities of projection-based instruction, as well as the effectiveness of hands free nature are found in assembling task [9]. These findings support the suitability of utilizing a projector-based presentation in instructive tasks.
In the context of applications of a projector-camera system, appearance control of an object forms a group of applications, which includes appearance enhancement [1] and texture neutralization [5, 7, 12]. In either case, the pixels in a captured image are manipulated so that the appearance could be suitable for a user. Another application group of a projector-camera system is to present information on or near specific physical objects to provide a user with additional information, in which a number of applications have been proposed to ascertain the benefits of digital information. For an educational purpose, a chemistry experiment support system was investigated that provides students with alert
information near the source of danger [31]. Applications in work environment include assembly tasks [9] and order picking [10]. Cooking support systems are popular applications for a domestic projector-camera system because cooking activities have high affinity with hands free that can be realized by projection. The support ranges from presenting step-by-step instruction on the kitchen table [8, 29] to presenting the method of handling ingredients, e.g., cutting fish by projecting the direction of moving a kitchen knife [33]. In case of ironing, Suzuki and Fujinami investigated a system that presents instructions for effective ironing of a shirt for novice users based on activity recognition, in which the effectiveness of reducing wrinkles compared with a step-by-step manual instruction acquisition on a PC screen was confirmed; however, wrinkles were not sufficiently removed according to the reports from experts [32]. This article is considered to be an extension of the work by focusing on wrinkle detection and presentation method toward more effective ironing support system.
3. Ironing Support System with Wrinkle
Region Enhancement
3.1. Principle of wrinkle detection
Grading of wrinkle has been traditionally conducted to determine the quality of the clothes as a product. However, in many cases, grading has been carried out visually by experts with wrinkle standards, e.g., [2], for reference. Therefore, research on automatic wrinkle detection based on visual features has been underway. Features representing the change of the fringe pattern observed by irradiation with slit light [14], features representing the unevenness of pixels or the ratio of edges in an image from an RGB camera [21], and features obtained from an infrared camera (IR camera) have been considered to recognize wrinkle [18].
given ROI. Note that we assume the timing of wrinkle detection is at the time of finishing ironing of a particular part of clothes, e.g., collar, yoke, sleeve.
3.2. System configuration
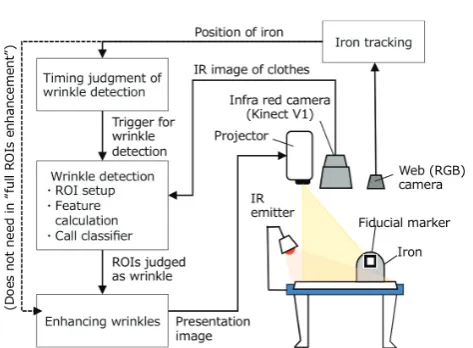
The architecture of the proposed system is illustrated in Figure 1. From the hardware point of view, the wrinkle detection system consists of an IR camera to capture wrinkle, an IR emitter to enhance wrinkle, a video projector to present the wrinkle area to the user, and a processing unit as a central component. Also, an RGB camera is used to track the position of an iron to provide guidance information. We utilized an IR camera of Microsoft Kinect V1 as an easy-to-use IR camera; however, we disabled the IR emitter of Kinect because the module emits a specific pattern to measure the distance between the IR camera and objects. Instead, we built an array of 5 x 8 IR LEDs with the wavelength of 830 nm. The IR emitter is installed on the edge of an ironing board at the level of 5 cm and at an angle of 10 degrees to the upright based on a preliminary experiment. The projector, IR camera (Kinect), and RGB camera are attached at 80 cm above the ironing board to a downward direction. Any commercial iron and an ironing board can be utilized.
The processing unit consists of three components: 1) the timing component that judges if one session of ironing, i.e., start and finish of ironing on a particular part of a shirt, is finished, 2) wrinkle detector with subcomponents of ROI setup, feature calculation, and classification, and 3) wrinkle area rendering for projection. Image processing is performed using language C-based OpenCV machine vision library, while Java-based Weka machine learning library [22] is used to classify each ROI into one of clothes states. So, Java Native Interface (JNI) bridges between two programming languages. Furthermore, to simplify the tracking task of an iron, we utilized ARToolkit [19] and attached a visual marker on an iron.
3.3. Classes and data collection for supervised
learning
As described above, the classifier is built by supervised machine learning, which requires labeled dataset of target classes. An image frame from an IR camera contains not only wrinkle but also flat (very smooth), sagging, and tuck. Sagging is a state in which clothes is being set without stretching, and tuck is a part of clothes. So, we consider these states should be separated from wrinkle. Totally, four classes are defined as classification targets. Wrinkle, however, has various levels. To collect various wrinkle in a balanced and standardized manner, we utilized smoothness appearance replicas provided by American Association of Textile Chemists and Colorists (AATCC), which is often utilized in studies
Figure 1. The configuration and major components of the proposed system
for automated wrinkle detection in clothing industries [2]. The replica contains six plates of 34 cm squares that correspond to the levels of smoothness appearance, i.e., wrinkle, of SA1, SA2, SA3, SA3.5, SA4, and SA5, where SA1 represents severe wrinkle, and the level decreases as the number increases. Here, SA5 indicates “very smooth”, which we regard as flat.
Candidate ROIs for training data are obtained by sliding by 8 pixels. Then, 200 ROIs are obtained from each level by random sampling from the candidates, which means wrinkle class has 1000 ROIs in total. To balance the number of data in each class, we collected 1000 ROIs from flat, sagging, and tuck, respectively. To make the area of sagging natural, we utilized the images that captured the results of five persons’ ironing. Note that the size of ROI is 32 pixels squares that corresponds to about 4.5 cm squares on the ironing board. Figure2
shows samples of target classes.
3.4. Recognition features
Recognition features are initially listed up from three aspects and later selected to improve accuracy and processing speed. The three aspects are described in the following sub-sections.
Pyramid-structured wavelet decomposition. The first class of features are derived from pyramid-structured wavelet decomposition, which were proposed by Sun, et al [18]. The method relies on the characteristics in which wrinkles normally appear in lower frequency domain than the texture of clothes such as tucks and yarns. The features were defined using wavelet coefficients that enhance the wrinkles. Let horizontal, vertical, and diagonal wavelet coefficients ofk-th wavelet transformation be CHk, CV k, and CDk, respectively.
Figure 2. Infrared images of wrinkles, flat surface, sagging, and tuck
in intensity, scale, and direction among the six levels of AATCC smoothness appearance replicas. So, CH4,
CV4, CD4, CH5,CV5, and CD5 are utilized to calculate four features: energy, hardness, density, and contrast. Note that w and h represent the width and height of a ROI, respectively. Energy represents the amount of wrinkle, and defined by Formula (1) and (2) as the sum of above six components. In Formula (1), the subfixesd and l represent the direction of wavelet coefficients (H, V, or D) and the number of transformation (4 or 5), respectively.
Edl =
1 w×h
w
∑
i=1
h
∑
j=1
Cdl(i, j)2 (1)
energy = EH4+EV4+ED4
+EH5+EV5+ED5 (2)
Formula (3) represents hardness that is defined as the ratio of higher frequency, i.e., fourth components, toenergy.
hardness = EH4+EV4+ED4
energy (3)
Density is defined by Formula (4), which indicates the ratio of the area of wrinkle to an entire ROI. Note that NCdl represents the number of pixels of wrinkle in
each direction and level of wavelet transformation whose values are higher than the average values.w4 ×h4 and w5 × h5 represent the total number of coefficients in
the fourth and the fifth level of wavelet transformation, respectively.
density=NCH4+NCV4+NCD4 3×w4×h4
+NCH5+NCV5+NCD5 3×w5×h5
(4)
Finally, contrast is defined by Formula (5), in which M Idl is the mean intensity of the l-th level of wavelet
coefficients ind-direction. Thus, four features are defined in this domain.
contrast=∑
l
∑
d
1 w×h
w
∑
i=1
h
∑
j=1
|Cdl(i, j)−M Idl| (5)
Complexity of intensity surface. The second class of features are based on the complexity of the intensity surface of an image, which comes from the idea that the wrinkle makes the intensity surface uneven. Fractal geometry can be found in nature such as coastlines and mountains, which is characterized by “self-similarity”. A fractal dimension (FD) is utilized to quantify the degree of self-similarity. The larger the dimension becomes, the higher the self-similarity is. This indicates the target is more complex, which has been applied in texture [6] and image analysis [20], as well as image segmentation [17] and recognition [25]. The box-counting dimension [27] is the most popular measurement of approximate fractal dimension due to its simplicity and computer-friendly nature. In the box-counting method, the number of cubes r pixel on a side, NF, that cover the intensity surface
of an ROI is counted, and a coefficient D in Formula (6) is estimated by the method of least squares against the double logarithm chart. In our system an ROI of 32 pixels square and scales r of 2, 3, 5, 10, and 18 pixels were utilized.
logNF =−Dlogr+logC (C:constant) (6)
Fractal dimension assumes complete self-similarity in the target domain, e.g., image, time series signal; however, in some cases, self-similarity only holds for the neighbor of a particular scale r, which is called local fractal dimension (LFD). We calculated an LFD against three contiguous scales by Formula (6), and obtained five LFDs from the following triples: (3, 4, 5), (5, 6, 7), (7, 8, 9), (9, 10, 11), and (17, 18, 19). The notation LF Dk
represents an LFD calculated from triples of (k-1, k, k+1), where k=4, 6, 8, 10, and 18.
In addition to FD and LFD, we added variance and standard deviation (SD) to the candidate of features from a domain of intensity surface complexity, which are defined by Formulas (7) and (8), respectively. Note that pi,jrepresents the intensity at (i,j), whilepis the mean
the domain of intensity surface complexity.
variance = 1
w×h
w ∑ i=1 h ∑ j=1
(pi,j−p)2 (7)
SD = √variance (8)
Continuity of pixel intensity. As shown in Figure 2, tucks and sagging extensively present shadows caused by irregularity of clothes, which can be seen directional. To capture such a directional nature, we introduce features calculated from co-occurrence matrix and run-length matrix. Co-occurrence matrix proposed by Haralick, et al. [15] is a matrix that represents the probability of existence of two points with certain intensity level at specific distance and angle. Let pθ(i, j) be an element
of a co-occurrence matrix for a direction θ(= 0, 45, 90, and 135 degree) at (i, j). The distance between two points were set to 1, which means that only the neighboring pixels are taken into account for the calculation. In addition to the matrices for the four direction, an accumulated (and normalized) version of co-occurrence matrix is defined as the fifth one, i.e., θ=“sum”. Haralick, et al. proposed 14 features, among which sum of squares (SS), angular second moment (ASM), and inverse difference moment (IDM) were utilized.
Sum of squares presents the smoothness of intensity surface consisting of neighboring pixels. As defined by Formula (9), the value gets larger as the number of pixel pairs with large difference of intensity level becomes larger.
SSθ =
255 ∑ i=0 255 ∑ j=0
(i−j)2pθ(i, j) (9)
Angular second moment is defined by Formula (10), which represents the diversity of intensity level. The value increases as the number of pixel pairs with particular pixel difference gets large.
ASMθ =
255 ∑ i=0 255 ∑ j=0
pθ(i, j)2 (10)
Inverse difference moment represents the uniformity of the intensity distribution. As defined by Formula (11), the value gets larger as the difference between two points is small, i.e., looks uniform.
IDMθ =
255 ∑ i=0 255 ∑ j=0
pθ(i, j)
1 + (i−j)2 (11)
The other feature class regarding the continuity of pixel intensity is calculated from a run-length matrix. Run-length indicates the number of pixels with the same intensity level at a particular direction, which is
originally utilized as an image coding method. A run-length matrix rθ(i, j) is defined as the number of runs
with pixel of intensity leveliand run lengthjat direction θ (= 0, 45, 90, and 135 degree). We utilized five types of features proposed by Galloway [11]. In the following formulas, we decreased the intensity level gfrom 256 to 32 to reduce the computational cost.N andTθ(Formula
(12)) represent the size of ROI (=32) and the total number of runs for direction θ, respectively. Note that the row index of the matrixj starts with 1 according to the custom of the run-length matrix.
Tθ = g−1
∑
i=0
N
∑
j=1
rθ(i, j) (12)
Short runs emphasis (SRE) represents the amount of short runs (Formula (13)). The value decreases as short linear pattern appears. So, we consider that SRE is suitable to discriminate wrinkles from tucks and sagging, especially low level wrinkles, e.g., SA3.5 and SA4 in Figure2. By contrast, long runs emphasis (LRE) represents the amount of long runs (Formula (14)), which we consider suitable for recognizing tucks and sagging.
SREθ =
1 Tθ
g−1
∑
i=0
N
∑
j=1 rθ(i, j)
j2 (13)
LREθ =
1 Tθ
g−1
∑
i=0
N
∑
j=1
j2rθ(i, j) (14)
Gray level non-uniformity (GLN) represents uneven-ness of intensity level in a ROI (Formula (15)), while run-length non-uniformity (RLN) indicates the variance of the run-length in a run-length matrix (Formula (16)).
GLNθ =
1 Tθ
g−1
∑ i=0 ( N ∑ j=1
rθ(i, j))2 (15)
RLNθ =
1 Tθ N ∑ i=1 (
g−1
∑
i=0
rθ(i, j))2 (16)
Finally, run percentage (RP) represents the ratio of the total number of runs to the number of pixels in an image (Formula (17)).
RPθ=
Tθ
N2 (17)
Totally, we obtained 15 (=3×5) features and 20 (=5×4) features by co-occurrence matrices and run-length matrices, respectively. To summarize, 47 features were defined.
3.5. Presentation of wrinkle through a projector
tuck. Sagging and tuck are the states in which the surface of the clothes is not flat; however, we consider these states do not need to be enhanced by a projector because sagging is large enough to be found by a user and can be corrected without system s direction. Also, tuck is a part of a shirt, and thus it is another normal case. Therefore, the system just enhances the ROIs in red that are judged as wrinkle by the system. Overlap of ROIs appears in case that contiguous ROIs are judged as wrinkle because an ROI is defined by sliding 8 pixels. In this case, α-blending is applied by overlapping translucent rectangle image for the ROI, which represents the density of wrinkle. Three types of presentation for wrinkle enhancement were proposed to understand an effective way for wrinkle removal, which are compared through a user study in Section5.
1. Full ROIs enhancement: The system presents all detected wrinkles to the user, and he/she removes the winkle based on his/her thought (Figure3top). 2. Around iron enhancement: The system enhances the wrinkles around the iron, i.e., 60 pixels squares, as the user moves the iron based on his/her thoughts (Figure3 center).
3. Iron leading enhancement: The system enhances the wrinkles found ahead of the recommended path for effective ironing (Figure 3bottom).
4. Performance evaluation
4.1. Contribution of each feature
We analyzed the contribution of each feature based on information gain (IG). IG is commonly used in feature selection, where the gain of information provided by a particular feature is calculated by subtracting a conditional entropy with that feature from the entropy under random guess [34]. So, the more informative feature has the higher IG.
Table1 summarizes information gain for each feature in descending order of IG. In the table, we can find that the features derived from co-occurrence matrix, i.e.,
SS,ASM, andIDM, have higher IGs than those derived from run-length matrix, i.e.,SRE,LRE,GLN,RLN, and
RP. The run-length matrix-based features represents the continuity of pixel with particular pixel intensity in an entire ROI, while the co-occurrence matrix represents the relationship of pixel intensity between adjacent pixels. So, we consider that the continuity of pixel intensity does not effectively describe the differences of the four classes. This can also be supported by the fact that the features representing global characteristics of the ROI such as variance, SD, energy,contrast,fractal, and
LFD, have relatively high IG. Although features with higher IG may well contribute to classify the target
Figure 3. Three types of ROIs enhancement through a projector. Top: full ROIs enhancement, Center: around iron enhancement, Bottom: iron leading enhancement.
classes, i.e., wrinkle, flat, sagging, and tuck, redundant and ill-combined features may exist. Redundant features decrease the processing speed, and ill-combined feature degrades the processing accuracy. In next section, feature selection is performed to find the best combination of features.
Table 1. Information gains of features [bit] sorted in descending order from top-left to bottom-right
Feature IG Feature IG Feature IG
variance 1.01 IDM90 0.77 RP45 0.56
SD 1.01 IDM0 0.75 GLN45 0.54
energy 1.01 SS0 0.75 SRE45 0.54
contrast 0.96 LF D6 0.72 GLN90 0.49
ASM45 0.87 LF D4 0.70 RP90 0.48
ASMsum 0.86 ASM0 0.68 GLN135 0.47
ASM135 0.85 LF D8 0.67 RP135 0.47
IDMsum 0.85 LF D10 0.64 RP0 0.42
SS45 0.84 LRE0 0.62 RLN0 0.41
fractal 0.83 LRE135 0.62 GLN0 0.41
IDM45 0.81 SRE0 0.61 RLN45 0.37
SS135 0.80 LRE90 0.61 RLN135 0.35
SSsum 0.80 SRE90 0.60 RLN90 0.32
ASM90 0.79 LRE45 0.60 hardness 0.17
SS90 0.79 SRE135 0.59 density 0.03
4.2. Feature selection
To find contributive subset of features in 47 features, we utilized a correlation-based feature selection (CFS) [13]. CFS has a heuristic evaluation function calledmerit, which can specify subset of features that are highly correlated with classes, i.e., more predictive of classes, but uncorrelated with each other, i.e., more concise. As described above, the listed features may contain redundant features. So, we considered that the capability of CFS was suitable for this problem. Formula (18) defines the heuristic meritMsof a feature subset S that
containskfeatures, in which (rcf ) is the mean
feature-class correlation and (rf f ) is the mean feature-feature
inter-correlation.
Ms=
krcf
√
k+k(k−1)rf f
(18)
The forward selection algorithm was utilized to generate a ranking on feature subsets, which begins with no features and greedily adds features one by one. Note that CFS is a classifier-independent method of feature selection. As implementations for subset evaluation and ranking generation, we utilized CfsSubsetEval and
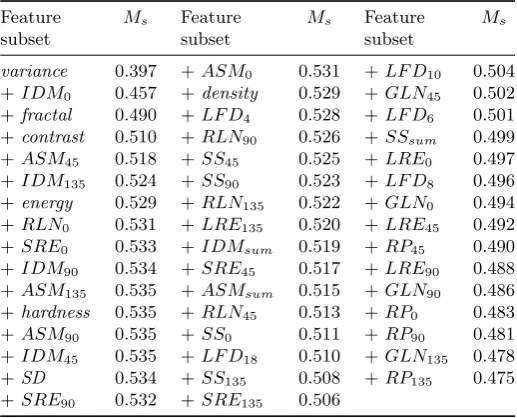
GreedyStepwise functions in Weka machine learning toolkit [22]. Table2 shows the relationship between the feature subset and the corresponding merit score Ms.
Here, the number of features increases from top-left to bottom-right of the table in the order of adding to the feature subset. For example, variance was selected firstly that has the hight merit score;IDM0was selected as the feature that had the hight merit score in the remaining 46 features in combination with variance; RP135 is the last feature added to the feature subset. As shown in the table, the increase of Ms becomes
saturated at a particular number of features. This indicates that the redundancy of features increased and/or the predictiveness of an added feature decreased after a particular number of features. Finally, we selected 15 features for prototype implementation, in which the number was determined as what Ms starts decreasing.
The merit score of 15 features, i.e., from variance to
SD in Table 2, is 0.534, while that of top-15 features in information gain-based feature evaluation, i.e., from
variance to SS90 in Table 1, is 0.496. So, the selected feature subset is considered to be less redundant and/or more informative than the collection of only informative features. We will compare the classification performance between these two feature subsets later.
4.3. Classifier evaluation
Each ROI is classified into one of four classes, i.e.,
wrinkle, flat, sagging, and tuck, using a supervised machine learning classifier. We compared the perfor-mance of classification among popular classification
Table 2. Merit scores (Ms) of the subset of features.
The size of feature subset increases from top-left to bottom-right by adding one feature after another to an existing feature subset. The plus sign (+) before a feature indicates that the feature is added to an existing subset.
Feature Ms Feature Ms Feature Ms
subset subset subset
variance 0.397 +ASM0 0.531 +LF D10 0.504
+IDM0 0.457 +density 0.529 +GLN45 0.502
+fractal 0.490 +LF D4 0.528 +LF D6 0.501
+contrast 0.510 +RLN90 0.526 +SSsum 0.499 +ASM45 0.518 +SS45 0.525 +LRE0 0.497
+IDM135 0.524 +SS90 0.523 +LF D8 0.496
+energy 0.529 +RLN135 0.522 +GLN0 0.494
+RLN0 0.531 +LRE135 0.520 +LRE45 0.492
+SRE0 0.533 +IDMsum 0.519 +RP45 0.490
+IDM90 0.534 +SRE45 0.517 +LRE90 0.488
+ASM135 0.535 +ASMsum 0.515 +GLN90 0.486
+hardness 0.535 +RLN45 0.513 +RP0 0.483
+ASM90 0.535 +SS0 0.511 +RP90 0.481
+IDM45 0.535 +LF D18 0.510 +GLN135 0.478
+SD 0.534 +SS135 0.508 +RP135 0.475
+SRE90 0.532 +SRE135 0.506
model by applying 10-fold cross-validation (CV) to fix one classifier for later evaluation. We tested with Na¨ıve Bayes (a baseline approach), Multi-layer Perceptron (MLP, an artificial neural network approach), Sequential Minimal Optimization (SMO, a support vector machine approach), and RandomForest (RF, an ensemble learn-ing approach). The hyper-parameters of SMO are deter-mined by grid search as follows: kernel function = poly kernel, complexity = 512, epsilon =1.0×10⁻¹². The number of trees in RandomForest is 10.
The performance metrics in the evaluation are recall, precision, and F-measure. F-measure is a harmonic mean between recall and precision. The metrics for each class are represented by Formulas (19) to (21), whereNcorrecti,
Ntestedi, and Njudgedi represent the number of cases
correctly classified into classi, the number of test cases
in classi, and the number of cases classified into classi,
respectively, while i corresponds to either one of four classes: wrinkle, flat, sagging, and tuck. Table 3 shows the classification performance by classifier models. In addition to the averages of the metrics (shown as all), the values for classwrinkle are presented in the table to emphasize the performance for classifying wrinkles. We consider that recall for class wrinkle is most important to evaluate the classifier. The aim of the presentation is to show the user the existence of wrinkles. So, successful identification of wrinkle class, i.e., recallwrinkle, takes
priority over the reliability of classification into wrinkle
class, i.e.,precisionwrinkle. Consequently, RandomForest
RandomForest with 10 trees in the later experiments. Table4shows a confusion matrix as a detail classification result.
recalli =
Ncorrecti
Ntestedi
(19)
precisioni =
Ncorrecti
Njudgedi
(20)
F-measurei =
2
1/recalli+ 1/precisioni
(21)
Table 3. The difference of recall, precision, and F-measure in various classifiers
Metrics NB MLP SMO RF
Recall wrinkle 0.855 0.875 0.904 0.930 all 0.710 0.881 0.877 0.927 Precision wrinkle 0.531 0.911 0.892 0.922 all 0.741 0.881 0.878 0.927 F-measure wrinkle 0.655 0.892 0.898 0.926 all 0.695 0.880 0.874 0.927
4.4. Effects of feature selection in processing
speed and classification metrics
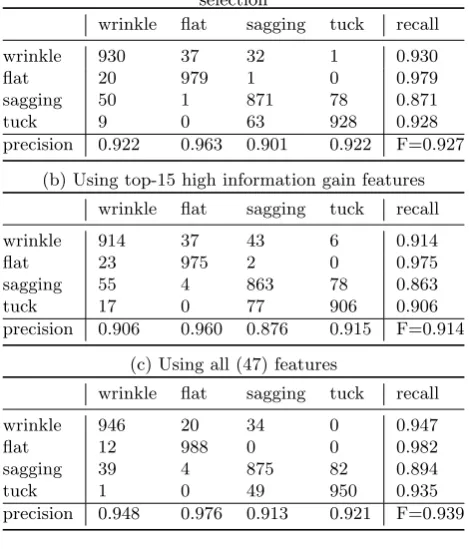
In Section 4.1, the contribution of each feature based on information gain is presented, while in Section 4.2, we specified 15 features from entire 47 features, rather than selecting features with high information gain. In this section, we evaluate the effectiveness of the selected features in terms of processing speed and classification performance. Table 4 shows confusion matrices of classification results using (a) selected features based on correlation-based subset selection, (b) selected features based on individual information gain, and (c) all features, in which F-measuresof these sets of features are 0.927, 0.914, and 0.939, respectively. Meanwhile, recallswrinkle of these feature sets are 0.930, 0.914, and
0.947, respectively. So, the feature selection that takes into account both the correlation of features and the predictiveness of classes performed successfully; however, as shown in Tables 4 (a) and (c), the performance metrics of selected features degraded by 0.012 and 0.017 regarding F-measure and recallwrinkle, respectively.
Although 1.7 % of ROIs of wrinkle are incorrectly classified into the other classes, we consider that overlaps in ROI calculation, i.e., 75 % overlap, can rescue mis-classification.
Regarding the processing speed, average time to finish classifying one ROI is calculated, which takes about 0.003 sec and 0.012 sec for selected features using correlation-based method and all features, respectively. About 1000 ROIs are calculated from an image captured by IR camera. So, it takes 3 sec and 12 sec in
total for each condition. In the current implementation, wrinkle detection is performed after finishing ironing entire surface of clothes, which we consider that 3 sec of processing delay may not degrade user experience. Therefore, we consider that reducing features from 47 to 15 using a correlation-based selection showed practical performance. Note that we utilized a PC with CPU of Intel Core i5 2.67 GHz and 4.0 GB RAM that runs Windows 7 (64 bit) in the processing speed measurement.
Table 4. Confusion matrix of 4-class classification using RandomForest
(a) Using selected features (15) based on correlation-based selection
wrinkle flat sagging tuck recall
wrinkle 930 37 32 1 0.930
flat 20 979 1 0 0.979
sagging 50 1 871 78 0.871
tuck 9 0 63 928 0.928
precision 0.922 0.963 0.901 0.922 F=0.927
(b) Using top-15 high information gain features
wrinkle flat sagging tuck recall
wrinkle 914 37 43 6 0.914
flat 23 975 2 0 0.975
sagging 55 4 863 78 0.863
tuck 17 0 77 906 0.906
precision 0.906 0.960 0.876 0.915 F=0.914
(c) Using all (47) features
wrinkle flat sagging tuck recall
wrinkle 946 20 34 0 0.947
flat 12 988 0 0 0.982
sagging 39 4 875 82 0.894
tuck 1 0 49 950 0.935
precision 0.948 0.976 0.913 0.921 F=0.939
5. User study
5.1. Methodology
Figure 4. The target part of a shirt (red), in which left and right sides are ironed separately.
5.2. Result and analysis
Figure 5 shows the number of trials and an average of residual ratio of wrinkles. The residual ratio represents the rate of wrinkled ROI remaining after each trial to the one before ironing is applied. The figure suggests that wrinkles are decreasing as the number of trials is increased and that the presentation method 1 “full ROIs enhancement” is more effective in wrinkle removal than the others due to steeper slope of the residual ratio. As shown in the figure, an average residual ratio decreases as the number of trials increased; however, in some cases, the residual ratio did not always increase (Figure6). By observing the method of ironing of such subjects, we found that they put an iron on an area strongly where the system judged as wrinkle. This made the clothes slackened and another wrinkle or sag was generated in the vicinity. To avoid such secondary wrinkle generation, the occurrence of sag should be alerted by monitoring the states of the surface of clothes in addition to simply presenting the position of the wrinkle.
Figure 5. Change in wrinkle residual ratio by trials (averages of 8 subjects)
Additionally, we tried to understand the effects and issues that the subjects had felt through questionnaire and interview. From the viewpoint of easiness of wrinkle position, six people out of eight preferred presentation method 1 due to small number of overlooking of wrinkles. Regarding the ease of ironing, four people preferred the methods 1 and 3, respectively. The subjects who preferred 1 cited effectiveness in grasping the entire wrinkle and making plans for themselves as factors. In addition, the subjects who chose method 3 preferred the point that they could easily iron by leaving themselves
Figure 6. Change in wrinkle residual ratio by trials (a case with a subject who did not gradually decreased the residual ratios)
to the guide of the system. Based on the evaluation of the wrinkle residual ratio and the subjective analysis, we consider that presentation method 1 allows the user to iron effectively by utilizing the presented information about wrinkle area.
On the other hand, most subjects pointed out an issue that the effect of wrinkle reduction was hard or unable to confirm in any of the presentation methods. We consider that the issue contains three difficulties:
• Difficulty in confirming that wrinkles are decreased after an iron passed in a timely manner
• Difficulty in confirming the change of the presentation of wrinkles that should be certainly decreased as trials are repeated
• Difficulty in confirming the change of the level of wrinkles as trials are repeated
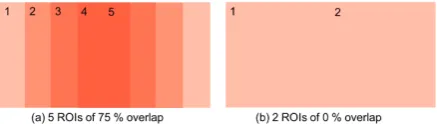
The first difficulty comes from the lack of real-time property. In the experiment, the existence of wrinkle is judged at the end of each trial that takes about 25 sec. This means that the user cannot see the result until ironing on an entire clothes surface is finished. To realize timely presentation, the judgement should be updated against an area where the iron just passed by tracking the position of an iron. In addition to tracking the position of an iron, any object that occludes the surface of clothes, e.g., the body of an iron and the forearm of the user, should be detected. We consider that this is realized by using the background differencing technique in the current system configuration or using depth-information in advanced configuration. As shown in Section 4.4, it takes about 3 seconds to complete judgement of an entire surface; however, the “selective judgment” may allow huge reduction of processing time. For example, it takes only 0.048 sec to judge for an area of 11.25×11.25 cm2 (=16 ROIs with 25% overlapping).
with 5 ROIs of 75 % overlap is identical to that of 2 ROIs of 0 % overlap. Although the intensity of the projected color was designed to be changed based on the level of overlap byα–blending, we consider that the actual intensity change was not sufficiently perceptible to the subject. Therefore, distinguishable colors should be chosen and assigned based on the level of overlap, rather than intensity change. For example, yellow, red, magenta, and blue, are assigned to overlap of 0, 1, 2, and 3 ROIs in the current 75 % overlap ratio.
Figure 7. Same areas with difference overlaps of ROIs
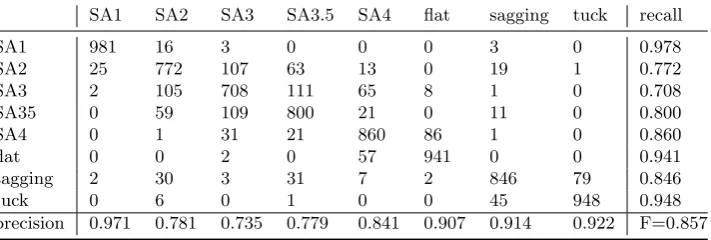
The third difficulty implies that the need for reflecting the level of wrinkle. Currently, SA1 (highest level of wrinkle) and SA4 (lowest level of wrinkle), as well as others, cannot be distinguished because the five levels of wrinkle classes from SA1 to SA4 are integrated into one class of wrinkle. So, fine-grained wrinkle classification should improve the user’s feeling of achievement of wrinkle reduction. We carried out an additional evaluation for detail class, i.e., 8 classes, classification using RandomForest classifier with 10 trees. Here, feature subset was selected in the same way as in Section 4.2, and selected ones are fractal,
contrast, ASM45, variance, RLN0, ASM90, RLN45,
energy, ASM135, SRE0, hardness, IDM135, RLN135, ASM0, IDM45, which appear in the order of adding to subset. Table 5 shows confusion matrix. An average F-measure is 0.857, which degraded from that of 4 class problem by 0.07, and 8.6 % of mis-classification of SA4 intoflat is found; however, we consider that the degraded performance could be overcome by applying filtering or interpolation against a two dimensional array of classification results.
6. Conclusion
In this article, we proposed a method and a system for beginners to reduce wrinkles in ironing of a shirt. The key idea is to enhance the area of wrinkles through an overhead video projector, in which a wrinkle area detection method and a presentation method are investigated. The wrinkle detection method relies on machine-learning that classifies a small ROI, i.e., 32 × 32 pixels, into four classes including
wrinkle, flat, sagging, and tuck. As classification features for these four classes, we firstly listed 47 features representing 1) frequency domain characteristics especially effective for fabric wrinkle evaluation, 2)
complexity of intensity surface, and 3) continuity of pixel intensity. Regarding wrinkle enhancement, three types of presentation were investigated, which includes 1) full ROIs enhancement, 2) around iron enhancement, and 3) iron leading enhancement. These presentation method were integrated into a prototype system in combination with selected feature subset calculation and a classifier model. A user study with eight people was conducted to see how well the presentation for wrinkle reduction works and which method is the best way of enhancement. Also, further analysis for reducing wrinkles was presented.
The following results were obtained:
• In classifying four classes, RandomForest per-formed best in Na¨ıve Bayes, MLP, SMO, and RandomForest classifiers, in which the average F-measure of all classes is 0.927 and the recall of wrinkle class is 0.930.
• In feature subset selection, we identified top-15 predictive yet less correlated features from 47 candidates based on correlation-based evaluation. By comparing top-15 features based on individual information gain, we showed that the correlation-based subset performed better than information gain-based approach in the average F-measure and the recall of wrinkle. Although classification using all (47) features performed best in classification, the processing speed was four times slower than the correlation-based feature subset.
• In the user study with three different enhancement methods, full ROIs enhancement is slightly more effective in wrinkle removal than the others. We consider that the method facilitates the users to grasp the entire wrinkle and making plans for themselves.
• Three challenges were identified that makes the users aware of the result of their ironing activities to improve the efficiency of ironing: 1) real-time update of result where the iron just passed, 2) clear presentation of the density of wrinkles, and 3) reflecting the level of wrinkles in the enhancement by classification of sub-classes of wrinkles.
Future work includes investigating a method of making a user realize the removal of wrinkles by his/her ironing as effective feedback, which is to address three challenges mentioned above. Also, the wrinkle detection and enhancement components should be integrated into an existing ironing instruction system [32] to support a whole procedure of ironing.
References
[1] Amano, T. and Kato, H. (2010) Appearance control by projector camera feedback for visually impaired. In
Table 5. Confusion matrix of detail class classification with selected features
SA1 SA2 SA3 SA3.5 SA4 flat sagging tuck recall
SA1 981 16 3 0 0 0 3 0 0.978
SA2 25 772 107 63 13 0 19 1 0.772
SA3 2 105 708 111 65 8 1 0 0.708
SA35 0 59 109 800 21 0 11 0 0.800
SA4 0 1 31 21 860 86 1 0 0.860
flat 0 0 2 0 57 941 0 0 0.941
sagging 2 30 3 31 7 2 846 79 0.846
tuck 0 6 0 1 0 0 45 948 0.948
precision 0.971 0.781 0.735 0.779 0.841 0.907 0.914 0.922 F=0.857
Vision and Pattern Recognition - Workshops (IEEE): 57–63. doi:10.1109/CVPRW.2010.5543478, URL http:
//ieeexplore.ieee.org/document/5543478/.
[2] American Association of Textile Chemists and Colorists (AATCC) Smoothness Appearance
Repli-cas, http://members.aatcc.org/store/smoothness/292/.
URL http://members.aatcc.org/store/smoothness/
292/.
[3] Aoyama, H., Ozeki, M. and Nakamura, Y. (2009) Smart Cooking Support System based on Interaction Reproducing Model. doi:10.1145/1630995.1631003,
URL http://portal.acm.org/citation.cfm?
doid=1630995.1631003.
[4] Arning, K., Ziefle, M., Li, M. and Kobbelt, L. (2012) Insights into user experiences and acceptance of mobile indoor navigation devices. In Proceedings of the 11th International Conference on Mobile and Ubiquitous Multimedia, MUM ’12 (New York, NY, USA: ACM): 41:1—-41:10. URL http://doi.acm.org/
10.1145/2406367.2406417.
[5] Bimber, O., Emmerling, A. and Klemmer, T. (2005) Embedded entertainment with smart projectors.
Computer 38(1): 48–55. doi:10.1109/MC.2005.17, URL
http://ieeexplore.ieee.org/document/1381255/.
[6] Chaudhuri, B. and Sarkar, N. (1995) Texture seg-mentation using fractal dimension. IEEE Transactions on Pattern Analysis and Machine Intelligence17(1): 72– 77. doi:10.1109/34.368149, URL http://ieeexplore.
ieee.org/document/368149/.
[7] Fujii, K., Grossberg, M. and Nayar, S. (2005) A Projector-Camera System with Real-Time Photometric Adaptation for Dynamic Environments. In 2005 IEEE Computer Society Conference on Computer Vision and Pattern Recognition (CVPR’05)(IEEE), 2: 1180–1180. doi:10.1109/CVPR.2005.42, URL http://ieeexplore.
ieee.org/document/1467579/.
[8] Fujinami, K.,Inagawa, N.,Nishijo, K.and Sokan,
A.(2011) A middleware for a tabletop procedure-aware information display.Multimedia Tools and Applications
57(2): 269–293. doi:10.1007/s11042-011-0759-4, URL
http://dx.doi.org/10.1007/s11042-011-0759-4.
[9] Funk, M., Kosch, T. and Schmidt, A. (2016) Interactive worker assistance: comparing the effects of in-situ projection, head-mounted displays, and paper instructions. In Proceedings of the 2016
ACM International Joint Conference on Pervasive and Ubiquitous Computing - UbiComp ’16 (New York, New York, USA: ACM Press): 934–939. doi:10.1145/2971648.2971706, URL http://dl.acm.
org/citation.cfm?doid=2971648.2971706.
[10] Funk, M.,Shirazi, A.S.,Mayer, S.,Lischke, L.and
Schmidt, A. (2015) Pick from here!- An Interactive
Mobile Cart using In-Situ Projection for Order Picking. In Proceedings of the 2015 ACM International Joint Conference on Pervasive and Ubiquitous Computing -UbiComp ’15(New York, New York, USA: ACM Press): 601–609. doi:10.1145/2750858.2804268, URL http://
dl.acm.org/citation.cfm?doid=2750858.2804268.
[11] Galloway, M.M. (1975) Texture analysis using gray level run lengths. Computer Graphics and Image Processing 4(2): 172–179. doi: 10.1016/S0146-664X(75)80008-6.
[12] Grossberg, M., Peri, H., Nayar, S. and Bel-humeur, P.(2004) Making one object look like another:
controlling appearance using a projector-camera sys-tem. In Proceedings of the 2004 IEEE Computer Society Conference on Computer Vision and Pattern Recognition, 2004. CVPR 2004. (IEEE), 1: 452– 459. doi:10.1109/CVPR.2004.1315067, URL http://
ieeexplore.ieee.org/document/1315067/.
[13] Hall, M.A.(1999)Correlation-based Feature Selection for Machine Learning. Ph.D. thesis, The University of Waikato.
[14] Han, J., Yang, M. and Matsudaira, M. (2003) Analysis of Wrinkle Properties of Fabrics Using Wavelet Transform.Journal of Textile Engineering 49(3-4): 54– 59. doi:10.4188/jte.49.54.
[15] Haralick, R.M., Shanmugam, K. and Dinstein, I.
(1973) Textural Features for Image Classification.IEEE Transactions on Systems, Man, and Cybernetics 3(6): 610–621. doi:10.1109/TSMC.1973.4309314, URL http:
//ieeexplore.ieee.org/document/4309314/.
[16] Herstory Co. Ltd. (2012) Survey on
liked/disliked/confident housework among 1000 women (original title and contents written in Japanese), http://herstory.co.jp/hs/lab/life/lab-835. URLhttp://
herstory.co.jp/hs/lab/life/lab-835.
Transactions on Circuits and Systems for Video Technol-ogy8(8): 968–975. doi:10.1109/76.736726, URLhttp://
ieeexplore.ieee.org/document/736726/.
[18] Jingjing Sun, J., Ming Yao, M., Bugao Xu, B.
and Bel, P. (2011) Fabric wrinkle characterization and classification using modified wavelet coefficients and support-vector-machine classifiers.Textile Research Journal81(9): 902–913. doi:10.1177/0040517510391702,
URL http://trj.sagepub.com/cgi/doi/10.1177/
0040517510391702.
[19] Kato, H. and Billinghurst, M. (1999) Marker tracking and HMD calibration for a video-based augmented reality conferencing system. In Aug-mented Reality, 1999. (IWAR ’99) Proceedings. 2nd IEEE and ACM International Workshop on: 85–94. doi:10.1109/IWAR.1999.803809.
[20] Lin, K.H., Lam, K.M. and Siu, W.C. (2001) Locating the eye in human face images using fractal dimensions.IEE Proceedings - Vision, Image, and Signal Processing 148(6): 413. doi:10.1049/ip-vis:20010709,
URL http://digital-library.theiet.org/content/
journals/10.1049/ip-vis_20010709.
[21] Liu, C. (2014) New Method of Fabric Wrinkle Measurement Based on Image Processing. FIBRES & TEXTILES in Eastern Europe 22(103): 51–55. URL
http://www.fibtex.lodz.pl/article1233.html.
[22] Machine Learning Group at University of Waikato Weka 3 - Data Mining with Open
Source Machine Learning Software in Java, http://www.cs.waikato.ac.nz/ml/weka/. URL http://
www.cs.waikato.ac.nz/ml/weka/.
[23] McFarlane, D.C. andWilder, S.M. (2009) Interac-tive dirt: increasing mobile work performance with a wearable projector-camera system. InProceedings of the 11th international conference on Ubiquitous computing, Ubicomp ’09 (New York, NY, USA: ACM): 205–214.
URLhttp://doi.acm.org/10.1145/1620545.1620577.
[24] Murata, S., Suzuki, M. and Fujinami, K. (2013) A Wearable Projector-based Gait Assistance System and Its Application for Elderly People. In Proceed-ings of the 2013 ACM International Joint Confer-ence on Pervasive and Ubiquitous Computing, Ubi-Comp ’13 (New York, NY, USA: ACM): 143–152. doi:10.1145/2493432.2493472, URL http://doi.acm.
org/10.1145/2493432.2493472.
[25] Neil, G.andCurtis, K.(1997) Shape recognition using fractal geometry. Pattern Recognition 30(12): 1957– 1969. doi:10.1016/S0031-3203(96)00193-8.
[26] Ogasawara, R., Yamaki, T., Tsukada, K.,
Watanabe, K.and Siio, I.(2007) Interactive cleaner. In Domestic Symposium on Entertainment Computing
(Information Processing Society of Japan): 71–74.
URL http://siio.jp/projects/papers/ec2007-39.
PDFhttp://hdl.handle.net/10083/56971.
[27] Peitgen, H.O., J¨urgens, H. and Saupe, D. (2004)
Chaos and Fractals (New York, NY: Springer New York), 2nd ed. doi:10.1007/b97624, URL
http://link.springer.com/10.1007/b97624http://
carlosreynoso.com.ar/archivos/peitgen.pdf.
[28] Pinhanez, C. and Podlaseck, M. (2005) To Frame or Not to Frame: The Role and Design of Frameless Displays in Ubiquitous Applications. In Proceedings of the 7th international conference on Ubiquitous Computing (Springer-Verlag): 340–357. doi:10.1007/11551201 20, URL
http://link.springer.com/10.1007/11551201_ 20https://pdfs.semanticscholar.org/9410/
087aaf7e772be88b2e0740190e2c5011682d.pdf.
[29] Sato, A., Watanabe, K. and Rekimoto, J. (2013) MimiCook. InProceedings of the 8th International Con-ference on Tangible, Embedded and Embodied Interaction - TEI ’14 (New York, New York, USA: ACM Press): 121–124. doi:10.1145/2540930.2540952, URL http://
dl.acm.org/citation.cfm?doid=2540930.2540952.
[30] Sokan, A., Egi, H. and Fujinami, K. (2011) Spatial connectedness of information presentation for safety training in chemistry experiments. In
Proceedings of the ACM International Conference on Interactive Tabletops and Surfaces, ITS’11: 252–253. doi:10.1145/2076354.2076401.
[31] Sokan, A., Hou, M., Shinagawa, N., Egi, H.
and Fujinami, K. (2012) A Tangible Experiment Support System with Presentation Ambiguity for Safe and Independent Chemistry Experiments. Journal of Ambient Intelligence and Humanized Computing 3(2): 125–139. doi:10.1007/s12652-011-0079-6.
[32] Suzuki, K. and Fujinami, K. (2014) An Ironing Support System with Superimposed Information for Beginners. In 2014 IEEE 38th International Computer Software and Applications Conference Workshops
(IEEE): 552–557. doi:10.1109/COMPSACW.2014.92,
URL http://ieeexplore.ieee.org/document/
6903188/.
[33] Suzuki, Y.,Morioka, S.andUeda, H.(2012) Cooking Support with Information Projection Onto Ingredient. In
Proceedings of the 10th Asia Pacific Conference on Com-puter Human Interaction, APCHI ’12 (New York, NY, USA: ACM): 193–198. doi:10.1145/2350046.2350084,
URLhttp://doi.acm.org/10.1145/2350046.2350084.