Development Of Generalization Tool For
Preparation Of Smaller Scale Data Set From
Existing Larger Scale Vector Data
M Praveen Kumar, Kaushik Dey, Dr. M Viswanadham, Mahesh RavindranathanAbstract: Map preparation is tedious problem from the past. To prepare a map so many people need to work and the time taken to generate a map is tedious. And it is a heavy process because we need to keep every detail required in the map. So human interpretation is important there and way to occurrence of errors also more while in the map generation process. To generate a complete map of each data it takes much time, if we want to prepare a selective data of map with a particular scale it is more difficult because to select purpose of map and scale of the map and which data to be retained in the map. More human interpretation and skills are required to achieve these results. These will be overcome by the generalization process. The generalization process is also very lengthy and time to reduce all these we plan to automate/semi – automate the tool process to have the generalized tools. These process of generalization will cover maximum of the problems faced while map generation. Because of the technological look over these problems the solution is made out by preparing required tools that will help to generate the map. So many instruments made automation of map generation and many developments are currently in trend to produce the generalized map. The tool development will reduce this generalization process to much extent. There are some multi-disciplinary ways of using the arcpy site package and using the Pre – defined codes and functions to develop the generalization tools. By taking into account the algorithms of generalization process we will develop the tools which will act as automation process. We can design a tool and by using the ArcGIS software functions and classes for our generalization process. The outputs are generated by giving the inputs in designed tools. The standard tools are developed finally that will generate the generalized map of 1:250k scale by using the 1:50k vector data. The study achieves the generalization tools by working on the 1:50k vector data. Many exceptions are taken into consideration while developing the generalization tools. Everyone has different procedures to develop the generalization tools. We are planning to develop the generalization tools in ArcGIS environment.
Index Terms: Generalization, ArcGIS, Digitization, Developed Tools,Python
————————————————————
1 INTRODUCTION
Generalization is the process of analyzing the data whether to keep it in or to remove it from existing scale map. This process is done to represent the data in a legible manner and also to change the data representation from large scale map to small scale map. Most of the work involvement in this process is manual way of doing it. As the process will take more man power and also much time to complete, now everyone looking forward for semi-automate or fully automate this generalization process. [1][4]Creation of automated generalization tool for building polygons by taking aggregate polygon as the first step and followed by spatial joint of lost attributes in the process of aggregate polygon, removing different conflicts by considering density to generalize building features. Also testing of simplify building and aggregate polygon tools. And this project is about ‘Development of generalization tool for preparation of smaller scale data set from existing larger scale vector data’. [6]In cartographic generalization different stages of mapping involve analysis, selection, simplification, clarification and harmonization.
Deals with different algorithms and different tools usage for generalized data management. The automation process is done to reduce not only the human efforts involved in working but also to reduce the human errors involved in this process. As there is much scope of error involvement while doing this process manually, we need to go for automation/semi - automation of this process. [5][7]Discusses the level of automation of developed tools on road, building and centerline features also concentrates on the reduction of data by retaining the shape. Considering road generalization converting dual road into single road features and building generalization takes changing to block of buildings from many single building features. [9]Defining map specifications derived with optimal approach and automatic workflows are defined for working on road features and building features. For repeating this process any number of times it is simple if we go for automation of this generalization process. To develop these generalization tools we need to follow some procedures. We need to arrive at some algorithms that are procedure to create the tool. [2]Involves mathematical system and algorithms have the iterations following the selection of cells and relation among the neighbouring cells. This generalization process depends on the cell selection and their values. This generalization process deals with real world application similar to urban growth modeling. By considering this algorithms with the help of software’s we are going to develop the tools. [3]Generation of geospatial datasets on consideration of basic geospatial dataset at basic standard mapping scales by developing workflows. Multi-resolution geo-database was prepared to visualize the generalized data. In this development of the generalization tools we are considered with the python language. The main reason for considering python language as the primary one - because in ArcGIS software the new tool development is done using python language only. [8]Generalization procedure, legibility of map preparation discussions, factors for maintaining legibility - map scale and
____________________
Mangilipalli Praveen Kumar is with the Department of Center for Spatial Information Technology (Geo-informatics and Surveying Technology, Institute of Science and Technology, Jawaharlal Nehru Technological University, Hyderabad, Telangana, India. E-mail: [email protected]
Shri Kaushik Dey is working as Officer Surveyor with the GIS & RS Directorate, Survey of India, Uppal, Telangana, India.
Dr. M Vishwanadham is a Professor and Former Director with the Departments of Civil Engineering and Centre for Spatial Information Technology, Jawaharlal Nehru Technological University Hyderabad, Telangana, India.
331 purpose of map. Different generalization methods named
simplification, selection and ommittance. By considering these things generalization tools and their algorithms are prepared. Python is the coding language which is used to write the code to work in particular software like ArcGIS. [10]Development of automated map generalization discusses the change of generalization process from traditional to modern technology. And to what extent these developed tools are working with automation procedure. We can use that language for completing some scripts that are used as the extension for the present code to obtain some work. In this development of generalization tools we are involved in developing the basic generalization tool that is used for the generalization of the point and polygon features. And we have generalization tools of roads, hydrology and buildings.
2 METHODOLOGY
We are going to understand the generalization process manually working with the data available. While working with the data we can understand the generalization process. We can note down the steps that are involved in the generalization process. Those steps are the main thing to prepare the algorithm of the different tools. After this we are going to prepare the flow of steps that are to be used for tool development. All this is done only after understanding the generalization process only. After that we are going to develop the tool for written algorithm of the generalization tools. This is done mainly by developing the code in python. By using different functions related to the python in ArcGIS we are going to develop the tool. In ArcGIS we are concerned with the Arcpy - one of the modules of the python which deals with the GIS data for handling different works of that particular data. In Arcpy we are having different functions that are already pre-defined. We need to work with pre-defined functions only, because ArcGIS is the proprietary commercial software. We need to use the provided functions.
Algorithms
Algorithm is the procedure to be followed to achieve the required output. For developing generalization tools I followed procedure to create that particular tool. The tools that I worked are on Roads, Buildings and Hydrology. Also worked on Basic generalization tool refers to the reduction of excess data present in the map. The main principle that we use in generalization procedure is the reduction of excess data in the map and to make the map look legible. The reduction of data is done because we are converting the small scale map to large scale map. By following the generalization process manually I came across the algorithms that are suitable to the particular tool. I continued to work on the generalization process of Roads, Buildings and Hydrology and got procedure to automate them. I identified different parameters and considered them for work to be done. I worked with the ModelBuilder present in arcgis. ModelBuilder is the application that is present in arcgis software used to create, edit and manage models. Models are workflows to connect different geoprocessing tools. The tools I worked are on the Basic Generalization tool, Roads Generalization, Building generalization and Hydrology Generalization. Basic generalization tool is applicable for any point, polygon features and it is not applicable to line features because it misses the connectivity between the features. In Road generalization we have ‘‘Update by Connectivity’’ and ‘‘Simplify Roads’’ as
different tools. In Building generalization we have ‘‘Isolated Building’’ and ‘‘Split Blocks by Road’’ are two different tools. From Hydrology generalization we have ‘‘Simplify Streams’’, ‘‘Generalize Tanks’’ and ‘‘Embankment - Centerline’’ are the tools. I have done the algorithms for the above generalization tools by doing the work of generalization manually.
2.1 Algorithm of Basic Generalization Tool
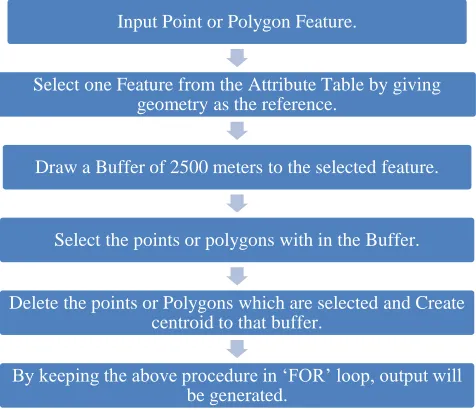
Basic generalization tool is for point and polygon features. It is not good for line features because the line features will not have connectivity when the tool runs. The procedure involved in basic generalization tool is we need to access to attribute table at first.
Figure 1 Flow Diagram of Basic Generalization Tool
Afterthought selection of point/polygon feature from the attribute table by taking geometry of the feature as base consideration. In attribute table geometry column is present that contain the feature geometry. Draw 2500m buffer to the selected feature and select the other similar features within that buffer. Delete the similar features selected in the buffer. Keep all these steps in the ‘FOR’ loop to repeat the procedure further. After deleting draw centroids to buffered features. And save them back to the attribute table and delete the buffers. Now created centroids are the output for the tool. The created centroids are the same features where we first selected and drawn buffers to it. Those points are seen in output finally.
2.2 Algorithm of Update by Connectivity Tool
Road generalization is done by reducing the density of roads in map. The roads are reduced by deleting them. Deleting them will give us the output but misses the connectivity towards buildings. The tool can be designed not only to have connectivity towards building we can further consider any feature related to connectivity. But I considered only buildings/blocks towards connectivity concern. So to maintain connectivity we need to consider them. The tool starts with selection of the road feature that having the length of road prior to minimum length that is given in the tool. Further deletion of this selected roads which are less than minimum length of road. Then select the remaining road features. Draw the buffer of 2500m for selected road feature. In that buffer if any block/building features are present retain that road features
Input Point or Polygon Feature.
Select one Feature from the Attribute Table by giving geometry as the reference.
Draw a Buffer of 2500 meters to the selected feature.
Select the points or polygons with in the Buffer.
Delete the points or Polygons which are selected and Create centroid to that buffer.
otherwise delete that road features not having any building/block features.
Figure 2 Flow Diagram of Update by Connectivity Tool
2.3 Algorithm of Simplify Roads Tool
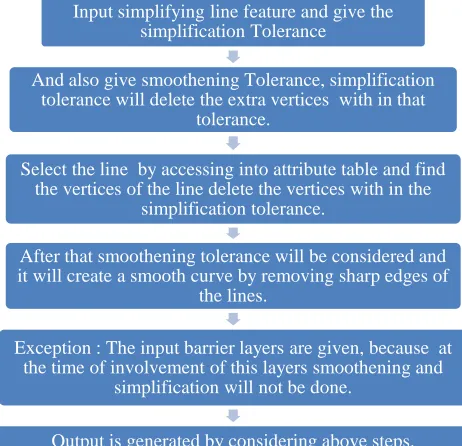
Simplifying the roads will consider simplification and smoothening of that particular road feature. Both the things need to be involved in tool development. Where simplification involves deletion of extra vertices involved in digitizing work. Smoothening refers to retaining the shape of the feature but removing the sharp edges. Firstly in this tool we are going to select the road feature. Then by doing editing vertices are found out. Simplification tolerance gives us the consideration of the vertices within that range and looking for the vertices every time within that tolerance. In that tolerance the tool keep only 2 to 3 vertices by removing every other. Smoothening tolerance will keep the smoothed shape like it generates the smooth curve instead of sharp edges.
Smoothening concentrates on the sharp edges of the feature and makes them smooth. But every time there may not be a requirement of Smoothening and simplification. Some times while in process we need to stop the process of this smoothening and simplification because of some exceptions like while simplifying road feature in the middle there may be ‘‘Mile Stone’’, ‘‘Under Pass’’ which we shouldn’t exclude. While in process these are to be taken as the exceptional cases where simplification and smoothening will not be done there. For this to happen there is the barrier layer present in the tool we have to give any number of barrier layers where in the process if the barrier layer appears the simplification and smoothening will not take place and after that the procedure of the tool continues. There for stopping the tool procedure at the barrier layer we need to identify the layers in between the process of smoothening and simplification. Then usage of ‘‘Break and Continue’’ will make follow the tool running again. After taking all this considerations of barrier layers and smoothening and simplification of layer the output is generated.
Figure 3 Flow Diagram of Simplify Roads Tool
2.4 Algorithm of Embankment - Centerline Tool
Hydrology generalization is the generalization process for hydrology features. In hydrology we have both line and polygon features. Embankment – centreline tool is for hydro area. Hydro area is defined as the river area. We consider river as polygon and in this tool we will convert some part into centreline of the river. This conversion depends on width.
Input the Road feature and Blocks feature.
Also give the Buffer length and Minimum length of the Road.
Firstly, selecting of roads that are having minimum road length and roads which are below the minimum length are deleted.
Secondly, draw buffer to the selected roads which are remaining after deletion.
Search for the blocks after buffer is drawn.
Retain the road features which are surrounded by the blocks and delete the roads where blocks are not present.
Input simplifying line feature and give the simplification Tolerance
And also give smoothening Tolerance, simplification tolerance will delete the extra vertices with in that
tolerance.
Select the line by accessing into attribute table and find the vertices of the line delete the vertices with in the
simplification tolerance.
After that smoothening tolerance will be considered and it will create a smooth curve by removing sharp edges of
the lines.
Exception : The input barrier layers are given, because at the time of involvement of this layers smoothening and
simplification will not be done.
333
Figure 4 Flow Diagram of Embankment - Centerline Tool
Firstly we start at selection of river polygon. Then width of the river to be decided with that width we are going to convert river polygon into polyline/line. If the river width is less than the width we assume, then we are going to convert them to polyline/line. Other features are remained as the polygon features only. For those features which are remained as the polygons are created with embankment by assumed width. The output is generated with more features combined with polyline/line and polygon features. Because the features that are less than assumed width is converted to polyline/line, other polygon features are retained as polygon features only but for them considering the width embankment is created. So the features for by running this tool increases.
2.5 Algorithm of Tank Generalization Tool
Tank generalization deals with the generalization of tanks features in the map. The tank features are the polygon features which contains area. Procedure of tank generalization involves selection of the tank features where their area is less than 625 m2. Delete the selected tank features whose area is 625m2. After that select the remaining tank features whose area is 1000m2 from attribute table. Draw buffer for the remaining selected tank features whose area is less than 1000m2. And take the count density value with in the buffer. For every buffer take the count value within it. The count is the number of tank features present within the buffer drawn. If count of tank features in buffer is greater than or equal to assumed count then tank features within the buffer is deleted. If the count of tank features in buffer are less than the assumed count then tank features in buffer are converted into point features. The output generated is either point and reduced polygon tank features or only reduced polygon tank features. The output depends on the assumed count and the count value of the tank features within the buffer.
Figure 5 Flow Diagram of Tank Generalization Tool
2.6 Algorithm of Simplify Streams Tool
Simplify streams tool is similar as the simplify roads. Here also we consider the two tolerances simplification and smoothening. Simplification is to simplify the vertices by reducing the number of vertices within the tolerance range. Smoothening is defined as the converting the sharp edges in the feature to smooth curves. Smoothening involves smooth curve by addition of vertices at that sharp edge. All this is done while editing option is active. Every time while tool is running there is no need of simplifying the streams at particular places.
Figure 6 Flow Diagram of Simplify Streams Tool
Barrier layers are introduced into the process so that there at the time of encounter of barrier layers simplification and smoothening will not run. Same like simplifying road features here also barrier layers will play important role. Simplification
Input is given as the polygon feature of the water as Hydro area.
Identifying the perennial channels and drawing of centre line takes place.
Identify the Non perennial channels and drains and canals and perennial drains, delete all of them.
Consider the input width as the minimum width to keep the polygon features as it is and those features
embankment also exist.
Output is generated with polyline and polygon features containing the centreline for channels and embankment
polygon for lakes and river areas.
Input tanks layer feature and give buffer and count density values.
Firstly, Select the tank features whose area is less than 625 m2 from
attribute table and deletion takes place.
Secondly, draw buffer to the remaining tank features that have area less than 1000 m2.
If the count density with in the buffer is less than or equal to number of tanks the tank will be converted to point feature other
wise it will remain polygon feature.
Output is generated either with both points and polygons or only with reduced count of the polygon features of the tank.
Input simplifying line feature and give the Simplification Tolerance
And also give smoothening Tolerance, simplification tolerance will delete the extra vertices with in that
tolerance.
Select the line by accessing into attribute table and find the vertices of the line delete the vertices with in the
simplification tolerance.
After that smoothening tolerance will be considered and it will create a smooth curve by removing sharp edges of
the lines.
Exception : The input barrier layers are given, because at the time of involvement of this layers smoothening and
simplification will not be done.
and smoothening not work at the barrier layers sight, because if the tool runs at the barrier layers also they may miss different considerations. If streams are taken as input they shouldn’t exclude ‘‘Stony waste’’, ‘‘Other Order Streams’’. At this point/line features if the smoothening and simplification is done they misses out the barrier layers original data.
2.7 Algorithm of Isolated Building Tool
Building generalization is the generalization process of reducing the built-up area. In this reduction of buildings will take place. There are some conditions to follow to develop this tool. In this tool there involves the buffer of the buildings and area of the buildings. The mentioned buffer and area of buildings will define the particular buildings to be stay in map and others are to be removed. And some of the building features are converted to point features in this process. Identify the block/buildings layer from the input and then selection of the building features whose area is 2500m2. The area of each building feature is present in the attribute table, by accessing into the attribute table we will select the building features whose area is 2500m2. Draw buffer to the selected building features.
Figure 7 Flow Diagram of Isolated Building Tool
Buffer value is about 50 to 100m. The value can be s changeable. The area is considered that value only because to convert from 1:50k to 1:250k. Search in the buffer for any other blocks whose area is equal to or less than 2500m2, convert them to point features. Other building feature whose area is greater than 2500m2 is remained as the polygon features only. The building features that are converted as the point features are defined as the isolated buildings. Building features are polygon features firstly and then some of the building features are converted into point features. The output is the combination of point and polygon features. Point features are created by considering the area of the building features. For searching the building features within the buffer we are going to use the search function in arcgis. The search function to be written after the buffer function or within the function of buffer so that after that buffer function only search will go.
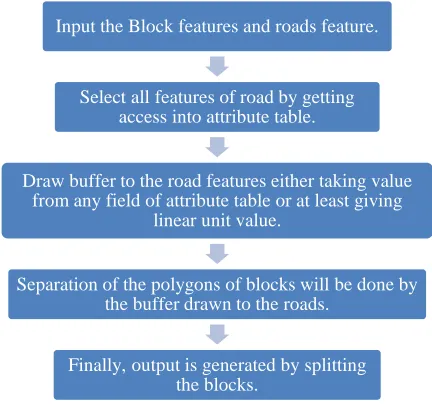
2.8 Algorithm of Split Blocks by Road Tool
A Split block by road tool is done to split the building features into individuals or split some building features into one block. Block feature contains the building features in much number. Many building features are taken as the polygon feature and name it as the block feature. If the building features of having same importance and present at one place we will consider them as block features. We can split blocks into small blocks by using this tool. Here in this tool first we are going to select the block/building features and also the road features. By accessing to the attribute table select the all features of the road. With the help of the road blocks are separated. After selecting the road features now we are going to draw the buffer to that road feature. The buffer is taken from the distance field either it is taken from any attribute table field or we can give the value manually. Then separation of block/building features are done by considering that buffer distance of road features. We are going to separate the blocks/ buildings where the road pass between them. The separation of blocks/buildings is buffered distance of road feature between them. The output generated is reduction of block/building features by applying road features. Because after drawing buffer to the road features there may be many block/building features that comes under this buffer so they are excluded because the separation is done by considering that buffer distance. So the output is reduced polygon features of block/building.
Figure 8 Flow Diagram of Split Blocks by Road Tool
3 RESULTS
Results are derived from the tools which are developed. The desired inputs are given and some inputs are needed to be accessed from server if required. The inputs are very important to be in desired feature class. The inputs may be given in gdb form/feature class form/feature dataset form. It is mentioned in the tool whether to give which form as input. And also need to mention the other requirements. The other requirements are giving the width at some point and also to give the buffer length in some tools. In some tools we need to give the tolerances required for the input to generate output. In some tools minimum area is to be given and count density is also to be given in some tools to find the count value within the buffer drawn. Some inputs require barrier layers also as the input. These barrier layers will provide support/restriction to the main
Input the blocks polygon feature/built up area.
Identify and select the blocks having the area 2500 m2, and
draw buffer to the selected features.
Search with in the buffer any other block presence . If any other block identifies leave it as the polygon.
Otherwise, make the polygon into point feature.
Output is generated with both point and polygon features from given polygon features.
Input the Block features and roads feature.
Select all features of road by getting access into attribute table.
Draw buffer to the road features either taking value from any field of attribute table or at least giving
linear unit value.
Separation of the polygons of blocks will be done by the buffer drawn to the roads.
335 input. The barrier layer input is used for not working of that
particular tool while encounter of barrier layer. We can give any number of barrier layer inputs if required. We need to mention correct units pertaining to the values giving as the buffer length/width etc. if we miss the units also the result will go wrong. All these values play a major role in generating the output. The outputs are generated after running the tool successfully. Because to run the tool successfully we need to give every requirement in the tool correct. If we forget any single point the error will be shown with the message. If we give output path also wrong it will also create a mess. For the output to generate correctly we need to provide a perfect path. The output also saved sometimes in default gdb. Sometimes these outputs are saved in temporary gdb. For default gdb there is no need to give path but for temporary gdb it is required. In some other tools the output is directly saved as the feature class which as the shape file. And excluding default gdb every time we need to provide path to save our output. From the tools given above the outputs are generated in temporary gdb, feature class and in first tool the output is generated by overwriting the input given.
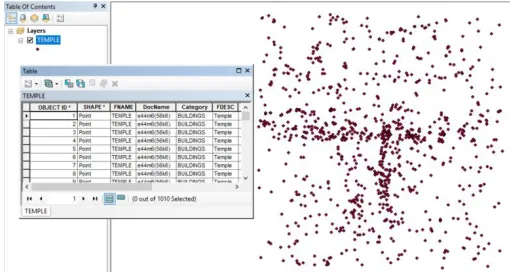
3.1 Basic Generalization Tool Input
Input for this tool is either point or polygon features. The figure shows temple features and its count in attribute table.
Figure 9 Input of Basic Generalization Tool Output
In the output there is reduction of features of temple and representation is uniform of remaining features, the reduction is observed in attribute table by considering count.
Figure 10 Output of Basic Generalization Tool
3.2 Road Generalization – Update by Connectivity Tool Input
There are different inputs that to be given to this tool. Firstly, the road network layer followed by buffer length and build-up features and minimum length of road features. The figure shows attribute table with count of the road features.
Figure 11 Input of Update by Connectivity Tool
Output
By using the minimum length and drawing the buffer around the road features they are quantified. Minimum length is considered to remove that road features below that length and within buffer more building features are present those road features are retained. There are two outputs one with reduced road features and the second with removed features. The variation can be observed by looking into count of attribute table. In the second output there is count values that are present which are removed from the input. The count values in the first output and in the second output are equal to the count value present in the input.
Figure 13 Output of Update by Connectivity Tool
3.3 Road Generalization – Simplify Roads Tool Input
The input for this tool is road features and smoothening and simplification tolerances. There are barrier layers those are used as the exception where simplification and smoothening will not perform there. The figure shows attribute table with the count of road features.
Figure 14 Input of Simplify Roads Tool
Output
The output formed will not reduce any count in attribute table, but there is change in vertices from input to output. This is shown in figure by highlighting the input in input and output overlapped on one other. There is formation of straight line besides the highlighted line which is output with reduced vertices.
Figure 15 Output of Simplify Roads Tool
3.4 Hydrology Generalization – Embankment – Centerline Tool
Input
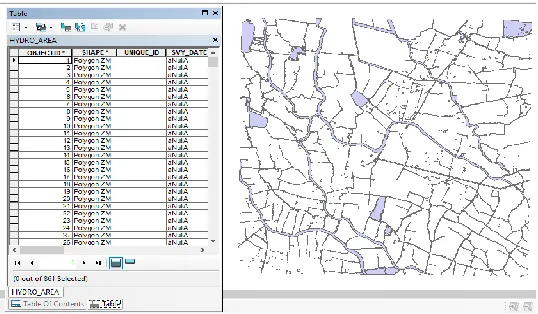
Inputs for this tool is Hydro area or river features, these are polygon features. Width of the river is also need to be given as input so that decision to convert to line features is done.
Figure 16 Input of Embankment - Centerline Tool
Output
There is formation of two outputs first will show the polylines and polygons formed for not satisfying the width criteria. In the second output there are only the retained polygon features with the embankment drawn to them. The count of features will increase from input to output because there is generation of embankment – centerline for features on considering minimum width of the river. Features below this width are converted to line features which are considered as streams features.
Figure 17 Output of Embankment - Centerline Tool
337 3.5 Hydrology Generalization – Tank Generalization Tool
Input
The input is the tank features which are polygon features. Also buffer is given as input and count density. Count density within the buffer will decide to features to be deleted or not. It will mainly reduce the tank features in the output by taking the input.
Figure 19 Input of Tank Generalization Tool
Output
The output from this tool is the reduced tank features. Output is generated because of deleting the tank features. We can observe that in the count of the attribute table is reduced from input to output. Reduction of tank features is done because of more count within the buffer. If the count value is less compared to the given count the polygon features are converted to the point features. In our output there is only reduction of polygon features identifies.
Figure 20 Output of Tank Generalization Tool
3.6 Hydrology Generalization – Simplify Streams Tool Input
Streams are the input for the simplify streams tool and need to provide barrier layers where the tool will stop working at these layers. Smoothening and simplification tolerances are given for reduction of vertices and for sharp edges. The tool will take input streams from the output generated from embankment – centerline tools those which are converted to line features. The figure shows attribute table with the count of streams in it.
Figure 21 Input of Simplify Streams Tool
Output
There is no change in the total number of features present. As this tool works for removing the extra vertices there is removal of vertices takes place and also Smoothening of sharp edges will be done. In the figure below we can find the output and input overlapped on one another because to show the variation. The highlighted thing in the figure is the output where we can find the equal distribution of vertices not like input. In input the vertices are not uniform and also clumsy. The sharp edges are also turned to smooth shape by retaining the shape as it is in input. All this is done by working with the editing tool. The editing tool will be used to select and edit the features present.
Figure 22 Output of Simplify Streams Tool
3.7 Building Generalization – Isolated Building Tool
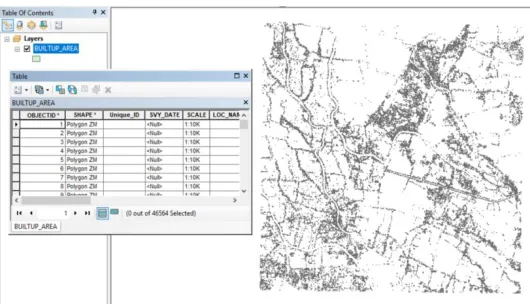
Input
Figure 23 Input of Isolated Building Tool Output
The output from this tool contains both polygon and point features. Major of the features are retained as polygon features while some are converted to point features because of considering the buffer length and minimum area field.
Figure 24 Output of Isolated Building Tool
3.8 Building Generalization – Split Blocks by Road Tool
Input
Figure 25 Input of Split Blocks by Road Tool
The tool will take the input as the building features but this generalization process involves splitting of block/building features by using road features. We will give road features as input and distance will be taken from attribute field value/linear unit. This value is used to draw buffer to road features to divide building features with it. Splitting is done by buffered road
features. Figure shows the road features and their count in attribute table.
Output
Output generated is the reduced building features. There is reduction of total count of building features from input. Splitting is done by deducting the building features that are under the buffered road features. For drawing the buffer the values can be taken from field that is present in attribute table or directly value can be given in distance field of the tool. The features reduction depends on the value that is given in the distance field. Splitting process is done by considering road features and buffer drawn for it.
Figure 26 Output of Split Blocks by Road Tool
4 CONCLUSION
339
REFERENCES
[1] A. Vetter, M. W. (2015). The automatic generalisation of building polygons with ArcGIS standard tools based on the 1:50`000 Swiss National Map Series . 18th ICA Workshop on Generalisation and Multiple Representation (pp. 1-12). Zurich: Esri Switzerland Ltd.
[2] Bo Li, G. G. (2001). Cell-based Model For GIS Generalization. Kingston: School of Computing & Information Systems Kingston University Penrhyn Road, Kingston upon Thames Surrey, KT1 2EE UK .
[3] Daniel O. Nyangweso, T. M. (September 2016). Cartographic Generalization in Multi-scale Environment: Case study of Lamu County, Kenya. International Journal of Science and Research (IJSR),ISSN (Online): 2319-7064,DOI: 10.21275/ART20161673,Volume 5 Issue 9, 804-813.
[4] DROPPOVÁ, V. (2011). THE TOOLS OF AUTOMATED GENERALIZATION AND BUILDING GENERALIZATION IN AN ARcGIS ENVIRONMENT. SLOVAK JOURNAL OF CIVIL ENGINEERING,Vol. XIX, 2011, No. 1, 1 – 7, DOI: 10.2478/v10189-011-0001-4, 1-7.
[5] DULGHERU, F. V. (2011). ALGORITHMS FOR MAP GENERALIZATION WITH ARCGIS SOFTWARE . INTERNATIONAL CONFERENCE of SCIENTIFIC PAPER AFASES 2011 (pp. 596-599). Romania: Geoint Center, Military Technical Academy, Bucharest, Romania .
[6] Ferim Gashi, P. N. (2017). Developments in Cartographic Generalization . Universal Journal of Geoscience 5(3), http://www.hrpub.org,DOI: 10.13189/ujg.2017.050301 , 45-48.
[7] Hardy, D. L. (2005). AUTOMATING GENERALIZATION TOOLS AND MODELS . Redlands, Newyork.: ESRI, Inc. . [8] India, S. o. (2009). GEOGRAPHICAL MAPS. In SOI,
HANDBOOK OF TOPOGRAPHY,SURVEY OF INDIA (pp. 3-105). Hyderabad: Surveyor General of India.
[9] Jantien Stotera, M. P. (2014). Fully automated generalization of a 1:50k map from 1:10k data . Cartography and Geographic Information Science, Vol. 41, No. 1, http://dx.doi.org/10.1080/15230406.2013.824637, 1-13.