http://www.sciencepublishinggroup.com/j/ijbse doi: 10.11648/j.ijbse.20190703.11
ISSN: 2376-7227 (Print); ISSN: 2376-7235 (Online)
Optimizing Different Conditions to Develop a Single
Stranded Phage-Lambda DNA (λDNA) Tightrope
Gali Adamu Ishaku
1, 21
School of Biological Sciences, University of Essex, Essex, United Kingdom
2Department of Biotechnology, Modibbo Adama University of Technology, Yola, Adamawa, Nigeria
Email address:
To cite this article:
Gali Adamu Ishaku. Optimizing Different Conditions to Develop a Single Stranded Phage-Lambda DNA (λDNA) Tightrope. International Journal of Biomedical Science and Engineering. Vol. 7, No. 3, 2019, pp. 61-67. doi: 10.11648/j.ijbse.20190703.11
Received: August 14, 2019; Accepted: September 9, 2019; Published: September 24, 2019
Abstract:
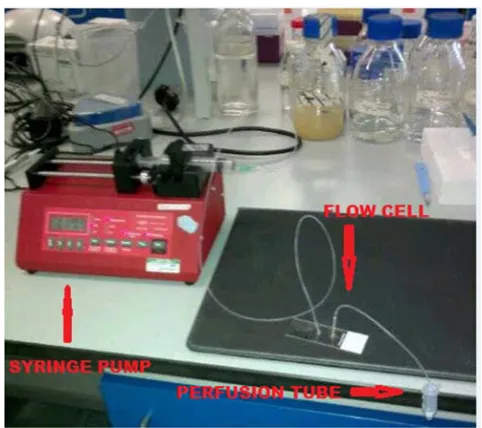
λDNA tightrope can be referred to as λDNA is suspended between two beads above the surface of the flow cell which allows the λDNA to be viewed extended rather than in collapse form. It is use for DNA studies such DNA repairs, but when using the normal protocol (at a velocity of 300 µl/minutes, beads size of 5 µm and concentration of 500.0 µg/ml of 1.0 λDNA) it results to multiple tightropes forming on the beads which interference with a many studies. In this study, different conditions were optimized to develop a single stranded λDNA tight rope by taking into consideration the following conditions, velocity (100 to 600), beads size (3 µm and 5µm), concentration (500.0 µg/ml, 375.0 µg/ml and 250.0 µg/ml) and time. To form the tightrope, beads were added into water in an eppendorf tube, centrifuged and sonicated before putting into the flow cell. The flow cell, syringe pump and perfusion tube were all fixed together, where ABC buffer and λDNA were put into the perfusion tube and set according to protocol to make the tightropes. YOYO-1 dye was used to stain the λDNA before using atomic force microscopy to image the tightropes, the same procedure was repeated for the different conditions and all dispense readings of the flow rate were taken at not less than 3.0 µl/minutes. λDNA on the surface of the flow cell was observed at the velocity of 100 and 200 µl/minutes for all the conditions. The optimized result was at velocity of 300µl/ml, concentration 375.0 µg/ml of 1.0 µλDNA and beads size of 3 µl which lasted for 15 minutes which gave the best result of single stranded λDNA tightrope compared to all the conditions and the normal protocol.Keywords:
Beads, DNA Tightrope, Flow Cell, Phage-Lambda (λDNA) and Yoyo-1 Dye1. Introduction
Phage-Lambda DNA (λDNA) tightrope can be referred to as when λDNA is suspended between two beads above the surface of flow cell which allows the λDNA to be viewed extended rather than in collapse form [1]. DNA tightrope is very useful in Single molecular technique studies because of the advantages it has over other methods which include, the adjacent tightrope which are visible creates a linear network of DNA akin which allow the simultaneous observation of multiple DNA and protein interactions. Another importance of tightrope is that it prevents interaction between DNA or protein and the surface of the flow cell. In addition since the tightropes are suspended between beads, it allows the observation of many modes of protein interactions on the tightrope such as jumping of DNA or protein from one
molecule to another and sliding [2-3].
seen in real time [1, 4, 18-19].
Optimization studies have been performed to enhance real time imaging of protein-DNA interactions following the single molecule technique which includes DNA-binding protein platforms. This approach was initiated over two decades ago when Kabata and colleagues applied dielectrophoresis to extend λDNA [20]. The common feature of this approach for the direct visualization of single molecule DNA-binding protein is the binding and extension of DNA. DNA binding to a specific end on the surface is required for visualization. However, due to the elastic nature of DNA, the binding (tethering) on its own cannot adequately extend a DNA molecule for use in single-molecule imaging using high resolution equipment [1]. Studies reveal that the applications of shear force produced by hydrodynamic flow have been successful in stretching DNA adequately [21-23].
This DNA tightrope when formed, results in multiple strands of DNA forming on beads or multiple tightropes and these multiple tightropes usually clumps together which then interfere with the activities of DNA or protein during experimental studies. In this study, we optimized the different conditions such as, 5 µM and 3 µM bead sizes, Concentrations of 500.0 µg/ml, 375.0 µg/ml and 250.0 µg/ml and Velocity of the syringe pump 100, 200, 300, 400 and 500. Where optimized result was compared to the normal protocolof forming λDNA (beads size of 5 µM, velocity of 300 µl/Mins. concentration of 500.0 µg/ml at not less than 20 mins).
2. Materials and Methods
2.1. λ DNA
λDNA was purchased from New England biolab (NEB). The phage lambda was ligated by adding 1 µl of 500 µg/ml NEB stock to 2 µl 10X ligase buffer (fermentas), 7 µl water, 10 µl DNA, and 1µl T4 DNA ligase (fermentas) which was left at room overnight and stored at -4°C. All the different concentrations of λDNA were used at 1.0 µl and 1X ABC buffer was used to dilute the concentration of the λDNA.
2.2. Buffers
ABC BUFFER- ABC buffer was the standard buffer used in this experimental work and at room temperature. It is made up of 250 mM Tris (PH 7.5), 50 mM MgCl2, 250 mM Kcl and 0.1% sodium Azide. This was made up of 5X stock and diluted to 1X, whenever it is used except otherwise stated.
The ABC DTT Buffer (Imaging Buffer) was made up of 200 µl 1X buffer of ABC buffer, 700 µl water and 100 µL of 100 mM DTT.
2.3. 5µM Poly-Lysine and 3µM Poly-Lysine Coated Silica Beads
500 µl of water was added to 100 µl of 5µM beads (silica monospheres (polysciences) which was then vortex and centrifuged at 14k rpm for 2 minutes. The water was removed and suspended in 400 µl of 350 µl/ml water and
stored at -20°C.
500 µl water was added to the 100 µl of 3 beads of (silica monospheres (polysciences)) which was then vortex and centrifuged at 14k rpm for 2 mins. The water was removed and suspended in 400 µl of 350 µl/ml water and stored at -20°C.
2.4. How Perfusion Tube Was Made
1.5µl eppendorf tube was drilled at two places above and below each other, using a driller. The driller was first connected to source of electricity and the first hole was drilled at 0.5µl of the eppendorf tube while the second hole was drilled at 1.0µl. Another hole was also drilled on centre of the eppendorf tube cover which allows tubing to pass through the hole to the bottom of the eppendorf tube. The hole at the cover slide was sealed with glue after the tubing has passed through it to prevent air flow.
2.5. Flow Cell (Flow Chamber) Construction
Two holes were drilled on standard glass microscope slide 15 mm apart. Then two tubing that fit into the holes were cut and fixed through the two holes, it was glued using UV curing adhesive. It was then left near the window for sun shine to dry over night, but if it is not well dried by next day, it is place under UV light box for one hour to dry properly. After that gasket applied to slide were the two tubing are and the cleaned cover slip was fixed to it to create the chamber. The flow cell was recycled each time they used; it was placed in acetone overnight which makes it possible for the slip cover, gasket and tubing to be removed from the slide. Then new tubing, gasket and cleaned cover slip are used to make the flow cell again.
2.6. How the Syringe Pump and Slip Cover Were Cleaned After Used
The whole contents in the tubing of the syringe pump were usually pumped out to 1.0 µl and methanol was usually withdrawn to 2.5µL and leftover night. The methanol was pumped out before the syringe pump was to be use the next day. The slip cover used is 1.5 (standard) is placed in acetone and sonicator in a sonicator bath for one hour. It is then removed from the sonicator bath and the acetone is poured in the sink. Three beakers of 400 ml were filled with distilled water was and the cover slip was dip three time into each of the beakers and until all the water was removed.
The slip cover used is 1.5 (standard) is placed in acetone and in a sonicator bath for one hour. It is then removed from the sonicator bath and the acetone is poured in the sink. Three beakers of 400 ml were filled with distilled water was and the cover slip was dip three time into each of the beakers and until all the water was removed.
2.7. How the Beads Were Prepared
2 minutes. The water was removed and another 100 µl of water was added. It was then sonicated at cycle 1, 80% amplitude, 4 times after 1 second each time. The beads were added immediately to the flow cell using a special tip. The beads density was checked using Nikkon microscope (at the intensity of 6) and 100µl of water was used to further wash the beads then the beads density was check again. It is then stored at -˚4, if it is not going to be used immediately.
2.8. Addition of λDNA to Flow Cell
99 µl of 1x buffer was added to 1 µl λ DNA (NEB), then it put into the into perfusion tube and withdraw to empty with the help of the syringe pump. 320 µl of one time ABC buffer was also added to the perfusion tube and Set pump according to protocol ‘pump loop’ which allow the λDNA to flow back and forth for not less than 20 minutes and not greater than 2 hours. Finally YOYO dye was used to stain the λDNA before imaging.
Figure 1. Showing syringe pump, flow cell and perfusion tube set according to protocol, where the syringe dispenses the λDNA in and out of the flow cell to form tightropes.
2.9. How to Make a λDNA Tightrope
The flow cell is first filled with water to check if there is any leakage; beads that have been sonicated at 1 cycle by 80% amplitude were put into the flow cell using a tube with a special tube on it that can fit the tube of the flow cell. After that beads density is check on a light microscope at 6 to view the beads density and if the density is less then it is throw any and another one is made. When the beads density is right, the 1X ABC buffer, λDNA and imaging buffer are all added according to the manual’s instruction into the perfusion tube. Then the syringe pump, flow cell and perfusion tube are all set fixed together and the syringe pump was set according to protocol to form the tightrope.
500µl 1xABC buffer was put in an eppendorf tube and then withdrawn into the tubing of syringe pump with careful consideration making sure there is no air bubble. At one end of flow cell tubing was fixed to the tubing of the perfusion tube and the other end of the flow cell the tubing of flow cell was
fixed to syringe pump. 500µl ABC was put into the perfusion tube and withdrawn to empty; finally the λDNA was put into the perfusion tube and set according to protocol. This was done with careful consideration at any time to avoid air bubble.
The tightropes are constructed using a flow cell (flow through chamber) that allows solutions to pass over beads (poly-L-lysine-coated beads). The solutions are passed through the flow cell using a syringe pump. These beads randomly adhere to the surface of the slip cover when it is passed into the flow cell, but the densities are always checked. λDNA are then flowed into the flow cell and it suspends the λDNA between the beads to form tightrope. YOYO-1 dye is added to stain the tightrope that is formed during the process, for easy visualization.
2.10. How the Imaging Was Done
After the tightrope has been formed in the flow cell and YOYO-1 dye was used to stain the λDNA, atomic force microscopy was used to snap the images in a dark room and computer software (Image J) was used to view all the snapped images.
3. Results and Discussion
3.1. Result for the Beads Size of 5 µM, Concentration of 500.0 µg/ml of λDNA, Velocity of 100, 200, 300, 400, 500 and 600 for the Flow Rate (µl/mins)
Table 1. Showing numbers tightropes snaped in flow cell at different velocities of (100 to 600). The numbers of multiple strands formed reduces as the velocity increased and increases as the velocity reduces.
Tightropes/Velocities 100 Vel
200 Vel
300 Vel
400 Vel
500 Vel
600 Vel
First image 6 6 5 4 3 3
Second image 6 6 4 4 3 2
Third image 5 5 4 3 2 2
Figure 2. Images of some multiples strand tightropes formed, chosen at random at different velocities. The numbers of multiple strands formed reduced as the velocities were increased and increased at lower velocities.
surface of the flow cell was also observed and it took 1hour for the syringe pump dispense reading to reach 3.000 µl/mins, which means the time increased by 40 minutes compared to the normal protocol. At the velocity of 200 µl/mins there were still multiple strands which were almost the same with 100 µl/mins it took 40 minutes for the syringe pump to dispense reading to reach 3.000 µl/mins, which means the time increased by 20 minutes compared to the normal protocol and DNA on the surface of the flow cell was also observed at this velocity. At 300 µl/mins there was no DNA on the surface and the number of multiple DNA tightrope reduced compared to 100 µl/mins and 200 µl/mins it took 20 minutes for the syringe pump to dispense reading to reach 3.000 µl/mins, which is the normal time for the normal protocol. At 400 µl/mins, there was still multiple strands of tightrope formed and there was no DNA on the surface, where it took 15 minutes for the syringe pump to dispense reading of 3.000 µl/mins, which means the time reduced by 5 minutes compared to the normal protocol. At 500 µl/mins the number of multiple strands formed was also reduced compared at lower velocity and there were no DNA on the surface. At 600 also there was no DNA on the surface and the number of multiple strands reduces compared to the ones at lower velocity. It was generally observed here that DNA on the surface was seen at 100 µl/mins and 200 µl/mins velocity and there was no DNA on the surface of the flow cell at the velocity of 300 µl/mins - 600 µl/mins.
3.2. Result for Beads Size of 5 µM, Concentration of 250.0 µg/ml µl of λDNA, Velocity of 100, 200, 300, 400, 500 and 600 for the Flow Rate (µl/mins)
Table 2. Showing numbers of multiple strands tightrope formed after imagining the flow cells at various velocities. Higher numbers of multiples strands were seen at lower velocities and less number of multiple strands was seen at lower.
Tightropes/velocities 100 Vel
200 Vel
300 Vel
400 Vel
500 Vel
600 Vel
First image 5 5 5 4 3 3
Second image 4 4 3 3 3 2
Third image 3 3 3 3 2 2
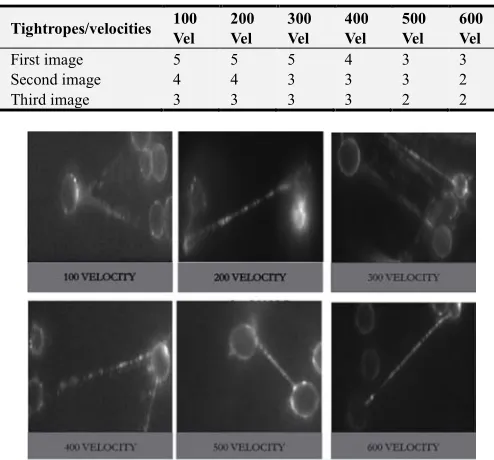
Figure 3. Showing number of the multiple strands formed, where increased in the velocity reduced the number of multiple strands and lower velocity gave higher number of multiples strands.
The result obtained here is similar to the previous condition but less quantity of multiples strands were formed on beads. More quantity of multiple tightropes strands was formed at 100 µl/mins and 200 µl/mins flow rate than at 300, 400 500 and 600 velocities. DNA on the surface of the flow cell also observed was observed at 100 and 200 velocities. It took 1hour for the syringe pump to dispensed reading to reach 3.000 µl/mins at 100 velocity, which means the time increased by 40 minutes compared to the normal protocol. At velocity of 200 µl/mins and it took 40 minutes for the syringe pump to dispensed reading to reach 3.000 µl/mins, which means the time increased by 20 minutes compared to the normal protocol. At 300 µl/mins there was no DNA on the surface and the number of multiple DNA tightrope reduced compared to 100 µl/mins and 200 µl/mins it took 20 minutes for the syringe pump to dispense reading to reach 3.000 µl/mins. At 400 µl/mins, there was still multiple strands of tightrope formed and there was no DNA on the surface but slightly less the one at 3000, it took 15 minutes for the syringe pump to dispensed reading of 3.000 µl/mins, which means the time reduced by 5 minutes compared to the normal protocol. At 500 µl/mins the number of multiple strands formed was also reduced compared at lower velocity and there were no DNA on the surface. At 600 also there was no DNA on the surface and the number of multiple strands reduces compared to the ones at lower velocity. It was generally observed here that DNA on the surface was seen at 100 µl/mins and 200 µl/mins velocity and there was no DNA on the surface of the flow cell at the velocity of 300 µl/mins - 600 µl/mins.
3.3. Result for Beads Size of 3 µM, Concentration of 500.0 µg/ml µl of λDNA, Velocity of 100, 200, 300, 400, 500 and 600 for the Flow Rate (µl/Mins)
Table 3. Showing numbers of multiple strands tightrope formed after imagining, where the numbers of multiple strands reduces with increase in velocity and increased with lower velocity.
Tightropes/velocities 100 Vel
200 Vel
300 Vel
400 Vel
500 Vel
600 Vel
First image 4 4 4 4 3 3
Second image 3 3 3 4 2 2
Third image 3 3 3 3 2 2
The result obtained here is similar to the previous two conditions, but the reduction in beads size also reduces the numbers of multiple strands that are form two same beads and more quantity of DNA at the velocity of 100 µl/mins and 200 µl/mins even though there was still multiples strands but there was. At the velocity of 100 µl/mins we had more multiple strands tightrope than at 200 µl/mins. At the velocity of 100 µl/mins it took 1hour for the syringe pump to dispense reading to reach 3.000 µl/mins. At the velocity of 200 µl/mins there. At 300 µl/mins there was no DNA on the surface and the number of multiple DNA tightropes increased compared to 100 µl/mins and 200 µl/mins. At 400 µl/mins, there was still multiple strands of tightrope formed and there was no DNA on the surface. At 500 µl/mins the number of multiple strands formed was also reduced compared at lower velocity and there were no DNA on the surface and there was no DNA on the surface. At 600 also there was no DNA on the surface and the number of multiple strands reduces compared to the ones at lower velocity. It was generally observed here that DNA on the surface was seen at 100 µl/mins and 200 µl/mins velocity and there was no DNA on the surface of the flow cell at the velocity of 300 µl/mins - 600 µl/mins. Higher numbers of multiples strands was seen at 300 µl/mins and 400 µl/mins.
3.4. Result for the Beads size of 3 µM, Concentration of 375.0 µg/ml µL of λDNA, Velocity of 100, 200, 300, 400, 500 and 600 for the Flow Rate (µL/Mins)
Table 4. Showing numbers of single and multiple tightropes formed at different velocities, where the numbers of multiple strands reduces with increase in velocity.
Tightropes/velocities 100 Vel
200 Vel
300 Vel
400 Vel
500 Vel
600 Vel
First image 1 1 3 2 1 1
Second image 1 1 2 2 1 1
Third image 0 1 2 2 1 0
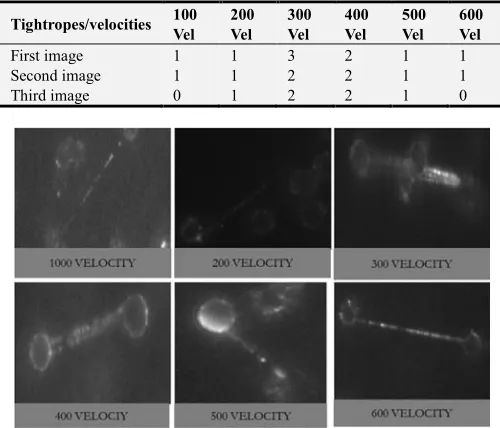
Figure 5. Showing numbers multiple strands, there were no multiple strands at the velocity of 100, 200 and 600.
The result obtained here is different from all the previous conditions where there was no multiple strands on 100 µl/mins, 200 µl/mins, 500 µl/mins and 600 µl/mins velocity. DNA on the surface surface of the floe cell was still observed at 100 µl/mins and 200 µl/mins velocity but 100 µl/mins velocity had more DNA on the surface. Multiples strands was observed at 300 µl/mins and
400 µl/mins but 300 µl/mins had more multiple strands.
3.5. Result for the Beads Size of 3 µM, Concentration of 250.0 µg/ml µl of λDNA, Velocity of 100, 200, 300, 400, 500 and 600 for the Flow Rate (µl/Mins)
Table 5. Showing numbers of single and multiple tightropes formed at different velocities, where the numbers of multiple strands reduces with increase in velocity.
Tightropes/velocities 100 Vel
200 Vel
300 Vel
400 Vel
500 Vel
600 Vel
First image 1 1 2 2 1 1
Second image 0 1 2 1 1 0
Third image 0 0 1 1 1 0
Figure 6. Some of the multiples strand tightropes from different velocities picked at random. Where multiple strands as seen at 300 and 400 velocity.
The result obtained is similar to the previous condition but few tightrope where formed her in general compared to the previous one. DNA on the surface was observed at 100 µl/mins and 200 µl/mins velocity of flow rate, but 100 µl/mins had more DNA on the surface. 100 velocity did not have many tightrope only one, most of the DNA was seen at the surface of the flow cell. 200 µl/mins velocity had more tightropes than 100 µl/mins and it still had DNA on the surface of the tightrope. At 300 µl/mins and 400 µl/mins there where more DNA tightrope and some multiples tightrope but the still less compared to the previous conditions. At 500 µl/mins and 600 µl/mins, there was also no DNA on the surface and no multiples strands of tightrope. Generally the numbers or amount of tight ropes formed at this condition was less generally compared to all the conditions.
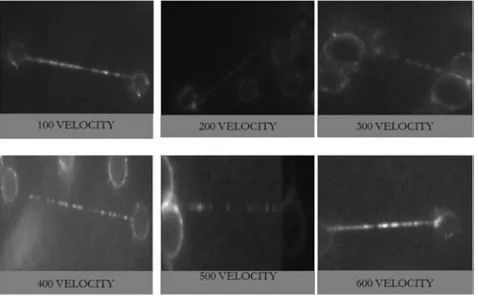
3.6. Result for the Beads Size of 3µM, Concentration of 375.0 µg/ml of λDNA, Velocity of 100 µl/Mins, 200 µl/Mins, 300 µl/Mins, 400 µl/Mins, 500 µl/Mins and 600 µl/Mins for the Flow Rate Where all the Velocities Were Performed for 15 Minutes
Table 6. Showing numbers of multiple strands and single strand image tightrope formed after imagining, where the numbers of multiple strands reduces with increase in velocity.
Tightropes/velocities 100 Vel
200 Vel
300 Vel
400 Vel
500 Vel
600 Vel
First image 1 1 1 1 1 1
Second image 1 1 1 1 1 1
Figure 7. Showing the numbers of single stranded picked at random. Where all the velocities has single strands of the λDNA.
4. Conclusion
To overcome the problems of multiple tightropes, different conditions such as bead size (5 µM and 3 µM), concentration of λDNA (500.0 µg/ml, 375.0 µg/ml and 250.0 µg/ml), velocities of the syringe pump flow rate (100, 200, 300, 400, 500 and 600) and time were used for the optimization. This study tried to get the lowest velocity that had the highest numbers of single stranded tightrope amongst all the conditions (bead size, concentration of λDNA, velocity of flow rate and time) because at high velocity it can create tensions in the λDNA. The normal protocol for making these λDNA tightropes used beads size of 5 µM, velocity of 300 µl/mins for the flow rate, concentration of 500.0 µg/ml and dispenses reading of not less than 3.0 µl/mins, but in this work most of the conditions were optimized to get single stranded tightrope. Making the flow cell was sometimes challenging because once an air get inside the flow cell a new flow cell has to be made because air usually move the beads to one side of the flow cell.
The beads size of 3 µM, concentration of 375.0 µg/ml µl and velocity of 300 µl/mins for 15 minutes gave the highest number of single stranded λDNA tightropes compare to all the conditions used, with no multiple strands of λDNA. This became the best result because it has high quantity of λDNA tightrope, that does not have multiple strands and at a lower velocity which can’t create tension in the beads. The velocity is the same with the normal protocol but the bead size was changed from 5µM to 3 µM and the concentration from 500.0 µg/ml to 375.0 µg/ml. Changing the beads size from 5 µM reduces the surface area of the beads which prevented it from forming multiple strands on the beads. Reducing the concentration of the λDNA from 500.0 µg/ml to 375.0 µg/ml reduce the amount of DNA to be use, thereby reducing the amount of multiple strands λDNA tightropes that was formed on the beads. The time was reduced from 20 minutes to 15 minutes because longer time was responsible for multiple λDNA tightropes to form on the beads. The amount of YOYO-1 dye used was increased from 15 µl to 20 µl to give clearer images of the λDNA tightrope.
The work reported by [3] that DNA tightrope is powerful for image location which is in agreement with the research
reported here. DNA tightropes makes manipulations of DNA easier to be view while carry molecular studies such as DNA repairs, cancer studies, studying some specific sites and DNA-protein interaction. DNA tightropes provide an environment which allows DNA to be viewed holistically by powerful visualization tools.
References
[1] Kad N. M., Wang H., Kennedy G. G., Warshaw D. M., and Van Houten B., (2010). Collaborative dynamic DNA scanning by nucleotide excision repair proteins investigated by single-molecule imaging of quantum-dot-labeled proteins. Molecular Cell, 37: 702–713.
[2] Gorman J., and Greene E. C. (2008). Vsisualizing one-dimensional diffusion of proteins along DNA. Nat. Struct. Mol. Biol. 15, 768–774.
[3] Cornish P. V., and Ha T., (2007). A survey of single-molecule techniques in chemical biology. ACS Chemical Biology, 2: 53–61.
[4] Wang J., Barnett J. T., Pollard M. R., Kad N. M. (2016). Integrating Optical Tweezers, DNA Tightropes, and Single-Molecule Fluorescence Imaging: Pitfalls and Traps. Methods in Enzymology. 1-22.
[5] Pan H., Bilinovich M. S., Kaur P., Riehn R., Wang H. and Williams C. D., (2017). CpG and methylation-dependent DNA binding and dynamics of the methylcytosine binding domain 2 protein at the single-molecule level. Nucleic Acids Research. 1-14.
[6] Wu D., Kaur P., Li M. Z., Bradford C. K., Wang H., and Erie A. D. (2016) Visualizing the Path of DNA through Proteins Using DREEM Imaging. Molecular Cell 61, 315–323.
[7] Hughes D. C., Wang H, Ghodke H., Simons M., Towheed A., Peng Y., Houten V. and Kad M. N. (2013) Real-time single-molecule imaging reveals a direct interaction between UvrC and UvrB on DNA tightropes. Nucleic Acids Research; 1–12.
[8] Bustamante C., Bryant Z., and Smith S. B., (2003). Ten years of tension: Single-molecule DNA mechanics. Nature, 421: 423-427.
[9] Ngwu NW, Effa EB, Ftepti BJ, Gali AI, Useh MU, Samuel CJ. (2016). Biochemical Studies of Ocimum sanctum and Olax subscorpioidea leaf extracts. British Journal of Pharmaceutical Research. 12 (4): 1-9.
[10] Walter N. G., Huang C. Y., Manzo A. J., and Sobhy M. A., (2008). Do-it-yourself guide: How to use the modern single-molecule toolkit. Nature Methods, 5: 475-489.
[11] Joo C., Balci H., Ishitsuka Y., Buranachai C., and Ha T., (2008). Advances in single-molecule fluorescence methods for molecular biology. Annual Review of Biochemistry, 77: 51-76.
[13] Ashkin A., Dziedzic J. M., and Yamane T., (1987). Optical trapping and manipulation of single cells using infrared-laser beams. Nature, 330: 769-771.
[14] Springall L., Hughes D. C., Simons M., Azinas S., Houten V. B. and Kad M. N. (2017). Recruitment of UvrBC complexes to UV-induced damage in the absence of UvrA increases cell survival. Nucleic Acids Research: 1-10.
[15] Von Hippel P. H., and Berg O. G., (1989) Facilitated target location in biological systems. Journal of Biological Chemistry, 264: 675–678.
[16] Shimamoto N., (1999). One-dimensional diffusion of proteins along DNA. Its biological and chemical significance revealed by single molecule measurements. Journal of Biological Chemistry, 274: 15293–15296.
[17] Halford S. E., and Marko J. F., (2004). How do site-specific binding proteins find their targets? Nucleic Acids Research, 32: 3040–3052.
[18] Spies M., Bianco P. R., Dillingham M. S., Handa N., Baskin R. J., and Kowalczykowski S. C., (2003). A molecular throttle: The recombination hotspot, χ, controls DNA translocation by the RecBCD helicase. Cell, 114: 647-654.
[19] Kim J. H., and Larson R. G., (2007). Single-molecule analysis of 1D diffusion and transcription elongation of T7 RNA polymerase along individual stretched DNA molecules. Nucleic Acids Research, 11: 3848-3858.
[20] Kabata H., Kurosawa O., Arai I., Washizu M., Margarson S. A., Glass R. E. and Shimamoto, N. (1993). Visualization of single molecules of RNA polymerase sliding along DNA. Science, 262: 1561-1563.
[21] Greene E. C., and Mizuuchi K., (2002). Direct observation of single MuB polymers: evidence for a DNA-dependent conformational change for generating an active target complex. Molecular Cell, 9: 1079-1089.
[22] Van Oijen A. M., Blainey P. C., Crampton D. J., Richardson C. C., Ellenberger T., and Xie X. S., (2003). Single-molecule kinetics of lambda exonuclease reveal base dependence and dynamic disorder. Science, 301: 1235-1238.