Scopus or Web of Science for a bibliometric profile of
pharmacy research at a Nigerian university?
Nelius Boshoff
1and Moses A. Akanmu
2[email protected] ORCID: orcid.org/0000-0001-9285-377X
[email protected] ORCID: orcid.org/0000-0003-2152-5482
Received: 10 September 2017 Accepted: 27 December 2017
Previous comparisons between Scopus and Web of Science (WoS) paid little attention to universities in African countries. This study investigated the effect of using different data sources on the bibliometric profile of Obafemi Awolowo University in Nigeria, focusing on the Faculty of Pharmacy for the period 1990-2013. In addition to data from Scopus and WoS, the analysis included articles from the curriculum vitae (CVs) of the faculty staff. The combined dataset (Scopus, WoS and CV data) provided answers to the central question: What differences can be observed in the bibliometric profile of research when comparing the Scopus and WoS output to the total article output? Although Scopus and WoS differed in size, the results of each showed a similar pattern. Notable differences were found with regard to indicators of research collaboration. WoS in particular appeared to be biased towards international collaboration. Additional sources of articles (beyond WoS and Scopus) are required to assess adequately research performance at faculty level for a university in a developing country. The quality aspect of those additional sources cannot be ignored.
Keywords: Africa, collaboration, pharmacy, research, Scopus, Web of Science
1 Introduction
Bibliometric assessments of university research are increasingly valued by research managers in higher education as a form of strategic input to decision-making. At the same time, it is being realised that “there are systemic issues associated with the use of bibliometrics” and that these issues “must be carefully identified and considered before making judgements based on these measures” (University of Waterloo Working Group on Bibliometrics 2016: 4). One such systemic issue is the data source used for bibliometric analysis.
Before 2004, bibliometric profiles of university research were almost exclusively based on an analysis of articles in the three citation indexes of the (then) Institute for Scientific Information (ISI) in the United States of America (USA). For decades, these citation indexes, now part of the Core Collection of the Web of Science (WoS) database of Clarivate Analytics, enjoyed a monopoly in the production of bibliometric indicators. Historically, the ISI indexes constituted the only bibliographic source with a number of key features that allowed for the production of citation counts and other bibliometric indicators. Some of the features included multidisciplinarity, the capture of the names and addresses of all the authors of an article, and the establishment of links between the cited references of an article and all other articles in the indexed journals (Moed 1996). However, in 2004, Elsevier in Europe launched its own citation database, Scopus, which has since grown into a competitor to WoS because Scopus incorporates all of the other’s ‘unique’ features. Systematic comparisons between WoS and Scopus therefore emerged as a new topic for bibliometric investigation (Bar-Ilan 2008). Despite the growing number of comparative studies on this topic – for example those by Mongeon and Paul-Hus (2016), Sánchez, Del Río Rama and García (2017) and Vieira and Gomes (2009) – systematic comparisons of the article coverage of Scopus and WoS for countries and institutions in sub-Saharan Africa remain critically absent. One exception is a comparative study of Moi University (Kenya) and the University of Zululand (South Africa), which established that the publications of approximately 70% of academics at the two institutions were in neither Scopus nor WoS (Ocholla, Mostert & Rotich 2016). This study addressed that vacuum by investigating the effect of different data sources on the resultant bibliometric profile for a university in sub-Saharan Africa. The focus was on Obafemi Awolowo University (OAU) in Ile-Ife, Nigeria, and specifically on the article output in the Faculty of Pharmacy (FoP) at that university for the period 1990-2013. In addition to a comparison between Scopus and WoS, the analysis utilised article data sourced from the curriculum vitae (CVs) of the
1. Nelius Boshoff is Senior Lecturer at the Centre for Research on Evaluation, Science and Technology (CREST) at Stellenbosch University, South Africa. CREST is the host of the DST-NRF Centre of Excellence in Scientometrics and Science, Technology and Innovation Policy (SciSTIP) 2. Moses Atanda Akanmu conducted this bibliometric research as part of the requirements for an MPhil in Science and Technology Studies at
academic staff members in that faculty. The main research question was the following: What are the differences in the bibliometric profile of research at the FoP when comparing the Scopus and WoS article output to the total article output of that faculty (where ‘total’ refers to the CV, Scopus and WoS data combined)? Before presenting the study methodology and results, a discussion of relevant literature is provided, together with a brief note on the Faculty of Pharmacy at OAU.
2 Scopus versus WoS: insights from the relevant literature
According to Torres-Salinas, Lopez-Cózar and Jiménez-Contreras (2009), the two databases have different historical roots and thus reflect diverging philosophies – an important consideration. WoS began as a practical implication of the Bradford law (Garfield 1971), which postulates that as much as 90% of the significant literature in a field appears in a relatively small number of journals. Scopus, on the other hand, developed within the context of Elsevier’s role as a marketer of a large collection of journals, and for that reason includes more journal titles than WoS does.
A journal title overlap study by Gavel and Iselid (2008) showed that Scopus covers 84% of all the WoS journal titles whereas WoS includes only 54% of the Scopus journal titles. Norris and Oppenheim (2007) took the journal article submissions made to the social sciences categories in the 2001 Research Assessment Exercise of the United Kingdom (UK) as their point of departure in order to establish how those journal titles were covered by Scopus and WoS. They found that 51% and 43% of the journal titles were covered by Scopus and WoS respectively. Field-specific comparisons of the journal title overlap also illustrate the relative advantage of Scopus compared to WoS. For instance, in the oncology subject category, all WoS journals were found to be indexed by Scopus; on the other hand, 46% of the Scopus journal titles did not appear in WoS (López-Illescas, De Moya-Anegón & Moed 2008). The same authors concluded, that in oncology, the WoS journal collection can be considered a subset of the Scopus collection, where this subset “tends to cover the best journals from it in terms of citation impact per paper” (López-Illescas, De Moya-Anegón & Moed 2008: 304). In another field-specific study, Sánchez, Del Río Rama and García (2017) performed a quantitative analysis of the presence of the concept of wine tourism in selected databases. They established that Scopus covers the area of wine tourism better than WoS does, since it includes a larger number of relevant journals and articles. They further noted that Scopus “covers almost two thirds of the sources and articles of WoS, even when WoS has an important number of exclusive sources” (Sánchez, Del Río Rama and García 2017: 13).
In terms of actual articles (as opposed to journal titles), a study by Vieira and Gomes (2009) – for Portuguese universities in the period 2000-2007 – revealed no clear frontrunner. Scopus included only 1.04 times more articles than WoS did. Vieira and Gomes (2009: 587) also reported that “about two-thirds of the documents referenced in any of the two databases may be found in both databases”. On the other hand, a study by Bartol, Budimir and Dekleva-Smrekar (2014) illustrated the advantage of Scopus when it comes to article coverage. Their study conducted keyword searches in the two databases in order to extract articles on the topic of fibre crops. For each of twenty-one keywords used, Scopus retrieved the larger number of relevant articles. There is evidence that Scopus, in its journal coverage, largely practises the quantity/breadth principle whereas WoS is more orientated towards quality/depth (Ball & Tunger 2006). In the above-mentioned study of oncology journals (López-Illescas, De Moya-Anegón & Moed 2008), for instance, an analysis of the additional (non-WoS) journals in Scopus showed that many of these were low-impact journals. A comparative study in the field of pharmacology and pharmacy further revealed that, although Scopus has some additional journals not indexed by WoS, such journals were not associated with high impact factors (Gorraiz & Schloegl 2008). Vieira and Gomes (2009) also found that the greater volume or quantity of journal title coverage of Scopus, compared to WoS, often implies partial coverage (for instance, not all articles from a particular volume are included). It also needs to be noted that, in recent years, WoS has started to expand its coverage of journal titles. According to Michels and Schmoch (2012), the newly-added titles do not necessarily reflect new journals but rather existing ones.
Systematic comparisons of Scopus and WoS have focused on other dimensions, apart from differences in article and journal coverage. Examples are comparisons of citation counts and citation-based rankings (such as the h-index) based on Scopus and WoS data respectively (Adriaanse & Rensleigh 2013, De Groote & Raszewski 2012, Harzing & Alakangas 2016, Meho & Sugimoto 2009, Onyancha & Ocholla 2009). More recent foci include analyses of the database errors in Scopus and WoS (Franceschini, Maisano & Mastrogiacomo 2016a, 2016b, 2016c) and differences in the assignment of Scopus and WoS journals to field categories, in other words, journal classification systems (Wang & Waltman 2016), as well as illustrations of how differences in the assignment of keywords to articles could affect the analysis of research topics (Bartol & Mackiewicz-Talarczyk 2015).
scientometric literature. Examples are the study by Mêgnigbêto (2013) on the research output of Benin in West Africa (using Scopus) and the studies by Boshoff (2009, 2010) on the extent and nature of research collaboration in central Africa and the pattern of south-south research collaboration in southern Africa (using WoS).
Scopus is often seen as the preferred data source for bibliometric analyses of African research, as was the case for the continent-wide studies commissioned by the agencies of the African Union (African Observatory of Science, Technology and Innovation [AOSTI] 2014, African Union-New Partnership for Africa’s Development [AU-NEPAD] 2010). WoS has been reported as favouring journals from the western world in its title coverage, predominantly English language journals, thereby implying that WoS underrepresents non-western journals from small and developing countries (Archambault et al. 2006). It is not, however, a foregone conclusion that Scopus would always provide a more accurate representation of science in the developing world. In a study by De Moya-Anegón et al. (2007), Scopus was compared to the Ulrich Core directory, the ‘gold standard’ of reference, which constitutes the most comprehensive representation of peer-reviewed academic journals worldwide. Although De Moya-Anegón et al. (2007: 75) concluded, “the coverage provided by Scopus is balanced in terms of subject areas, languages and editors when compared with Ulrich’s Core”, the fact remains that Scopus includes, for instance, only about 12% of non-English journals compared to 32% in Ulrich’s Core. More recently, Mongeon and Paul-Hus (2016) used Ulrich’s extensive periodical directory to determine the nature of the biases that would be introduced in research evaluation exercises should only either Scopus or WoS be used. They found that the two databases share similar biases. These include, for instance, over-representation of the English language and certain author countries (USA, UK and other countries in Western Europe) as well as underrepresentation of certain fields (most notably the social sciences and humanities). Both databases, according to Mongeon and Paul-Hus (2016), should be used with caution in the context of comparative research evaluation (to which could also be added: in the context of developing countries). According to Rafols, Chavarro and Ciarli (2016), both Scopus and WoS significantly underrepresent research from the ‘global south’. Their study showed that Scopus covers only about 40% of all research conducted on the topic of rice in Nigeria and Egypt, and WoS only about 20%.
3 Aim of the study and research questions
It is against this background that the current study investigated the suitability of Scopus versus WoS for the bibliometric analysis of research at Obafemi Awolowo University (OAU) in Nigeria, by focusing on the Faculty of Pharmacy. According to Pouris and Ho (2014), research activity in pharmacology and pharmacy is over-emphasised in the African context. They found that Africa’s research effort in that field, given the scientific size of the continent, is about 1.5 times bigger than the world average. Four questions guided the current analysis:
Does the contribution of the Faculty of Pharmacy to OAU’s research output, relative to that of the other OAU faculties, differ according to the data source that is used (Scopus, WoS or both combined)?
Why are some of the faculty’s articles only partially covered by Scopus and WoS?
Do some departments in the faculty display more prominence when different data sources are used (CVs, Scopus, WoS or all three combined)?
Do the collaboration indicators for the faculty differ according to the data source used (CVs, Scopus, WoS or all three combined)?
Some comment is warranted for the emphasis on indicators of research collaboration in this analysis. The African continent suffers from what Pouris and Ho (2014: 2183) call “collaboration dominance”. For some African countries, more than 80% of total article output in WoS is produced in collaboration with international partners (Boshoff 2009, Owusu-Nimo & Boshoff 2017, Pouris & Ho 2014). One explanation for this phenomenon is that, in Africa, research collaboration “is not driven by local researchers searching for collaborators, but by the availability of resources and interests outside the continent” (Pouris & Ho 2014: 2181). Another possible explanation is that, since the WoS comprises a limited set of journals that satisfy stringent selection criteria (the quality/depth principle according to Ball & Tunger 2006), researchers from developing countries who publish in WoS journals mainly manage to do so because they collaborate internationally. The argument then is that, should a different data source be used, instances of international collaboration would become less pronounced and other forms of collaboration (for example, national) would be more visible.
4 The Faculty of Pharmacy at OAU
concurrently, a programme for the BPharm degree was started in September 1963. The university senate upgraded the department into a full faculty in October 1969 (OAU 2014). The present-day FoP comprises five academic departments and one research unit: Department of Clinical Pharmacy and Pharmacy Administration; Department of Pharmaceutical Chemistry; Department of Pharmaceutics; Department of Pharmacognosy; Department of Pharmacology; and Drug Research and Production Unit (DRPU). The DRPU is responsible for a local journal – African Journal of Traditional,
Complementary and Alternative Medicines – that is published three times a year. In 2012/2013, the faculty had 656
undergraduate students and seventy-six postgraduate students (OAU 2015). During the 2012/2013 academic session, the faculty had fifty-nine academic staff members involved in teaching and research (OAU 2014).
5 Data and method
The WoS data was taken from the database system at the Centre for Research on Evaluation, Science and Technology (CREST) at Stellenbosch University, South Africa. CREST has access to the raw data of journals in the WoS Core Collection database. In the case of Scopus, the online database was used. Relevant data were obtained by conducting searches in the address fields of both databases. The search criteria included the term ‘Nigeria’ and different variants of the spelling of OAU. The search period was from 1990 to 2013. Only two document types – articles and review articles – were retained (both are referred to as ‘articles’ in the context of this study).
After cleaning the data, a total of 4,195 and 2,744 articles remained for Scopus and WoS respectively. The two sets of articles were matched based on article and journal titles, and unified in a Microsoft Access database. The process generated a total of 4,705 OAU articles. In the consolidated database, Scopus uniquely accounted for 42% of the total OAU output and the WoS for 11%. The overlap was 47%. A subset of 370 articles was identified as belonging to the FoP at OAU. Of these, 350 appeared in Scopus with 123 appearing only in Scopus. Similarly, 247 articles appeared in WoS with twenty only in WoS. The overlap represented 227 articles. In addition to using Scopus and WoS data, staff from the FoP submitted their CVs which were used to capture the details of articles published in journals that are not indexed in Scopus or WoS. This exercise generated 406 articles, of which 218 eventually could not be found in either Scopus or WoS. The 218 articles were then added to the other 370 to produce a final dataset of 588 articles for the FoP.
Given that copies of the 218 ‘CV articles’ were not always available, the final FoP dataset had two shortcomings. Firstly, it could not be established whether all 218 articles were in fact ‘articles’ or ‘review articles’. Secondly, it could also not be established whether all articles obtained through the CVs of FoP staff members in fact listed the FoP affiliation in the author address field. A FoP staff member who completed a postgraduate qualification at a foreign university may have published the postgraduate research under the name of that university. Lastly, in order to obtain the addresses of the non-OAU co-authors in the CV articles, a three-fold strategy was followed. Relevant details were captured from copies of the CV articles, where such copies were available, or sourced from author searches in the Scopus and WoS databases (bearing in mind the year of publication). Where all else failed, a search of author names was conducted on Google.
6 Results
This section presents the results in terms of the four research questions that guided the bibliometric analysis.
6.1 Does the contribution of the FoP to the total OAU research output differ according to the data
source used?
The total number of research articles originating from OAU researchers, based on data obtained from Scopus and WoS for the period 1990-2013, was 4,195 and 2,744 respectively. An annual breakdown is shown in Figure 1. Compared to WoS, Scopus recorded a significantly larger number of articles for all years since 1996 onwards. Around 2002-2003, the number of Scopus articles started to increase at a much faster rate compared to the number of WoS articles. Generally, the annual trend for both Scopus and WoS seems to be the same: a decrease in article production between 1990 and 1995, followed by incremental growth, to reach a sudden peak around 2009. Thereafter, the OAU article production started to decrease again (until 2012), followed by a renewed increase in 2013.
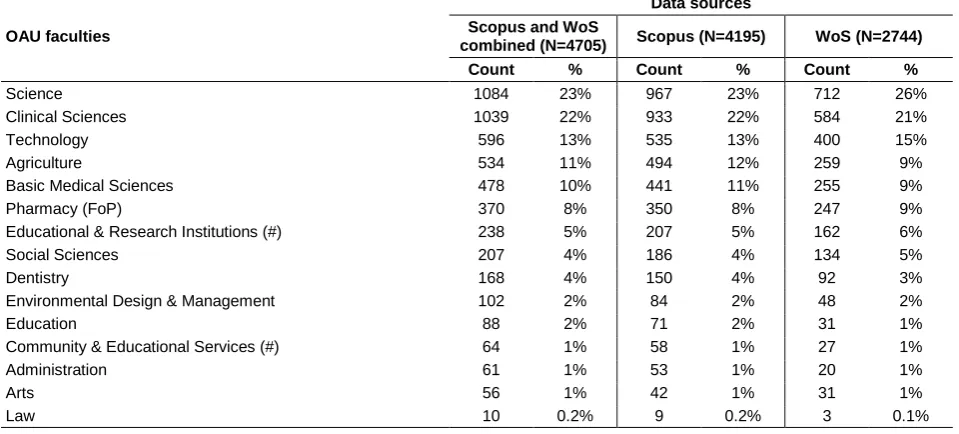
faculty, therefore, does not appear to be markedly influenced by the choice of data source. The structure of findings remains about the same across the different data sources regardless of the size (and implied coverage) of each data source.
Figure 1 OAU articles in Scopus and WoS, by year (1990 to 2013)
Table 1 Articles by OAU faculties and by data source (1990-2013)
OAU faculties
Data sources Scopus and WoS
combined (N=4705) Scopus (N=4195) WoS (N=2744)
Count % Count % Count %
Science 1084 23% 967 23% 712 26%
Clinical Sciences 1039 22% 933 22% 584 21%
Technology 596 13% 535 13% 400 15%
Agriculture 534 11% 494 12% 259 9%
Basic Medical Sciences 478 10% 441 11% 255 9%
Pharmacy (FoP) 370 8% 350 8% 247 9%
Educational & Research Institutions (#) 238 5% 207 5% 162 6%
Social Sciences 207 4% 186 4% 134 5%
Dentistry 168 4% 150 4% 92 3%
Environmental Design & Management 102 2% 84 2% 48 2%
Education 88 2% 71 2% 31 1%
Community & Educational Services (#) 64 1% 58 1% 27 1%
Administration 61 1% 53 1% 20 1%
Arts 56 1% 42 1% 31 1%
Law 10 0.2% 9 0.2% 3 0.1%
(#) These are not faculties but research centres and support units at the university and affiliated teaching hospitals.
6.2 Why are some FoP articles only partially covered by Scopus and WoS?
Figure 2 sets the scene for answering this question. It presents article data for the FoP only, and compares the annual output trends based on CV, Scopus and WoS data. As expected, Scopus produces more articles compared to WoS although, for some years, the differences were marginal. CV information was available mainly from 1999 onwards. Between 1999 and 2013, the CVs generated evidence of, on average, twenty-seven articles per year compared to seventeen and twelve articles per year for Scopus and WoS. Figure 3 shows the degree of overlap between the three data sources (CVs, Scopus and WoS). The CVs make a unique contribution of 37% to all articles in the FoP over the period 1990-2013. More than a third of the faculty’s article output would thus be overlooked if only Scopus and WoS were to be used. Furthermore, 58% of the faculty’s output would be overlooked should the faculty rely on WoS data only, while 41% of the faculty’s output would be missed if the faculty were to rely on Scopus data only. One reason why some articles only reflect in the CVs of FoP staff could be a tendency to publish in local journals that are not indexed in either Scopus or WoS. Other explanations could also apply. For instance, some authors could have decided not to report their OAU address in the Scopus or WoS article but rather the address of the institution where the research work was carried out.
Determination of the top journals in which FoP staff published was subsequently performed. ‘Top’ in this context refers to the most-preferred journals for publication, based on the total number of articles in a journal for the period 1990 to 2013. Eight journals produced at least ten FoP articles each over the relevant period, and three of these are local journals published in Nigeria (Table 2). The three are the Nigerian Journal of Natural Products and Medicine (responsible for
forty-0 50 100 150 200 250 300 350 400
1990 1991 1992 1993 1994 1995 1996 1997 1998 1999 2000 2001 2002 2003 2004 2005 2006 2007 2008 2009 2010 2011 2012 2013
two of the 588 FoP articles, or 7%), the African Journal of Traditional, Complementary and Alternative Medicines or AJTCAM (5%) and the Nigerian Journal of Pharmaceutical Research (2%).
Figure 2 FoP articles in the CVs, Scopus and WoS, by year (1990-2013)
Figure 3 Source of articles produced by the FoP (1990-2013, N=588)
Table 2 further shows that some journals are only partially covered in Scopus and WoS, which brings us to the relevant research question. Nine of the twenty-nine articles in AJTCAM appear only in the CVs. Three more of the AJTCAM articles appear in both Scopus and WoS (but not in the CVs), and six more in the CVs as well as in either Scopus (two) or WoS (four). An additional eleven articles appear in all three data sources. Table 3 provides reasons for the coverage in five of the affected journals in Table 2, including AJTCAM. Reasons for the partial coverage in Scopus and WoS relate to the period of journal coverage in the two databases, the absence of an OAU address in either Scopus or WoS, and differences in the classification of document type (for example, ‘note’ in one database and ‘article’ or ‘review’ in the other).
Table 2 Eight journals with at least 10 FoP articles each, by data source (1990–2013)
Journals Count
Data sources CVs
only
Scopus only
WoS only
Scopus & CVs
WoS & CVs
WoS & Scopus
All three
Nigerian Journal of Natural Products and Medicine 42 42 – – – – – –
African Journal of Traditional, Complementary and Alternative
Medicines 29 9 – – 4 2 3 11
Journal of Ethnopharmacology 20 – – 1 – – 8 11
Fitoterapia 19 – 12 – 1 – 4 2
Phytotherapy Research 17 – 2 1 – – 9 5
Nigerian Journal of Pharmaceutical Research 14 14 – – – – – –
Phytochemistry 14 – – 1 – – 10 3
African Journal of Biotechnology 13 – – – 1 – 2 10
0 5 10 15 20 25 30 35 40 45 50
1990 1991 1992 1993 1994 1995 1996 1997 1998 1999 2000 2001 2002 2003 2004 2005 2006 2007 2008 2009 2010 2011 2012 2013
CV Scopus WoS
37%
20%
18%
11% 10%
3%
1% 0%
10% 20% 30% 40% 50%
CVs only CVs & Scopus &
WoS
Scopus & WoS
Scopus & CVs
Table 3 Reasons why some FoP articles are only partially covered in Scopus and WoS
Five journals and their coverage in Scopus and WoS
Data sources
African Journal of Traditional, Complementary and Alternative Medicines
(N=29)
Scopus: since Vol 3(1), 2006
WoS: since Vol 3(3), 2006
Journal of Ethno-pharmacology (N=20)
Scopus: since Vol 1(1), 1979 WoS: since Vol 1(1), 1979
Fitoterapia
(N=19)
Scopus: since Vol 19(4), 1948 WoS: since Vol 69(1), 1998
Phytotherapy Research (N=17)
Scopus: since Vol 1(3), 1987
WoS: since Vol 3(1), 1989
Phytochemistry (N=14)
Scopus: since Vol 1(1), 1961
WoS: since Vol 9(1), 1970
CVs only
9 articles not in Scopus or WoS
All 9 were published before 2006.
-- -- -- --
Scopus
only – –
12 articles in Scopus but not in WoS
All 12 were published between 1990 and
1995.
2 articles in Scopus but not in WoS
One article, which appears in WoS, has no
OAU author address. The other article appears in WoS (with an
OAU author address) but is classified as a ‘note’ (not as an article
or review).
–
WoS only –
1 article in WoS but not in Scopus
The article appears in Scopus but has no OAU
author address.
–
1 article in WoS but not in Scopus
The article appears in Scopus but has no OAU
author address.
1 article in WoS but not in Scopus
The article appears in Scopus but has no OAU
author address.
Scopus & CVs
4 articles in Scopus but not in WoS
Three articles were published outside the WoS coverage period.
The other article (although within the WoS coverage period)
is not listed in WoS.
–
1 article in Scopus but not in WoS
The article (although published in the WoS coverage period) is not
listed in WoS.
– –
WoS & CVs
2 articles in WoS but not in Scopus
One article appears in Scopus but has no OAU
author address. The other article (although
within the Scopus coverage period) is not
listed in Scopus.
– – – –
6.3 Do some departments in the faculty display more prominence when different data sources are
used?
Table 4 FoP articles by department and by data source (1990–2013)
Departments
Data sources CVs, Scopus and WoS
combined (N=588)
Scopus and WoS
combined (N=370) Scopus (N=350) WoS (N=247)
Count % Count % Count % Count %
Pharmaceutics 155 26% 101 27% 97 28% 59 24%
Pharmacognosy 153 26% 94 25% 90 26% 60 24%
Pharmacology 143 24% 82 22% 76 22% 60 24%
Pharmaceutical Chemistry 123 21% 72 19% 67 19% 50 20%
Drug Research and
Production Unit 117 20% 74 20% 72 21% 51 21%
Clinical Pharmacy and
Pharmacy Administration 81 14% 37 10% 37 11% 17 7%
6.4 Do the collaboration indicators for the FoP differ according to the data source used?
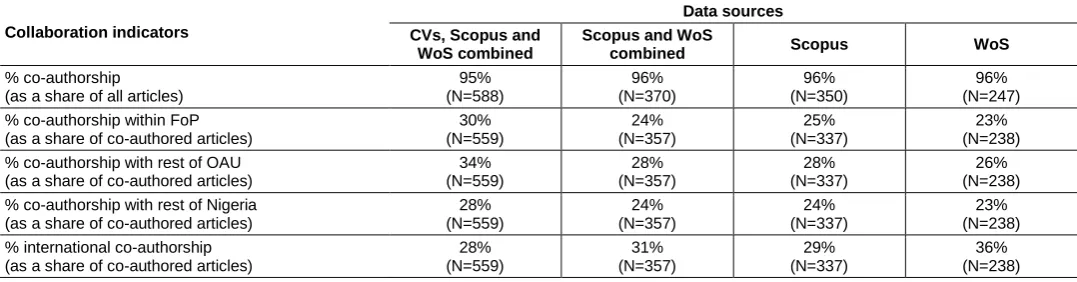
A comparison of the shares of co-authored articles by the FoP, across data sources, revealed no differences (95-96% over the total study period; Table 5). Thus, irrespective of the data source used, the share of single-authored articles remains consistently low at 4-5%. Table 5 displays four more indicators of collaboration. The first reflects collaboration between departments in the FoP (within-FoP co-authorship) and the second collaboration between the FoP and the other faculties at OAU (co-authorship with the rest of OAU). The third indicator represents national collaboration or co-authorship between the FoP and other organisations in Nigeria (co-authorship with the rest of Nigeria), and the fourth, international collaboration.
Table 5 FoP articles by collaboration indicator and by data source (1990-2013)
Collaboration indicators
Data sources CVs, Scopus and
WoS combined
Scopus and WoS
combined Scopus WoS
% co-authorship
(as a share of all articles)
95% (N=588)
96% (N=370)
96% (N=350)
96% (N=247) % co-authorship within FoP
(as a share of co-authored articles)
30% (N=559)
24% (N=357)
25% (N=337)
23% (N=238) % co-authorship with rest of OAU
(as a share of co-authored articles)
34% (N=559)
28% (N=357)
28% (N=337)
26% (N=238) % co-authorship with rest of Nigeria
(as a share of co-authored articles)
28% (N=559)
24% (N=357)
24% (N=337)
23% (N=238) % international co-authorship
(as a share of co-authored articles)
28% (N=559)
31% (N=357)
29% (N=337)
36% (N=238)
When the article data from the CVs are excluded, both the share of within-FoP collaboration and the share of collaboration with the rest of OAU appear to be underestimated. For instance, with CV data included, the share of within-FoP collaboration is 30%. However, without the CV data (using only Scopus and/or WoS), the share decreases to 23-25%. In terms of collaboration with the rest of Nigeria, the relevant share may be underestimated when only Scopus and/or WoS data are used (23-24%) since it increases to 28% when the CV data are included. On the other hand, the share of international collaboration is highest when only WoS data are used (36%). It decreases to 31% when Scopus data are added, and even further to 28% when CV data are incorporated. This means that reliance on WoS data alone would most likely result in an overestimation of the FoP’s share of international collaboration and an underestimation of the different forms of domestic collaboration. Given that the CV data were available mainly from 1999 onwards (see Figure 2), it was decided to restrict the indicators of Table 5 to the most recent period under study, namely 2010-2013. Table 6 shows the results. A salient observation is that the percentage of national collaboration is significantly underestimated when the data source only involves WoS. The share dramatically increases from 20% to 42% when both CV and Scopus data are used together with WoS data to construct the relevant indicator.
Table 6 FoP articles by collaboration indicator and by data source (2010–2013)
Collaboration indicators
Data sources CVs, Scopus and
WoS combined
Scopus and WoS
combined Scopus WoS
% co-authorship
(as a share of all articles)
97% (N=166)
97% (N=91)
97% (N=73)
98% (N=58) % co-authorship within FoP
(as a share of co-authored articles)
31% (N=146)
30% (N=73)
30% (N=71)
34% (N=41) % co-authorship with rest of OAU
(as a share of co-authored articles)
41% (N=146)
40% (N=73)
39% (N=71)
39% (N=41) % co-authorship with rest of Nigeria
(as a share of co-authored articles)
42% (N=146)
33% (N=73)
31% (N=71)
20% (N=41) % international co-authorship
(as a share of co-authored articles)
19% (N=146)
21% (N=73)
21% (N=71)
22% (N=41)
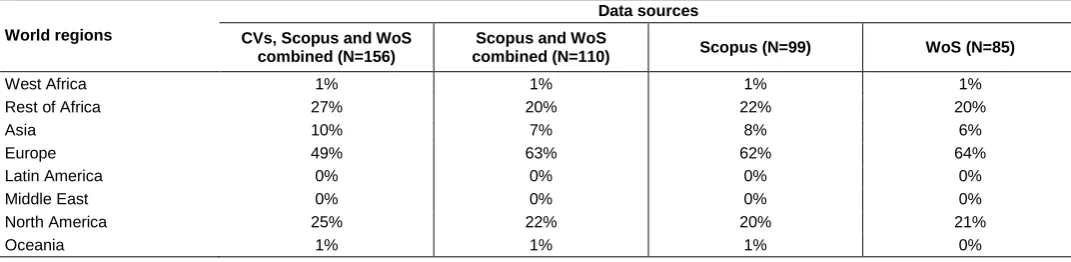
Table 7 Percentage of internationally co-authored FoP articles by world region and by data source (1990–2013)
World regions
Data sources CVs, Scopus and WoS
combined (N=156)
Scopus and WoS
combined (N=110) Scopus (N=99) WoS (N=85)
West Africa 1% 1% 1% 1%
Rest of Africa 27% 20% 22% 20%
Asia 10% 7% 8% 6%
Europe 49% 63% 62% 64%
Latin America 0% 0% 0% 0%
Middle East 0% 0% 0% 0%
North America 25% 22% 20% 21%
Oceania 1% 1% 1% 0%
7 Discussion and recommendation
Russell and Rousseau (n.d. 2) remark, “All evaluations are dependent on the availability of adequate and reliable data relating to the outcome of the activities under scrutiny”. This remark emphasises the need to select the most appropriate database for the bibliometric assessment of an institution’s research output. The chosen database should produce indicators that reflect the state of affairs of the entity that is being assessed accurately. This is important since bibliom etric indicators are used for a diversity of management and organisation activities at universities – among which may include decisions around the allocation of funding, university policies, strategy formulation, human resource management, quality management, reputation management, and partner selection (Kosten 2016). This study investigated the relative suitability of Scopus and WoS for a bibliometric analysis of articles produced by the FoP at OAU. It showed a large degree of convergence of indicators for Scopus and WoS, even though Scopus contained significantly more articles compared to WoS. Thus, although the two data sources were found to differ in size (in other words, in their collections of articles), the structure of the findings emanating from the data analyses was not that much affected by the size discrepancy. This phenomenon is normally expected at high levels of aggregation (for example, for an analysis at the level of a country or broad scientific field), where the large volumes of articles compensate for any database omissions. In the current study, the convergence of indicators based on Scopus and WoS, despite the size difference of the databases, was found to be true for a small dataset at a low level of aggregation, namely that of a university faculty.
Still, structural differences between Scopus and WoS did emerge for two indicators of research collaboration: the share of international co-authorship (1990-2013) and the share of national co-authorship (2010-2013). The WoS appears to be biased towards international collaboration, often at the expense of instances of national collaboration. Thus, relying on WoS data alone would misrepresent the true state of affairs at the FoP. In the current analysis, the true state of affairs was constructed as ‘the sum of all data’: the picture that emerged from combining the article data of Scopus and WoS with the article data of the CVs. This data integration was done to achieve total coverage (quantity) which, although a worthwhile exercise, raises questions concerning quality. For instance, the Nigerian journal AJTCAM – whose article details were extracted mainly from the CVs of FoP academic staff – appears in the (then) Beall’s list of “potential, possible, or probable predatory scholarly open-access journals” (Beall’s list of predatory journals and publishers 2017). Although additional data sources are considered invaluable in the bibliometric assessment of university research performance in developing countries, the quality dimension cannot be ignored. For the purpose of university performance assessment exercises, it is a matter of finding the right balance between ensuring the level of both the quantity and quality of data sources, and putting the necessary system in place to do so.
2011), such institutional repositories often leave much to be desired. Specifically, the meaning of what counts as a research publication for inclusion in a repository remains unchecked. As a result, the contents of some repositories include an assortment of outputs: non-peer-reviewed documents, conference presentations that never develop beyond the original abstract submitted, and peer-reviewed articles in local and international journals, to mention a few. It is therefore imperative that the document type in an institutional repository be defined correctly. This will ensure that peer-reviewed articles are clearly distinguishable from non-peer-reviewed output. For peer-reviewed articles, criteria of journal reputation would also need to be included. This could be as simple as indicating whether an article appears in a journal that is indexed by Scopus or WoS, or in one of the many journals recognised by the South African Department of Higher Education and Training. Additional sets of information to be included in an African institutional research repository are the addresses of all the authors of the peer-reviewed articles submitted by university staff, since this will enable record keeping of what can be described here as the ‘hidden articles of Africa’. The latter refers to articles that African researchers publish together with international authors (or on their own) but where a foreign institution rather than the African researcher’s own institution is specified in the address. The article is thus never picked up as an African contribution in any bibliometric analysis. However, the research reflected in such articles contributes to the local institutional research capacity through the skills that remain embodied in people, and for that reason needs to be acknowledged in an African-specific bibliometric analysis.
8 Conclusion
The study showed that the choice of data source (Scopus or WoS) did not really play a role when comparing the FoP’s share of research output to that of each of the other faculties at OAU (research question 1). Neither did the choice of data source have a notable effect on the research output shares of the different FoP departments (research question 3). These observations emerged despite differences in the respective volumes of output of the two data sources. For reasons explained elsewhere (research question 2), each data source only partially covered the full set of FoP article output, where the full set comprised Scopus, WoS and CV data. In particular, notable differences were observed for certain indicators of domestic and international collaboration when using as data source the full set of FoP article output compared to using only Scopus or WoS (research question 4). Neither Scopus nor WoS can therefore satisfactorily provide all the necessary information for a bibliometric analysis of pharmacy research at OAU. Additional sources of article information, specifically sources of known quality, are required to assess adequately research performance at faculty level for a university in a developing country.
Acknowledgement
This research was funded with support from the Development Research Uptake in Sub-Saharan Africa (DRUSSA) programme. The DRUSSA programme ran from 2011 to 2016 and was funded by the Department for International Development (DFID), which is a United Kingdom government department responsible for administering overseas aid.
References
Adriaanse, L.S. and Rensleigh, C. 2013. Web of Science, Scopus and Google Scholar: a content comprehensiveness comparison. The Electronic Library, 31(6): 727-744.
African Observatory of Science, Technology and Innovation (AOSTI). 2014. Assessment of scientific production in the African Union, 2005–2010. Malabo: African Observatory of Science, Technology and Innovation.
Archambault, E., Vignola-Gagne, É., Côté, G., Larivère, V. and Gingras, Y. 2006. Benchmarking scientific outputs in the social sciences and humanities: the limits of existing databases. Scientometrics, 68(3): 329-342.
African Union-New Partnership for Africa’s Development (AU-NEPAD). 2010. African Innovation Outlook 2010. Pretoria: African Union-New Partnership for Africa’s Development.
Boshoff, N. 2009. Neo-colonialism and research collaboration in Central Africa. Scientometrics, 81(2): 413-434. Boshoff, N. 2010. South-south research collaboration of countries in the Southern African Development Community
(SADC). Scientometrics, 84(2): 481-503.
Ball, R. and Tunger, D. 2006. Science indicators revisited: Science Citation Index versus Scopus. A citation comparison of both citation databases. Information Services and Use, 26(4): 293-301.
Bar-Ilan, J. 2008. Informetrics at the beginning of the 21st century: a review. Journal of Informetrics, 2(1): 1-52.
Bartol, T. and Mackiewicz-Talarczyk, M. 2015. Bibliometric analysis of publishing trends in fiber crops in Google Scholar, Scopus, and Web of Science. Journal of Natural Fibers, 12(6): 531-541.
Bartol, T., Budimir, G. and Dekleva-Smrekar, D. 2014. Assessment of research fields in Scopus and Web of Science in the view of national research evaluation in Slovenia. Scientometrics, 98(2): 1491-1504.
Beall’s list of predatory journals and publishers. 2017. [Online]. http://beallslist.weebly.com/standalone-journals.html (21 August 2017).
De Moya-Anegón, F., Chinchilla-Rodríguez, Z., Vargas-Quesada, B., Corera-Álvarez, E., Muñoz-Fernández, F. J., González-Molina, A. and Herrero-Solana, V. 2007. Coverage analysis of Scopus: a journal metric approach. Scientometrics, 73(1): 53-78.
Franceschini, F., Maisano, D. and Mastrogiacomo, L. 2016a. Do Scopus and WoS correct ‘old’ omitted citations? Scientometrics, 107(2): 321-335.
Franceschini, F., Maisano, D. and Mastrogiacomo, L. 2016b. Empirical analysis and classification of database errors in Scopus and Web of Science. Journal of Informetrics, 10(4): 933-953.
Franceschini, F., Maisano, D. and Mastrogiacomo, L. 2016c. The museum of errors/horrors in Scopus. Journal of Informetrics, 10(1): 174-182.
Garfield, E. 1971. The mystery of the transposed journal lists: wherein Bradford's law of scattering is generalized according to Garfield's law of concentration. Current Contents, 1: 222-223.
Gavel, Y. and Iselid, L. 2008. Web of Science and Scopus: a journal title overlap study. Online Information Review, 32(1): 8-21.
Gorraiz, J. and Schloegl, C. 2008. A bibliometric analysis of pharmacology and pharmacy journals: Scopus versus Web of Science. Journal of Information Science, 34(5): 715-725.
Harzing, A.-W. and Alakangas, S. 2016. Google Scholar, Scopus and the Web of Science: a longitudinal and cross-disciplinary comparison. Scientometrics, 106(2): 787-804.
Kosten, J. 2016. A classification of the use of research indicators. Scientometrics, 108(1): 457-464.
López-Illescas, C., De Moya-Anegón, F. and Moed, H.F. 2008. Coverage and citation impact of oncological journals in the Web of Science and Scopus. Journal of Informetrics, 2(4): 304-316.
Mêgnigbêto, E. 2013. Scientific publishing in Benin as seen from Scopus. Scientometrics, 94(3): 911-928. Meho, L.I. and Sugimoto, C.R. 2009. Assessing the scholarly impact of information studies: a tale of two citation
databases: Scopus and Web of Science. Journal of the American Society for Information Science and Technology, 60(12): 2499-2508.
Michels, C. and Schmoch, U. 2012. The growth of science and database coverage. Scientometrics, 93(3): 831-846. Moed, H.F. 1996. Differences in the construction of SCI based bibliometric indicators among various producers: a first
overview. Scientometrics, 35(2): 177-191.
Mongeon, P. and Paul-Hus, A. 2016. The journal coverage of Web of Science and Scopus: a comparative analysis. Scientometrics, 106(1): 213-228.
Norris, M. and Oppenheim, C. 2007. Comparing alternatives to the Web of Science for coverage of the social sciences’ literature. Journal of Informetrics, 1(2): 161-169.
Obafemi Awolowo University (OAU). 2014. Faculty of pharmacy handbook 2011-2013. Ile-Ife: Obafemi Awolowo University.
Obafemi Awolowo University (OAU). 2015. University annual report 2013/2014. Ile-Ife: Obafemi Awolowo University. Ocholla, D. 2011. An overview of issues, challenges and opportunities of scholarly publishing in information studies in
Africa. African Journal of Library, Archives and Information Science, 21(1): 1-16.
Ocholla, D., Mostert, J. and Rotich, D.C. 2016. Visibility of University of Zululand and Moi University researchers in Web of Science and Scopus from 2003 to 2013. African Journal of Library, Archives and Information Science, 26(1): 3-15. Onyancha, O.B. and Ocholla, D.N. 2009. Assessing researchers’ performance in developing countries: is Google Scholar
an alternative? Mousaion, 27(1): 43-64.
Owusu-Nimo, F. and Boshoff, N. 2017. Research collaboration in Ghana: patterns, motives and roles. Scientometrics, 110(3): 1099-1121.
Pouris, A. and Ho, Y.-S. 2014. Research emphasis and collaboration in Africa. Scientometrics, 98(3): 2169-2184. Rafols, I., Chavarro, D. and Ciarli, T. 2016. Under-representation of research in the global south. Biases in mainstream
journal indexing systems. Paper presented at the International Research Conference on Scientometrics, STI Policy and Science Communication. 31 October - 3 November. Stellenbosch. [Online]. http://www0.sun.ac.za/scistip/wp-content/uploads/2012/10/Rafols_I.pdf (11 August 2017).
Russell, J.M. and Rousseau, R. No date. Bibliometrics and institutional evaluation. [Online].
http://www.vub.ac.be/BIBLIO/itp/lecturers/ronald_rousseau/ronald_roussea_stim1_bibliometrics_russell.pdf (30 July 2017).
Sánchez A.D., Del Río Rama, M. and García, J.Á. 2017. Bibliometric analysis of publications on wine tourism in the databases Scopus and WoS. European Research on Management and Business Economics, 23(1): 8-15.
Torres-Salinas, D., Lopez-Cózar, E.D. and Jiménez-Contreras, E. 2009. Ranking of departments and researchers within a university using two different databases: Web of Science versus Scopus. Scientometrics, 80(3): 761-774.
University of Waterloo Working Group on Bibliometrics. 2016. White paper on bibliometrics: measuring research outputs through bibliometrics. Waterloo: University of Waterloo.
Vieira, E.S. and Gomes, J.A.N.F. 2009. A comparison of Scopus and Web of Science for a typical university. Scientometrics, 81(2): 587-600.