University of New Hampshire Scholars' Repository
Geography Scholarship
Geography
Fall 2012
The Role of Landscape Connectivity in Planning
and Implementing Conservation and Restoration
Priorities. Issues in Ecology
Doborah Rudnick
Integral Consulting Inc
Sadie J. Ryan
State University of New York Syracuse
Paul Beier
Northern Arizona University
Samual A. Cushman
Rocky Mountain Research Station
Fred Dieffenbach
National Park Service
See next page for additional authors
Follow this and additional works at:
https://scholars.unh.edu/geog_facpub
Part of the
Forest Biology Commons
,
Natural Resources and Conservation Commons
, and the
Physical and Environmental Geography Commons
This Report is brought to you for free and open access by the Geography at University of New Hampshire Scholars' Repository. It has been accepted for inclusion in Geography Scholarship by an authorized administrator of University of New Hampshire Scholars' Repository. For more information, please [email protected].
Recommended Citation
esa
Published by the Ecological Society of America
esa
The Role of Landscape Connectivity
in Planning and Implementing
Conservation and Restoration
Priorities
Deborah A. Rudnick, Sadie J. Ryan, Paul Beier, Samuel A. Cushman, Fred Dieffenbach,
Clinton W. Epps, Leah R. Gerber, Joel Hartter, Jeff S. Jenness, Julia Kintsch,
Adina M. Merenlender, Ryan M. Perkl, Damian V. Preziosi, and Stephen C. Trombulak
Fall 2012
Report Number 16
The Role of Landscape Connectivity
in Planning and Implementing
Conservation and Restoration
Priorities
Issues
in
Ecology
The Role of Landscape Connectivity in Planning and
Implementing Conservation and Restoration Priorities
S
UMMARY
L
andscape connectivity, the extent to which a landscape facilitates the movements of organisms and their genes, faces critical threats from both fragmentation and habitat loss. Many conservation efforts focus on protecting and enhancing connectivity to offset the impacts of habitat loss and fragmentation on biodiversity conservation, and to increase the resilience of reserve networks to potential threats associated with climate change. Loss of connectivity can reduce the size and quality of available habitat, impede and disrupt movement (including dispersal) to new habitats, and affect seasonal migration patterns. These changes can lead, in turn, to detrimental effects for populations and species, including decreased carrying capacity, population declines, loss of genetic variation, and ultimately species extinction.Measuring and mapping connectivity is facilitated by a growing number of quantitative approaches that can integrate large amounts of information about organisms’ life histories, habitat quality, and other features essential to evaluating connectivity for a given population or species. However, identifying effective approaches for maintaining and restoring connectivity poses several challenges, and our understanding of how connectivity should be designed to mitigate the impacts of climate change is, as yet, in its infancy.
Scientists and managers must confront and overcome several challenges inherent in evaluating and planning for con-nectivity, including:
•characterizing the biology of focal species;
•understanding the strengths and the limitations of the models used to evaluate connectivity;
•considering spatial and temporal extent in connectivity planning;
•using caution in extrapolating results outside of observed conditions;
•considering non-linear relationships that can complicate assumed or expected ecological responses;
•accounting and planning for anthropogenic change in the landscape;
•using well-defined goals and objectives to drive the selection of methods used for evaluating and planning for connectivity;
•and communicating to the general public in clear and meaningful language the importance of connectivity to improve awareness and strengthen policies for ensuring conservation.
Several aspects of connectivity science deserve additional attention in order to improve the effectiveness of design and imple-mentation. Research on species persistence, behavioral ecology, and community structure is needed to reduce the uncertainty associated with connectivity models. Evaluating and testing connectivity responses to climate change will be critical to achieving conservation goals in the face of the rapid changes that will confront many communities and ecosystems. All of these potential areas of advancement will fall short of conservation goals if we do not effectively incorporate human activities into connectivity planning. While this Issue identifies substantial uncertainties in mapping connectivity and evaluating resilience to climate change, it is also clear that integrating human and natural landscape conservation planning to enhance habitat connectivity is essential for biodiversity conservation.
Introduction
What Is Landscape Connectivity and How Does It Affect Conservation Objectives?
Connectivity is the extent to which move-ments of genes, propagules (pollen and seeds), individuals, and populations are facilitated by the structure and composition of the land-scape. A landscape’s connectivity is defined relative to the requirements of the organisms that live within it and move through it. Therefore, connectivity is species and context dependent. Consider the interconnection of ocean surface current patterns providing path-ways for dispersal of larvae between coral reefs; a network of riparian corridors used by wildlife to move through an agricultural landscape; the continuity of grasslands used by migrating wildebeest; intact lowland forest through which endemic forest birds move (see cover photos). Each of these examples demonstrates that connectivity is measured relative to the ease or difficulty with which a particular species is able to move across a particular land or seascape.
Connectivity has both structuraland func-tionalcomponents. Structural connectivity
describes the physical characteristics of a land-scape that allow for movement, including topography, hydrology, vegetative cover, and human land use patterns. Functional connectivity
describes how well genes, propagules, individu-als, or populations move through the landscape. Functional connectivity results from the ways that the ecological characteristics of the organ-ism, such as habitat preference and dispersal ability, interact with the structural characteris-tics of the landscape. The examples provided on the cover depict the ways that different species move through and depend on the land-scape and demonstrate both functional and structural connectivity, whereby ecological
requirements of individual species interact with the composition and configuration of the land-scape. These interactions influence the ability of individuals and populations to move among locations to find key resources, such as food, water, appropriate substrates for sessile organ-isms, or breeding partners.
The destruction and degradation of natural habitats on which all organisms rely – includ-ing humans – is occurrinclud-ing at an unprece-dented rate across most regions of our planet. As humans convert land for resource extrac-tion and for urban and agricultural uses, and as our impacts on global climate continue to grow, we profoundly change the physical, chemical, and biological character of these landscapes. Land use changes may reduce the amount of a habitat or fragment it, breaking it up into smaller or differently arranged units. This process changes not only the size of habi-tat patches but also other landscape features, such as patch geometry or the amount of edge habitat, that may be of fundamental impor-tance to species, communities, and ecological functions. Because human-caused disturbances often occur in shorter timeframes and over larger areas than do natural disturbances, eco-logical communities face challenges of how to adapt and respond to novel rates and scales of disturbances that are quite different from those with which they may have evolved.
Fragmentation, habitat degradation, and habitat loss are the dominant mechanisms by which connectivity is reduced or lost, and are widely recognized as major drivers of the pre-sent global biodiversity crisis. Fragmentation, the subdivision of habitat into smaller or more isolated remnants, can directly impact species persistence and accelerate local extinction rates. Habitat fragmentation is frequently asso-ciated with habitat loss. However, fragmenta-tion can also eliminate dispersal or gene flow without causing impacts on a population’s core
The Role of Landscape Connectivity in Planning and
Implementing Conservation and Restoration Priorities
Deborah A. Rudnick, Sadie J. Ryan, Paul Beier, Samuel A. Cushman, Fred Dieffenbach, Clinton W. Epps,
Leah R. Gerber, Joel Hartter, Jeff S. Jenness, Julia Kintsch, Adina M. Merenlender, Ryan M. Perkl,
habitat – for example, a highway bisecting a movement corridor.
For any given species, some parts of the landscape provide better opportunities than others to fulfill its ecological requirements, such as food, breeding habitat, or refuge from predation. Fragmentation and degradation can further increase the patchiness of the land-scape in terms of meeting a species’ needs. Conserving connectivity in this context requires identifying, maintaining, and possibly enhancing the linkages between suitable patches of habitat in the landscape. Corridors, which are generally linear spaces that facili-tate movement between patches, are fre-quently used as a tool for conserving or enhancing linkages. The creation or protec-tion of corridors can maintain connectivity for mobile species, such as ungulates or large felines that typically have large territories.
Corridors provide structural connectivity and are consistent with the functional con-nectivity needs of animals that can take advantage of linear spaces to move among dis-parate habitat patches. However, landscape connectivity is highly diverse and species-dependent, and other forms of connectivity
may be more relevant to other types of organ-isms; for example, a linked mosaic of small wetlands for breeding populations of amphib-ians, continuity of vegetated intertidal rocky substrate along a coastline for a marine snail, or a heterogeneous assemblage of meadow plant communities with different flowering times for a population of pollinators. The challenge of matching connectivity patterns to ecological requirements becomes even greater when we expand our thinking to con-sider maintaining or restoring connectivity for multiple species or entire communities.
Many populations and ecosystem functions are dependent on extensive, well-connected habitats; however, understanding the factors that contribute to landscape connectivity for specific populations, species, or communities is challenging. This Issuereviews the impor-tance of habitat connectivity, summarizes cur-rent science-based strategies for mitigating the negative ecological effects of fragmentation, explores data gaps and limitations of connec-tivity models, and describes obstacles and opportunities for developing policies and man-agement approaches that improve connectiv-ity and reach conservation goals.
Case Study 1. Managing for Marine Connectivity: Marine Protected Areas in the Gulf of California, Mexico
The growing movement toward ecosystem-based management, including networks of no-take zones in marine ecosystems (marine protected areas, or MPAs) requires that these conservation areas be deliberately and adequately spaced to allow for connectivity. The performance of a network of sites designed with the two-fold purpose of protecting commercial species and allowing for spillover effects (movement of organisms from protected areas into harvestable areas) will largely depend on whether sites in a network are functionally and structurally linked to each other by both biological (e.g., dispersal of organisms) and physical (e.g., currents) processes. Although the number and extent of MPAs has increased recently, studies have shown that, on a global scale, average dis-tance between neighboring MPAs exceeds the disdis-tance of reef organism propagule dispersal. This disdis-tance suggests that some taxa could become genetically isolated if populations cannot reach each other, undermining the viability of populations in the MPAs.
The conservation of species, habitats, and ecoregions depends on developing practical, efficient, and effective planning strategies. This is especially true in the marine realm, where threats are diffuse and difficult to both identify and quantify. Well-designed networks should include MPAs and other conservation and management areas that support each other by taking advantage of oceanic currents and movement/migration capabilities of species. They also provide much-needed resilience against a range of threats. Because estab-lishment of isolated marine reserves may not alone suffice for the conservation of biodiversity, identifying the level of connectivity between the areas is a critical aspect in network design.
How Fragmentation Affects
Movement: From Genes to
Species
Landscape fragmentation affects ecological communities at multiple levels of organiza-tion. Here, we briefly explore these effects, ranging from the movement of individuals and gene flow within and between populations to shifts in species range and species persistence.
Landscape connectivity is important for dis-persing or migrating individuals. Dispersal increases resilience to disturbances by allowing organisms to track their shifting habitats, and it promotes the spread and expansion of popu-lations. In some species – for example, wilde-beest in Africa, bison in North America, a wide variety of bird species – seasonal migra-tion has evolved as a means of maximizing access to critical resources as ecological condi-tions change throughout the year. Habitat frag-mentation can disrupt dispersal and migration in several ways. First, edges of the remnant habitat patches may act as filters or barriers that discourage or impede movement. Second, increased distances between suitable habitat patches may influence the likelihood of suc-cessful movement. Last, the composition and structure of the intervening landscape mosaic may influence the permeability of the land-scape to movements by different organisms. If fragmentation impedes seasonal migration, wildlife may be cut off from seasonal resources. If dispersal routes are blocked or altered, organ-isms may experience higher rates of mortality when trying to disperse, or they may be stopped completely, leading to unsustainably high densities of organisms in remnant patches, resulting in increases in mortality.
Habitat fragmentation may impede gene flow and lead to genetic isolation. Gene flow is critical to population viability, as it helps maintain local genetic variation and spreads potentially adaptive genes. Genetic isolation can be a mechanism for the creation of new populations and even species; however, small remnant populations inhabiting fragmented landscapes are more likely to suffer from inbreeding and low genetic variation, which can increase vulnerability to other stressors and lead to local extinctions. Retaining or restoring connectivity counteracts these nega-tive effects of genetic isolation.
Landscape connectivity is essential across large areas (connectivity across ecoregions or continents is critical for some species) and over long timeframes (connectivity over many
years or generations) to allow species’ range shifts in response to long-term ecological change. Projected climate change over the next few decades will change ecosystem struc-ture, species composition, and diversity. Changes in biophysical conditions will likely lead to species replacement in communities (community turnover) and latitudinal and ele-vational shifts in geographic ranges. During episodes of climate change since the
Pleistocene, vegetation zones or communities did not move as a whole in response to cli-mate shifts; rather, species responded individu-ally to climate change, according to their own individual and largely independent environ-mental tolerances, dispersal abilities, and responses to biotic interactions. Current cli-mate change appears to be occurring substan-tially faster than in the pre-historical record, meaning that the ecological conditions required by many species (their niches) may be shifting faster than species can adapt. These pressures, caused by changes in climatic conditions encountered by species in their current distributions, are compounded by habitat loss and fragmentation. The resulting obstacles to migration may impede species’ abilities to adapt to climate change, to such an extent that many species could be driven to extinction.
Effects of Connectivity on
Disease and Biotic Invasions
The extent to which landscapes are connected or fragmented may also affect the rate and pat-tern of disease spread and invasion by non-native species. Species introductions, which can radically alter ecosystems, include plant and ani-mal diseases as well as competitors and predators against which native communities may not have evolved defenses. It is important for managers to consider how changes in connectivity and frag-mentation may influence the spread of diseases and invasive species, and to recognize that these influences are not necessarily unidirectional, but rather depend on the characteristics of the par-ticular species and landscape in question.
molitrix), and bighead carp (H. nobilis)) in the Mississippi River watershed, and their potential spread into the Great Lakes, illustrate how human-constructed connections (canals) can both fragment the terrestrial environment and provide new corridors between aquatic systems. Similarly, while roads can fragment vegetated habitats, they can simultaneously serve as con-duits for some invasive species, such as cheat-grass (Bromus tectorum), yellow star thistle (Centaurea solstitialis), and other invasive species that benefit from the openings created by roads.
Connectivity for pathogens and parasites is largely a function of host distribution and abun-dance. While disease persistence benefits from increased host connectivity, it does not neces-sarily follow that these conditions are optimized only in well-connected landscapes. Landscape disturbance and fragmentation can increase host abundance and alter host distribution, and these changes can increase connectivity for
pathogens and parasites for which the hosts constitute the true “landscape” across which movement occurs (Box 1). However, fragmen-tation may also lead to the isolation of smaller host subpopulations, which then may become more susceptible to disease or invasions. In other situations, isolation resulting from land-scape fragmentation may protect a population from disease. For example, plague (Yersinia pestis) in Colorado prairie dog (Cynomys ludovicianus) populations was shown to be less prevalent in more remote, isolated populations than in those more closely grouped together.
Measuring, Analyzing and
Designing Landscape
Connectivity
Measuring structural connectivity has increas-ingly become a routine objective of researchers and policy makers, as Geographic Information Box 1. Habitat Fragmentation and Increased Disease Transmissivity
An important consequence of fragmentation in forested habitats is the loss of species diversity. Those species that thrive in fragmented habitats tend to be more generalist or opportunistic, or have traits such as smaller home range require-ments and tolerance for higher densities. Fragmentation can actually increase connectiv-ity from the perspective of a disease-causing pathogen. Higher densities of hosts increase opportunities for transmissivity, and the host population is the true “landscape” across which pathogen movement occurs. This is the case for the tick-transmitted bacterium (Borrelia burgdor-feri) that causes Lyme disease. Its host, the white-footed mouse (Peromyscus leucopus), has become increasingly common in small forest fragments (<2 ha) in New England, likely result-ing from its small home range requirements combined with release from competitors and predators in smaller forest patches. P. leucopus
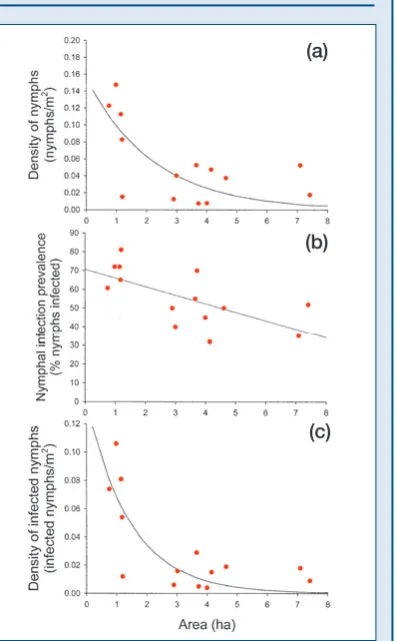
is the principal natural reservoir for Lyme dis-ease. Higher densities of ticks infested with B. burgdorferiare found in smaller forest fragments (Figure 1), which may result from higher densities of white-footed mouse in these smaller frag-ments, presenting more opportunities for ticks to feed on the mice. Consequently, humans living near these small forest fragments may have a higher risk of exposure to Lyme disease relative to those near larger forest fragments.
Figure 1. Relationship between measures of Lyme disease risk and forest patch area in a frag-mented landscape in New York state. a) Density of nymphal ticks is higher in smaller forest fragments. b) Percentage of nymphal ticks infected with the bacterium Borrelia burgdorferiis higher in smaller forest fragments. c) Density of nymphal ticks infected with the B. burgdorferiis higher in smaller forest fragments. (Source: Allan, B.F., F. Keesing, and R.S. Ostfeld. 2003. Effect of forest fragmentation on Lyme disease risk. Conservation Biology. 17: 267–272). Image used with permission of John Wiley and Sons.
(a)
(b)
System (GIS) and remote sensing tools become more widely available, affordable, and scalable. However, measuring functional con-nectivity using the movements of individual organisms can be logistically complicated. Even the largest studies using the most appro-priate technologies can track only relatively few individuals over modest time periods, and controlled experiments addressing movements and dispersal at relevant scales are extremely difficult to implement. One way to address this difficulty is to measure gene flow, which may more accurately and efficiently reflect functional connectivity across large landscapes. Genetic studies avoid the logistic and financial costs of tracking individual animals and inte-grate only those movements that produce meaningful population impacts – dispersals that result in breeding or emigration. A short-coming of this approach is that current genetic patterns may not reflect the impact of current landscape features, especially for species with large population sizes or long generation times, or species affected by unobserved events, such as genetic bottlenecks caused by past epidemics or human persecution. In addition, genetic connectivity may be masked in some instances by local adaptation, which can drive genetic distinctiveness even in a well-connected land-scape, by selecting for particular characteristics of the local environment.
A common product of connectivity analysis is a map of predicted core areas, linkage zones, or barriers. Such maps often become the basis for management actions. Several tools can be used to map these features, and each has unique strengths and weaknesses. All of the approaches described in the next section depend on accurately defining landscape resistance (an indication of how well a land-scape can be traversed by a given species), a challenging task when only a limited amount of information about species habitat prefer-ences is available. Furthermore, connectivity models can be difficult to validate.
Several research teams are working to develop methods to rigorously estimate species-specific resistance from data on gene flow, genetic distances, habitat use, and movement paths. Simple estimates of resis-tance, based on the extent to which land-scapes are impacted by roads, loss of natural land cover, increased edge effects, spread of invasive species, and other direct human impacts measures may be useful for some gen-eralist species, but are insufficient for address-ing species-specific movements and habitat
needs. Thus, recent developments in connec-tivity modeling combine a structural land-scape approach, identifying both the potential for and obstacles to long-term habitat shifts, with a functional approach that highlights the specific connectivity needs of species with restricted habitat requirements.
Modeling Approaches for
Identifying and Quantifying
Landscape Connectivity
We describe five widely-used analytical approaches, all implemented in a GIS envi-ronment, to assist planners in mapping and prioritizing landscape connections. Each approach has specific data requirements that often require input from biologists to help define model parameters. In addition, each approach is designed to meet different objec-tives and will, therefore, produce different out-comes.
Least-cost analysisidentifies the least costly route that an animal can take from one area to another. The method assumes that the animal incurs a cost as it moves over an area, where “cost” may reflect the actual energy expended to move over the area, mortality risk, or impact on future reproductive potential. In practice, cost is usually estimated simply as the inverse of habitat suitability. Habitats that the animal favors are assigned low cost while unsuitable habitats are assigned high cost.
The least-cost path is the contiguous collec-tion of cells that has the lowest cumulative cost as the path crosses from one endpoint (such as a park, natural area, or known popu-lation; sometimes referred to as a node or patch) to the other endpoint. Computers using GIS software can easily identify this path. Because the least-cost path is only one cell wide (for example, the center panel in Figure 2), it is often not a realistic area to pro-pose for conservation. Therefore, analysts usu-ally identify the least-cost corridor (shown in red in the panel on the right in Figure 2), which is a swath of cells expected to provide a low-cost route for movement.
resistance or permeability values) is the most problematic aspect of least-cost analysis and the other approaches described here.
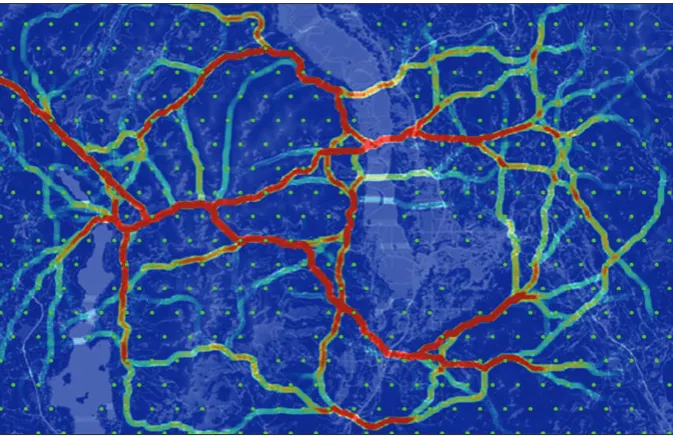
Factorial least-cost paths address one major limitation of traditional least-cost path and least-cost corridor analyses in that they are limited to predictions of connectivity between single sources and single destinations. While this may be ideal in the case where one is interested in the lowest cost routes between two focal conservation areas, many situations require a more comprehensive analysis of con-nectivity. For example, corridor connectivity may need to be calculated between thousands of sources and a single destination, or between hundreds of sources and hundreds of destina-tions distributed across a complex landscape. A factorial implementation of least-cost paths integrates a vast number of paths to show a network of connectivity across large and com-plex landscapes, such as a factorial least-cost path analysis among hundreds of points across a resistance surface (Figure 3). Densities of paths are shown in a gradient from yellow to red, with red paths representing routes that are predicted to contain the least-cost paths between many pairs of source and destination points. Additionally, while factorial
approaches are most common among least-cost approaches, they can also be integrated into graph and circuit analysis as well.
Circuit theory treats the landscape as if it were a large electrical circuit, in which all cells in the landscape can support movement. An important distinction between this and other methods is that while circuit approaches can be used to delineate corridors (with addi-tional processing), they are most useful in ana-lyzing and describing how well connected source and destination habitat patches may be, given multiple movement pathways. Well-connected habitat patches have wide, contin-uous habitat between them, while paths
between poorly-connected habitat patches might have constrictions and bottlenecks, each of which can be identified using a circuit based approach.
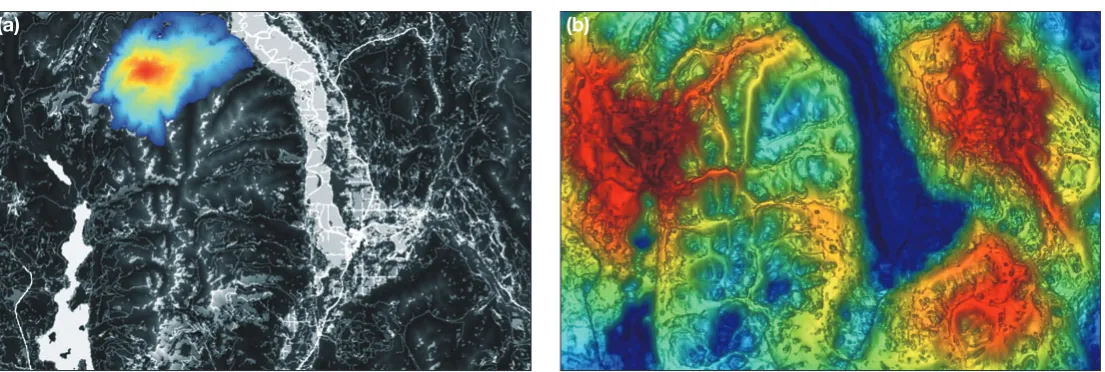
Current maps (Figure 4) can be a useful way to visualize a circuit-theoretic analysis. Current strength reflects the predicted proba-bility of movement between the two points or habitat patches. Current maps can be diffi-cult to interpret: higher current (usually depicted in yellow) may occur in a cell because resistance is low, because most paths are forced through that area because of high resistance elsewhere, or because the analysis is spatially constrained (Figure 4a). Lower current (usually depicted in blue), in turn, may imply either high resistance in the underlying layer, or simply that there are many equally good alternate paths for move-ment. In this way, circuit models may more accurately approximate how organisms move through real landscapes. Despite their rela-tive complexity, these maps are useful for evaluating connectivity and identifying strained areas (bottlenecks) for possible con-servation action. In Figure 4a, where the
Figure 2.A least cost path analysis.
model was confined to a particular habitat corridor, high current values clearly indicate a bottleneck where movement is funneled into a narrow space. In Figure 4b, where the analysis was conducted in a different land-scape and not constrained to a corridor, few major bottlenecks are apparent but some areas have higher current due to lower resis-tance or proximity to the nearest edges of the habitat patches, which are shown in beige.
Graph theory combined with least-cost modeling or circuit theory provides several
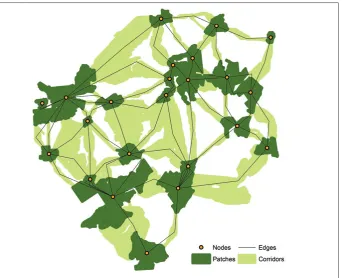
useful enhancements to landscape connectiv-ity assessment and modeling. The landscape itself can be likened to an interlaced web or network that is composed of habitat patches (graph theory modeling uses centers, or “nodes,” of these patches as points of connec-tion) and the connections between these patches (the linear representations of which are described in graph theory language as “edges”) (Figure 5). Once identified, nodes and edges can be prioritized based on their overall contribution to the landscape network, for instance by evaluating how many potential connections rely on each node or edge. This approach allows for multiple least-cost path-ways to be evaluated for their contribution to the configuration of the overall network. This approach is particularly useful when modeling connectivity between large reserve sets (assem-blages of patches, parks, or protected areas), identifying isolated reserve sets within the con-text of the modeled landscape, evaluating the robustness of multiple connections within the landscape network, node/connection prioritiza-tion, and evaluating the consequences of los-ing nodes due to competlos-ing factors such as development pressure or fiscal constraints.
The resistant kernelapproach to con-nectivity modeling is based on least-cost dis-persal from a defined set of sources. The model calculates the expected relative density of dis-persing individuals in each cell around the source, given the dispersal ability of the species, the nature of the dispersal function, and the resistance of the landscape. Once the expected density around each source cell (the smallest unit of space that is modeled contain-ing individuals disperscontain-ing to other parts, or cells, in the landscape) is calculated, the ker-nels surrounding all sources are summed to give the total expected density at each cell. The results of the model are surfaces of
expected density of dispersing organisms at any location in the landscape, in contrast to the physical delineation of linkages or corridors.
The resistant kernel approach has a number of advantages for assessing population connec-tivity. First, unlike most corridor prediction efforts, but similar to circuit-based approaches, it is spatially comprehensive, provides predic-tion and mapping of expected migrapredic-tion rates for every cell in the study area extent, and can do so for large geographic extents rather than only for a few selected linkage zones. Second, this approach allows assessment of how species with different movement patterns and disper-Figure 4. Current maps,
illustrating a) a landscape where analysis was confined to a corridor and b) a different landscape where the analysis was not confined to a corridor.
Figure 5. A graph theory model depicting connectivity between habitat patches. (a)
sal abilities are affected by a range of land-scape change and fragmentation scenarios. This approach is useful for characterizing con-nectivity across continuous surfaces but does not identify individual linkages or corridors without additional analyses.
Figure 6 shows an individual resistant kernel around a) a single source cell and b) the cumulative resistant kernel surface created from summing all individual kernels for all habitat cells. Red areas are predicted to have high frequency of occupancy by dispersers, while blue areas are predicted to experience low rates of dispersal. Case Study 2 provides an example of the use of the resistant kernel approach in evaluating fragmenting effects of roads on amphibian populations.
Considering Resolution and
Focus in Connectivity Design
The resolution at which connectivity is ecolog-ically meaningful varies enormously, depending on the species in question. For example, con-sider the scale of connectivity relevant to a bee-tle versus a bison. In practice, we tend to design and plan for connectivity at a human scale, meaning that we visualize connectivity in terms of landscape management units in a policy framework. Spatially extensive maps (thou-sands of kilometers), with coarse grained resolu-tion (for example, in the hundreds of meters per pixel or measurement unit) can depict a network of numerous habitat blocks and the connections among them. Such maps may serve as decision-support tools for managers, or provide a high-level vision of landscape con-nectivity. They may be used to alert decision-makers to potential threats to large-scale con-nectivity as well as conservation opportunities. However, these types of maps are often too
coarse to inform specific conservation action plans. Examples include the Yellowstone to Yukon initiative, Arizona Wildlife Linkage Assessment, California Essential Habitat Connectivity, Two Countries-One Forest (Case Study 3), Washington Connected Landscapes, and the Bhutan Biological Corridor Complex. The two largest challenges for coarse-grained analysis and mapping are the identification and delineation of core habitat blocks (areas whose conservation value derives from the species and ecological processes within them) and deter-mining which pairs or sets of blocks can feasibly be connected in a way that promotes functional connectivity and meets conservation goals. Once habitat blocks have been identified, vari-ous techniques may be used to map the connec-tions (or linkages) among them, including least-cost path analysis, graph theory, or indi-vidual-based movement models.
Finer-grained linkage designs can guide site-specific actions to conserve connectivity between specific habitat areas that are rele-vant to the distances and ways in which species of interest move across the landscape. To develop maps for these plans, landscape connectivity planners typically select a suite of focal species and use the union of their corri-dors or movement pathways (usually produced by least-cost modeling) to serve as a prelimi-nary linkage design for the entire biota. For instance, each of the 27 linkage plans in California (South Coast Missing Linkages pro-ject, available at www.scwildlands.org) and Arizona (the Arizona Missing Linkages pro-ject, www.corridordesign.org) was designed to meet the needs of several focal species includ-ing mammals, reptiles, amphibians, plants, and invertebrates. Focal species included area-sensitive species, species with short or habitat-restricted dispersal movements, and species
Figure 6.Resistance kernel modeling: a) single-kernel analysis and b) the cumulative resistance surface of all kernels across the landscape.
reluctant to traverse barriers in the planning area. Large carnivores are commonly used as focal species because they can require large areas of habitat, but many are habitat generalists whose ecological requirements may not suffi-ciently encompass other focal species. To create a final multi-species linkage design, this union of pathways is expanded to 1) include patches large enough to support successful breeding in species for which corridors could not be mod-eled, 2) minimize edge effects, 3) provide suffi-cient space for animals and plants that require multiple generations to achieve gene flow, and
4) include physical and biological elements that may help support ecological processes that are more complex or operating at scales that differ from those of animal movements.
A complementary approach to restoring or retaining landscape connectivity based on the perceived requirements of focal species is based instead on the abiotic drivers of land cover and species distributions. This approach is grounded in the ecological concept that bio-diversity at any point in time is determined by the interaction of the recent species pool with climate, soils, and topography. For example, Case Study 2. Effects of Habitat Fragmentation on Vernal Pool Amphibian Populations
The resistant kernel approach for modeling connectivity is well suited to assessing how species with different dispersal abilities will be affected by landscape change and fragmentation. Cushman and colleagues used the resistant kernel modeling approach to evaluate the effect of habitat fragmentation by roads and residential development on a broad range of hypothetical population sizes and dispersal abil-ities of vernal pool breeding amphibians in western Massachusetts. The analysis compared habitat connectivity among 100 combinations of population size and dispersal ability, across three scenarios. The scenarios included a null scenario, in which the landscape is uniformly suitable for movement, and two scenarios of landscape fragmentation. The fragmentation scenarios included the effects of roads and effects of roads and land use combined.
The amount of habitat that was predicted to be occupied in the null scenario was strongly related to population size and dispersal abil-ity. Figure 7 shows cumulative resistant kernel surfaces for a small portion of the study area for one combination of dispersal ability and population size for (a) the null scenario, (b) the roads scenario and (c) the roads and land use scenario. Areas in red are predicted to have high densities of dispersing individuals, while dark blue areas are predicted to have very low occupancy rates. The amount of habitat pre-dicted to be connected by dispersal in the roads scenario decreased dramatically, with most simulated populations experiencing at least a 75% reduction in connectivity compared to the null scenario. Somewhat counter-intuitively, the largest reductions in the extent of con-nected habitat were for species with relatively large dispersal abilities; this finding is consistent with a number of empirical studies that have examined the effects of fragmentation on species with varying dispersal abilities. With the combined effects of roads and residen-tial/urban development, the proportion of the simulated populations predicted to experience over 85% reduction in habitat connectivity increased from less than 10% to nearly 50%.
These results suggest that past road building and land use change may have had profound effects on the population connectivity of some vernal pool breeding species. This modeling exercise highlights the importance of landscape-level studies that explicitly include species-specific movement, abundance parameters, and the spatial patterns of the environment in a representation relevant to the organisms in question.
Figure 7. Cumulative resistant kernel surfaces for amphibian dispersal under a) a scenario in which the landscape is assumed to be uniformly suitable for movement, b) a scenario in which roads are resistant to movement, and c) a scenario where roads and different land-cover types (forest, agriculture, urban, residential, for example) are differentially resistant to movement. In all three scenarios, areas with the highest densities of organisms are in red, and those with lowest densities are in blue. The x and y axes represent longitude and latitude, and the z axis (height) represents expected density of dispersing individuals in each cell. The figure shows differences in densities of dispersing individuals across a 16 km2
Case Study 3. Northern Appalachian/Acadian Ecoregion-Scale Connectivity Assessment
The Northern Appalachian/Acadian ecoregion spans 330,000 square kilometers across four states within the U.S. and all or part of four provinces in Canada, and contains large expanses of wilderness within close proximity to large human populations. As development within the region continues, and the demand on forest resources continues to increase, the ecoregion faces the very real threat of large-scale landscape fragmentation. Two Countries, One Forest (2C1Forest) is a highly collaborative international consortium of 50 conservation organizations, researchers and foundations dedicated to using landscape conservation to protect and maintain the forests and natural her-itage of the ecoregion. To date, initiatives have been undertaken to inventory natural resources, evaluate human impact, project future growth, and identify priority locations for conservation action. Recent efforts have focused on identifying priority linkages among key port-folio conservation areas within the ecoregion.
As part of these efforts, Perkl and colleagues developed and evaluated landscape networks connecting target habitat areas arising from four plausible conservation scenarios for the Northern Appalachian/Acadian ecoregion (Figure 8). A graph-theoretic approach was used, applying the best available data on human settlement, access, land use change, and electrical power infrastructure, as a cost sur-face. Models indicated that while local connectivity was potentially retained at several sub-ecoregion scales, widespread ecoregional connectivity was not evident even in this extensive, forest-dominated region. Furthermore, the spatial dimensions of these modeled land-scape networks were staggering in scale and pose substantial challenges to implementation. Among the four scenarios, total network lengths ranged from 2,589 to 4,190 km, with total corridor areas ranging from 13 to 18 million hectares.
This analysis was a first pass at evaluating ecological connectivity for the region and among the first to assess and model connec-tivity at this scale. While this initial work was not intended to serve as a prescription for landscape or connecconnec-tivity design, it has proved a valuable first step in developing plausible scenarios that can be further refined to test assumptions for large swaths of the ecoregion that might serve a connectivity function.
Figure 8. Evaluation of landscape networks using four different scenarios to select habitat targeted for conservation: a) biodiversity conservation (n=95), b) Last of the Wild areas (an evaluation of human influence across ecosystems to identify remaining large wild places, n=120), c) modeled habitat patches for mature-forest focal species (n=105), and d) a composite viability scenario which was composed of selected sites from each of the previous scenarios (n=143).
(a) (b)
(c) (d)
least-cost path analysis can be used to identify corridors that optimize continuity among recurring landscape units – areas with specific topographic, bedrock and soil attributes. Similar to identifying corridors for individual species, landscape units can be included in a linkage design with multiple, broad corridors that are likely to facilitate the movements of multiple species. These areas will, theoreti-cally, support ecological and evolutionary processes, including species’ range shifts in response to climate change, because they con-tain both the resources that species need, and the means for individuals to move among
mul-tiple potentially appropriate habitat blocks to buffer against the loss or degradation of habi-tat due to landscape change.
The challenges of moving from maps and designs to implementation
Connectivity maps and linkage designs are use-ful for conservation only to the extent that they can support decision-making, guide man-agement, or otherwise be implemented. If municipalities, transportation agencies, and land management agencies are to integrate these designs into their own land use and plan-Case Study 4. Evaluating Landscape Connectivity for Prioritizing Restoration Opportunities in the Delaware Estuary
Landscape connectivity analysis can be a valuable decision tool for prioritizing restoration opportunities, helping to iden-tify areas that hold the greatest potential for increasing connectivity for focal species. In the Mid Atlantic region of the U.S., interest in restoration opportunities in the Delaware Estuary is increasing. For scientists, planners, and the public, a chief challenge has been to plan for the estuary in a manner that ensures that the value of regional restoration efforts is maximized to improve habitat quality for and persistence of wildlife populations, against a backdrop of an increasingly urbanized ecosystem.
To address this need, researchers modeled landscape connectivity for six candidate restoration sites under con-sideration by the Delaware Estuary Regional Restoration Work Group (DER-RWG). The approach integrated data on home ranges, dispersal requirements, and habitat quality to evaluate suitable habitat for black duck (Anas rubripes), least bittern (Ixobrychus exilis), and marsh wren (Cistothorus palustris). The relative connectivity value for each habi-tat patch was determined through the
calculation and comparison of three value parameters for each potential restoration site: (1) production, defined as the relative ability of a patch to contribute to overall recruitment as determined by local natality or mortality rates, which are influenced by patch area or habitat quality; (2) dispersal, the relative importance of a patch to the dispersal flux of individuals away from their natal patches or as part of a home range, and (3) traversability, the relative importance of a patch as a stepping stone between isolated patches. Species-specific infor-mation was used to assign habitat suitability scores based on several characteristics, including dominant vegetation community, similarity to target species preferences for vegetative types, proximity to wetlands, and species habitat and area requirements.
The ability of the six restoration sites to provide high-quality habitat was species-specific: all restoration sites showed potential for provision of high-quality habitat for black duck, three restoration sites showed particularly good potential habitat quality for marsh wren, and all six sites showed high traversability scores for this species. However, only two of the six sites met the dispersal requirements of the least bittern (St. Vincent’s and Pennypack Park, Figure 9), and these two sites were highlighted as potentially serving an important function for connecting iso-lated populations of least bitterns across the landscape. These landscape-scale measures of the species-specific ecological value of each restoration site were provided for consideration by the DERRWG in the evaluation of potential restoration sites across the Estuary.
Figure 9. Maps identifying habitat quality based on dispersal requirements of the Least Bittern, used in evaluation of candidate restoration sites in the Delaware Estuary. Habitat quality scores are created by evaluating multiple, species-specific habitat characteristics, including how the patch contributes to overall population growth, the ability to provide opportunities for dispersal, and the extent to which the habitat patch may serve as a stepping stone to other patches (traversability).
Pennsylvania
New York
New Jersey Maryland
Habitat Quality Score
33
58
83
100
0 1 2 4 6 8 Kilometers Pennypack Park Saint Vincent’s K&T Trail, Frankford Launch
ning efforts, conservation professionals must provide specific guidance on how to use con-nectivity maps and designs in land use, zoning, transportation, and other types of plans.
Teams that engage stakeholders from the project outset and remain focused on the pur-pose and need for connectivity analyses are more likely to produce useful maps and data (for example, Case Studies 4 and 5). It is important to understand how organizations interact to achieve connectivity goals, particu-larly where different agendas may operate in the same landscape. If groups operate indepen-dently, and the fundamental needs of each organization are widely divergent, simply embracing the same long term objectives may not be sufficient. Differences in organizational needs or agendas can be constrained by politi-cal or land ownership boundaries. Recognizing these differences up front and explicitly addressing them in a connectivity strategy is vital to stakeholder agreement and project success. Finding agreement and compromise among stakeholder agendas helps in reducing conflict and the time spent on decision-mak-ing to pursue a conservation strategy, which in turn can reduce the overall costs and time-frame of implementation.
Recognizing and Addressing
Uncertainties
Connectivity modeling involves uncertainties and challenges, all of which should be directly addressed. All models are abstract and partial representations of reality. However, if models or data are wildly incorrect, modeled corridors and other inferences about landscape connectivity
may do more harm than good. Here, we discuss points to consider when applying connectivity models to achieve conservation goals.
Uncertainty and error can be introduced into the modeling process through a number of avenues, including inaccurate or incom-plete characterization of species’ biology, incomplete theoretical basis for model devel-opment, inappropriate data extrapolation, uncertainty in future landscape change, and changes in design goals during the planning process. Taken together, these sources of error increase uncertainty and signal the need for targeted collection of empirical data or, at a minimum, indicate that greater caution must be exercised when crafting conservation actions from the models.
The following points provide a framework for examining and addressing potential uncertain-ties in the context of connectivity planning.
Pay special attention to correct charac-terization of the biology of focal species in the ecosystem under analysis. For example, core habitat requirements should be as correctly and completely identified as possible. If habitat require-ments are not well understood and are not accurately parameterized, even good mod-els of movement or gene flow will result in erroneous linkage designs. If the core habitat requirements of a given focal species are not well understood, it may be a good idea to substitute a different focal species whose biology is better under-stood, so that the model can be parame-terized with more confidence.
Case Study 5. Using Science to Evaluate Compromises During Implementation of a Linkage Design
In June 2009, the Arizona state wildlife agency released a detailed plan to conserve a wildlife corridor between the Tortolita Mountains and the Santa Catalina Mountains, just north of Tucson, Arizona. The plan (linkage design) included corridors for 9 focal species, as well as habitat maps for several other focal species for which corridor models could not be created. In a proactive response, the local land-use planning agencies (Pima County, Town of Oro Valley, and the State Land Department) modified a proposed 14,000-acre urban development project so that the project would conserve one of the three main corridors of the linkage design. Their modified development plan also proposed to destroy another corridor and defer the fate of the third.
Understand the strengths and limitations of the connectivity models. For example, does the model predict movement solely from habitat-use data? If so, the model may underestimate long-distance movements of individual dispersers. Models based on inferences from movement behavior or patterns of landscape genetics may provide better predictions of connectivity.
Consider the effects of spatial and temporal extent in all of the analytical approaches described above. Temporal aspects of eco-logical function may range from daily changes in foraging habitat to seasonal migrations, to inter-annual fluctuations in climate, disturbance, and site productivity. Spatial considerations can range from removing specific barriers to local animal movement, to facilitation of long-distance dispersal, to regional plans that consider regional connectivity. For example, individ-ual property owners may remove fences at lot lines. Neighborhood considerations may include street design, such as reducing curb height, which can be a significant barrier for smaller, less mobile species such as turtles. Municipal connectivity initiatives may incorporate greenway delineation as part of the comprehensive planning process. State and regional initiatives may incorporate sys-tem-wide processes, such as watershed plan-ning and ecoregional connectivity assess-ments. The spatial extent of connectivity planning may even transcend national boundaries, as in the Yellowstone to Yukon initiative linking wildlands in western North America, or an ecoregional connec-tivity assessment in the Appalachian/ Acadian region (Table 1 and Case Study 3). The challenge for connectivity management is ensuring that multiple levels of effort com-plement each other in a coordinated way, and that the selected analytical method or methods are appropriate relative to the intended management or conservation objectives. Mismatches between the scale of the ecological processes of interest and the scale of analysis may result in failure to con-serve connectivity.
Be aware of uncertainties that emerge when trying to extrapolate results outside of the originally observed conditions.
While some degree of extrapolation is inevitable, given that comprehensive infor-mation about the needs and responses of all
individuals of all species in every location could never be obtained, extrapolation to other locations or species should be based on empirical results relevant to the species and landscape under consideration. For example, if the goal of connectivity model-ing is to understand the movements of a rare temperate forest songbird, but a surro-gate species is identified for modeling due to the constraints of available data, one should look first to another temperate for-est songbird whose taxonomy and ecologi-cal requirements are likely to be similar to the target species. Extrapolation across scales, both temporal and spatial, is an additional challenge. Knowing the physical characteristics that influence patterns of movement across short distances or short periods of time may not be representative of how an organism makes decisions regarding long-distance movements or movements that extend over periods of time measured in seasons or generations.
Be aware that relationships among ecologi-cal and landscape variables may not be linear. Extrapolation requires an assump-tion about the nature of the relaassump-tionship among factors outside the range of what is actually known. Because nonlinearities can take almost any form, assumed relationships stand a great chance of being incorrect.
Try to account for anthropogenic land-scape change and the processes that drive it.Anthropogenic influences will continue to greatly affect many species’ habitats and their movements; modeling should incor-porate anthropogenic drivers of change and how these drivers affect habitat and movements.
Address the random variation that is inher-ent in many biological processes.It often is helpful to present a range of potential out-comes or the likelihood of certain outout-comes (such as population persistence) under dif-ferent assumptions about such variation, rather than a single “best” solution.
wildlife species and can be applied to land-scape-scale and local planning efforts, one linkage design cannot encompass all possi-ble connectivity goals and objectives at all planning scales. For example, a linkage design that captures landscape-scale con-nectivity of natural habitats across large ecoregions (for example, Case Study 3) may address broader or different conservation goals than a design based on local-scale con-nectivity between pairs of core areas (for example, Case Study 4). Similarly, an ecore-gional analysis may prioritize connections that do not emerge in a continental-scale analysis. Through regular reference to the stated goals, the tendency for the focus to shift or the scope of a project to widen (“mission creep”) can be avoided.
Plan for increased connectivity and con-serve existing corridors to account for changing landscape conditions and threats.
Because many changes are not predictable, adaptive management is critical. Monitoring is essential for adaptive
agement, because monitoring helps man-agers to keep track of what is changing in real time – such as the arrival of a new invasive species in the landscape, or changes in stream discharge that may affect fish habitat connectivity – and informs quick and appropriate responses. Managers and planners should be willing to expend resources on the adaptive management process, including not only making deci-sions about priority linkages, but also fol-lowing through to monitor the status, func-tion, and trends of these linkages, evaluate and assess the observed changes, and adapt future connectivity planning accordingly.
In the long term, data gaps and areas of high uncertainty can be reduced with better data and models or a stronger conceptual approach. At a minimum, practitioners should exercise caution when crafting conservation actions from connectivity models. Articulation of these uncertainties does not, however, diminish the usefulness of these tools. Explicit acknowledg-ment of uncertainties allows results to be
inter-Table 1. Examples of connectivity maps and their utility.
Extent Project* Map Type Application
Individual South Coast Linkage design and specific conservation Over 25 partners have used the plan to help linkage Missing Linkages plans for each of 11 key linkages in secure over 100,000 ha of land, modify
California’s south coast ecoregion. current land-use plans, and plan wildlife-friendly infrastructure.
State-wide Washington Coarse-grained analysis identifying broad Used to identify where highway mitigation
Connected connectivity patterns for Washington and dollars can provide greatest wildlife benefits
Landscapes adjacent areas. Maps depict suitable habitat and to inform actions by state and federal and linkages for 16 focal species comple- land management agencies, NGOs, and mented by an ecological integrity analysis. other parties.
Ecoregional Staying Connected Coarse-grained identification of critical Used by 21 public and private partners as
in the Northern movement areas for wildlife spanning a framework to engage local stakeholders in
Appalachians several states and provinces, especially in each area to further refine and identify across the U.S./Canadian border. key areas of local connectivity and reduce
Two Countries, risks of habitat fragmentation to wildlife
One Forest movement.
National Wild LifeLines Coarse-grained analysis of potential wildlife Prioritizes a network of naturalness-based dispersal pathways across the coterminous connections in terms of the contribution of 48 states. Uses multiple layers including land each pathway to the flow of connectivity cover, distance to roads and housing density across the network. Model favors pathways as proxies for habitat permeability and that avoid fragmented and human-modified potential for wildlife movement. landscapes.
* For more information about each project:
South Coast Missing Linkages http://scwildlands.org Washington Connected Landscapes http://waconnected.org
Staying Connected in the Northern Appalachians http://www.conservationregistry.org/projects/3837 Two Countries, One Forest http://www.2c1forest.org/en/mainpageenglish.html
landscape according to their influence on dis-persal between patches and the importance of those dispersal pathways to species persistence. However, the construction of complete models can require many years for a single species, making these methods infeasible for applica-tions to large numbers of species. An impor-tant way to address this constraint is to develop spatially explicit, stochastic, demo-graphic meta-population models that can be parameterized for many species. Simulation models can be used to compare how the sub-traction of each patch and linkage in a com-plete network influences mean time to extinc-tion. Only through this type of persistence modeling will it be possible to examine the trade-offs between corridor conservation and augmenting the size of existing protected areas for long-term biodiversity conservation. Importantly, this approach can incorporate economic trade-offs, allowing prioritization of how conservation dollars are applied within a network of core areas and corridors.
2. Behavioral ecology
Current methods for identifying connections among habitat areas and estimating the costs to organisms of moving through a landscape are largely based on habitat suitability model-ing, which uses information on habitat requirements or the extent to which species avoid human-altered landscapes, such as the built environment. However, current informa-tion regarding species’ behavioral responses to habitat modifications at the local and land-scape scale is inadequate. For example, under-standing how wildlife species are impacted by roads and how they possibly avoid them is critical because roads are widespread and increasing in density in many areas. Land use changes may lead to behavioral responses that differ widely even within taxa. For example, some monkey species adapt quickly to human alteration of the landscape for agriculture, migrating through and even benefitting directly from agricultural crops by foraging in them, while other species in the same area that specialize on mature forests will not use and may actively avoid farmed areas. Other potential barriers, such as noise or light pollu-tion, may have profound effects on animal behavior and functional landscape connectiv-ity, but are even less well studied and under-stood. Preliminary research suggests that even supposedly unobtrusive forms of human activi-ties, such as low-impact recreation, can affect preted honestly and can suggest future
direc-tions for research and critical evaluation. Further, models can be useful even when under-lying data are sparse or weak, such as using pre-dictions to compare scenarios (which among a set of strategies is likely to lead to greater gene flow?) rather than stating absolute responses (if a strategy is implemented, it will increase gene flow by a specific amount).
Future Directions for
Connectivity Science
Although connectivity science has evolved considerably in the last twenty years, much still needs to be learned in order to improve the effectiveness of design and implementa-tion. Research on species persistence, behav-ioral ecology, and community structure is needed to increase the accuracy and reduce the uncertainty associated with connectivity mod-els. Also, evaluating and testing connectivity responses to climate change will be fundamen-tal to achieving conservation goals in the face of the rapid changes that will confront many communities and ecosystems. And all of these potential areas of advancement will fall short of conservation goals if the interdependence of humans with natural landscapes is not recog-nized and human activities are not effectively incorporated into connectivity planning.
1. Species persistence
One of the most important directions for con-nectivity science is to incorporate the likeli-hood of species or population persistence into conservation plans. Persistence is a vital con-cept for evaluating what happens to species and communities when connectivity is lost and which connections are most important to maintain. Most reserve design is based on static maps of species distributions, in an attempt to maximize the potential number of species con-served across a reserve network. However, it is important to incorporate species persistence into conservation plans, particularly when planning for a network of reserves or habitat patches in which populations of species may be distributed as metapopulations – groups of sub-populations that are linked by some gene flow.
animal behavior; for example, bird-watching activities have been shown to contribute to marked declines in the detection rate of meso-carnivores in California. Equally important is the continued study of local habitat characteris-tics that are required to maintain functional habitat connectivity. Some bat species, for example, appear to be more sensitive to local habitat features such as suitable roosting struc-tures and wet areas for foraging, than to changes in large-scale vegetation cover patterns.
The influence of many human activities on wildlife behavior and connectivity is still not well understood. Habitat mapping and simula-tions are often less expensive than fieldwork and hence form the basis for much of the work done in connectivity science to date; however, the need for more fieldwork to fully inform such models cannot be overstated. Local field studies are essential for improving connectiv-ity models and, ultimately, on-the-ground conservation outcomes.
3. Community structure
Habitat loss and fragmentation strongly influ-ence predator-prey and competitive interac-tions that help shape ecological communities, with variable impacts on individual species or populations. If habitats are reduced in size and connectivity to the extent that apex predators cannot persist, this process can lead to trophic disruption or collapse, and many such trophic cascades have been documented in both ter-restrial and marine systems. For example, loss of connectivity has facilitated trophic col-lapse in some African landscapes: habitat fragmentation and loss has caused declines of lions and other apex predators, leading to rapid increases in mesopredators, such as baboons. These baboon populations are in turn able to sustain themselves by taking advantage of human-altered landscapes through crop-raiding. Theoretical studies have shown that interactions between competitors are very sensitive to the structure of the land-scape. These studies also demonstrated that habitat fragmentation can either stabilize interspecific competition, allowing for the coexistence of similar species or, as fragmenta-tion increases, it may increase competifragmenta-tion to a level where one of the species is eliminated. In these cases, coexistence or exclusion of species results from a tradeoff between disper-sal rate and competitive ability, in relation to the degree of habitat modification and frag-mentation. The key factors underlying each
case are the interactions of behavioral and life-history characteristics of particular species with the scales and patterns of variability of the landscapes in which they live.
4. The challenges of climate change
Connectivity is one of the most commonly advocated strategies to help species adapt and survive rapid climate change. The idea is that connectivity may allow species to shift their ranges in response to changing climate, and thereby allow evolutionary and ecological processes to be sustained. However, connec-tivity designs based on current land cover pat-terns may not allow species to adapt to a changing climate and shifting ecological zones. During the next century of climate change, habitats will not simply shift or shrink, but many will disappear as species shift their ranges, adapt, evolve, or go extinct in idiosyncratic ways.
Connectivity designs can incorporate the ability to respond and adapt to climate change in several ways, although none have been rig-orously tested. One approach tracks how a species’ climatic envelope (suitable tempera-ture and moistempera-ture regime) moves across a landscape under several decades of simulated climate change. The predicted corridor is the chain of locations that were (during the simu-lation) contiguous for enough time to support range shifts, with new populations becoming established in locations that transition into the envelope while other populations go extinct. Such models are conceptually sound but depend on at least four other highly uncer-tain and often only partially predictive mod-els: 1) predictions of future carbon emissions, 2) models of how the atmosphere and oceans respond to these emissions, 3) climate enve-lope models for the focal species, and 4) dis-persal abilities of these species. In addition, the most problematic aspect of these models is that, under climate change, novel types of cli-mates are expected to occur, and forecasting how suitable these novel climates will be for existing species cannot be reliably conducted.
resilience, based on the following assump-tions: 1) the advantages of connectivity are greatest for areas that will experience faster rates of change, 2) a reserve network that har-bors greater climatic diversity will allow for greater adaptation, and 3) maintaining access to cooler climates is a high priority. For exam-ple, if the distribution and representation of climates contained in a protected area is expected to change quickly and dramatically, then species in those locations may have to move, and corridors may be critical for their survival. This approach prioritizes the mainte-nance of reserves with greater climate stabil-ity. Another equally reasonable assumption is that a reserve network that harbors greater climatic diversity will provide refugia that allow for adaptation, so targeting links that add climatic diversity to the network is another possible approach.
An even simpler approach builds on the idea that rivers and their associated valleys provide a gentle and monotonic temperature gradient that may allow species to shift their ranges by sequentially colonizing areas along that gradi-ent. Because such valleys will support riparian vegetation in nearly all climate regimes, they should be part of any connectivity map.
In some instances, short distance movement may be all that is required for species to shift their range and persist, in which case addi-tions to existing protected areas may prove more effective and efficient than establishing corridors. Hence, additional research is needed to determine under what conditions adding area to existing reserves is more effec-tive than adding linkages for increasing cli-matic diversity within a reserve network. Recent efforts by physical scientists to down-scale climate change models may allow ecolo-gists to explore these questions. Approaches using landscape units, temperature gradients, and river valleys are coarse-filter approaches and, therefore, are unlikely to meet the needs of all terrestrial species, especially the most extreme habitat specialists. However, even the best fine-filter (species-based) approach will not be able to serve the needs of species that cannot shift their range fast enough in response to rapid climate change.
5. Putting people back on the landscape
The interaction between land use and natural systems affects not only biodiversity but also human livelihoods. Quantification of the
ecosystem service benefits that result from well-connected habitat, as compared to frag-mented landscapes, may help leverage public and political support. In particular, hydrologic connectivity can provide increased water quality and aquatic species diversity upon which humans and other terrestrial species rely. Multidisciplinary teams can use surveys of resource use and attitudes, and analysis of political structure to complement connectivity maps and plans, supporting a holistic under-standing of the landscape and the organisms that inhabit it.
Further knowledge about how connectivity benefits ecological services can, in turn, improve the public’s understanding of the importance of protecting connected wildlands. Ecosystem services, such as water and air qual-ity or pollination, provide additional value beyond species movement and persistence. As connectivity conservation continues to become more prevalent, planning efforts need to be directed beyond simply quantifying the facilitation of species movement towards quantifying these additional positive conserva-tion outcomes as well.