International Journal of Humanities and Social Sciences p-ISSN: 1694-2620 e-ISSN: 1694-2639 Vol. 8 No. 5, pp. 18-26, ©IJHSS
Likert Scale Development: Construction and Evaluation of
Home Environment Scale
Mukhtar Ahmad Wani & Aejaz Masih
Department of Educational Studies Jamia Millia Islamia (A Central University) New Delhi, India- 110025
Abstract
The purpose of present paper is the construction and evaluation of home environment scale. An attempt was made in this study to evaluate validity, reliability and to determine the appropriate standards to interpret the results of home environment scale. The final form of the scale includes ten sub-scales (dimensions) with seventy one (71) items/statements. The scale was validated for its content by more than 20 experts from the related and allied fields. The construct validity was calculated through factor analysis for items, and by correlating the score of each sub-scale with the total score of the sale. t test for two independent samples was used (high group 27% and low group27%) to find the discrimination validity for each sub-scale. The reliability for the whole scale as well as for each sub-scale was calculated through Alpha coefficients. From the reliability coefficients, it can be concluded that the scale is reliable as all the values are above .70. Finally, the appropriate standards for interpretation of scores based on stanine procedures are highlighted. However, interpreting the scores through stanine the investigator has to calculate z values of raw scores after the data have been collected from all the sample participants. The stanine procedure is the standardized technique for the categorization of the scores for meaningful interpretation of Likert scale responses.
Keywords: Construction, Evaluation, Home Environment, Likert Scale, Reliability, Validity,
Stanine
Introduction
Various instruments have been developed for assessing the home environment in foreign as well as in India. Some foreign scales are developed by Watson 1957, Williamson 1961, Moos 1974, Bradley 1981 and some Indian scales by Prerna Mohete, Beena Shah, Reena Sharma, K. S. Mishra etc. As we know the foreign tools are not culture fair and this makes them unsuitable for use in the particular context. Another issue with these foreign scales (Moos) is that they lack reliability with respect to adolescent sample (Boyd, C. P. et al, 1997). Other issue is their language of the items in which they have been originally developed and their lack of measuring all the major dimensions, that are universally acceptable on which home as a social institution is based. Similarly, Indian scales measuring home environment are not without the pitfalls like that of assessment of home environment for the age group of 20 to 50 years (Reena Sharma) and with only five areas of home environment and others only devised for measuring home environment for I-VIII class students (Prerna Mohete). While others for high school students (Beena Shah) and others assessing only the psychological nature of the home (Mishra). Hence a complete tool to assess the major parameters on which any institutions is based seems to be lacking in these
scales and this demands a new scale to be developed, which measures broad three parameters of home environment which are interrelationship parameter, individual development parameter and system organization parameter.
Objectives
1. To construct a Likert scale measuring the attitude of senior secondary school students
towards their home environment.
2. To evaluate the validity of home environment scale. 3. To evaluate the reliability of home environment scale.
4. To formulate appropriate standards to interpret the results of home environment scale. Methodology
Descriptive statistical method was employed in the present study. The process of description as employed in this research study goes beyond mere gathering and tabulation of data. It involves an element of interpretation of the meaning or significance of what is described. Thus, description is combined with comparison or contrast involving measurement, classification, interpretation and evaluation.
Sample
The samples of the study is comprised of 106 senior secondary school students currently enrolled in class 11th of different (Govt./Private) schools of South Kashmir of Jammu and Kashmir during the year 2015. This study was delimited to students of class 11th. Secondly the age range of the members of the population is 16-17 years.
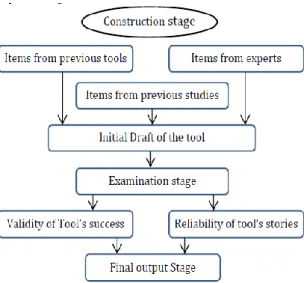
Stages of tool construction
As with the tool construction, there is no total agreement of experts about the precise steps for tool construction. Nevertheless, when constructing a tool, it is necessary to go through a number of stages in order to ensure its good quality (Alderson, 1995). Although their needs a proper procedure for tool construction. The graphical representation for the stages of tool construction as depicts in figure 1.
Preparation of the preliminary draft
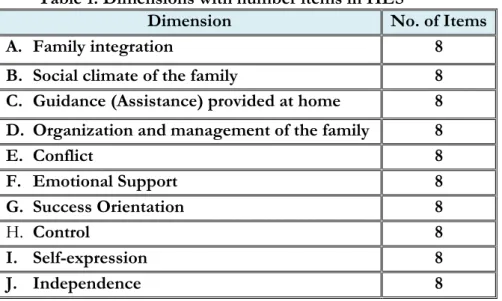
Having gone through the literature and previous tools as mentioned above in introduction, ten dimensions based on three mentioned broad parameters were selected which are related to the overall environment of home. Interrelation parameter includes dimension as Family integration, Conflict, Self-expression and Social climate of the family. Individual development parameter includes dimension as Guidance provided at home, Emotional support, Success orientation and Independence and System organization parameter includes dimensions like Organization and management of family and Control. Then the items associated with ten dimensions were selected and each item was selected according to the nature of the dimension. For the selection of the items, previous tools and studies related with home environment were consulted along with the available literature. While selecting items, the nature of item measured the desired dimension of home environment were taken into consideration. In this way the initial draft was prepared and 110 items (11 in each dimension) were included in the scale. Then, draft items were given to experts from different universities who were well versed in the field and scale construction with a request to review the statements and evaluate their content accuracy coverage, editorial quality and suggestions for additions, deletion and modification of items. On the basis of 80% of unanimously 30 items were deleted and 80 items were retained, which are reported below with the number of items:
Table 1: Dimensions with number items in HES
Dimension No. of Items
A. Family integration 8
B. Social climate of the family 8
C. Guidance (Assistance) provided at home 8
D. Organization and management of the family 8
E. Conflict 8 F. Emotional Support 8 G. Success Orientation 8 H. Control 8 I. Self-expression 8 J. Independence 8
Try-out of the tool
The initial format with 80 items was administered on the sample of 106 higher secondary school students from Kashmir (J&K). This is an attitude scale measuring the children‟s attitude towards their family environment. The scale requires pupils to tell the favorableness or unfavorableness with which a particular behavior has been observed by them in their homes, i.e., he/she is requested to tell whether they are Strongly Agree, Agree, Undecided, Disagree and Strongly Disagree respectively with the items in the scale.
Scoring of the Responses to HES Items
There are five options namely, “Strongly Agree”, “Agree, “Undecided, “Disagree” and “Strongly Disagree”, for each statement of the scale. 5 marks were assigned to 'Strongly Agree', 4 marks to 'Agree', 3 marks to 'Undecided', 2 mark to „Disagree', and 1 marks to „Strongly Disagree' responses and for negative items scoring is done in reverse order like 1,2,3,4,and 5 for Strongly Agree, Agree, Undecided, Disagree and Strongly Agree respectively. Then the marks were counted which were assigned to A, B, C, D, E, F, G, H, I and J dimension statements and then they were added to get the total composite score on the particular dimension. Ten composite
scores for ten dimensions of the scale consists the children‟s attitude towards their home environment.
Item Analysis
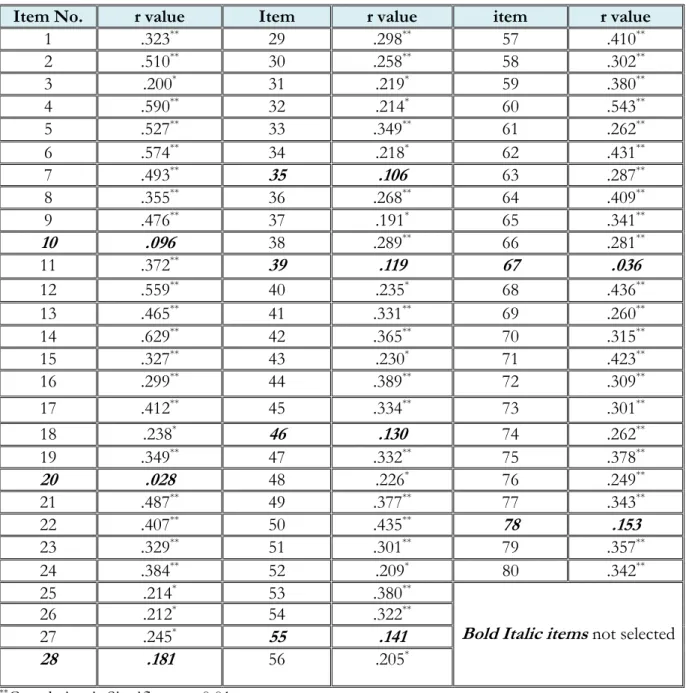
For assessing the item analysis bi-serial correlation was used to sharpen the scale. The responses were collected and scored. Individual item score was correlated with the total score of the tool. Item analysis was done for the 106 response sheets by using Item Vs Whole correlation method. The sum of the scores on each dimension of value was calculated. Then „r‟ was calculated by correlating the individual item and the corresponding component score. The correlation coefficient at the 5% level of significance is 0.196 when the degree of freedom is 100 (Best, J. W. 2006). So the items having „r‟ values 0.196 and above were selected. It was found that out of the total 80 items, there are 71 items which are having significant correlations with the total score of the scale except 9 items which are having no significant correlation with the total score of the tool. The correlation table is given below:
Table 2: r Values for HES
Item No. r value Item r value item r value
1 .323** 29 .298** 57 .410** 2 .510** 30 .258** 58 .302** 3 .200* 31 .219* 59 .380** 4 .590** 32 .214* 60 .543** 5 .527** 33 .349** 61 .262** 6 .574** 34 .218* 62 .431** 7 .493** 35 .106 63 .287** 8 .355** 36 .268** 64 .409** 9 .476** 37 .191* 65 .341** 10 .096 38 .289** 66 .281** 11 .372** 39 .119 67 .036 12 .559** 40 .235* 68 .436** 13 .465** 41 .331** 69 .260** 14 .629** 42 .365** 70 .315** 15 .327** 43 .230* 71 .423** 16 .299** 44 .389** 72 .309** 17 .412** 45 .334** 73 .301** 18 .238* 46 .130 74 .262** 19 .349** 47 .332** 75 .378** 20 .028 48 .226* 76 .249** 21 .487** 49 .377** 77 .343** 22 .407** 50 .435** 78 .153 23 .329** 51 .301** 79 .357** 24 .384** 52 .209* 80 .342** 25 .214* 53 .380**
Bold Italic items not selected
26 .212* 54 .322**
27 .245* 55 .141
28 .181 56 .205*
**Correlation is Significant at 0.01 *Correlation is Significant at 0.05
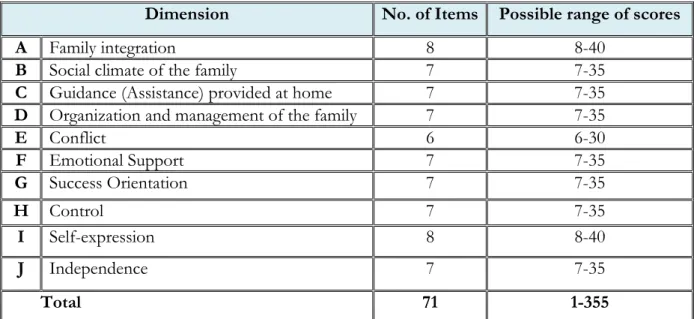
From the perusal of table 2 above, it is clearly reflected that some of the item (bold and italics) were not having a significant correlation with the total scores of the scale and hence were deleted. After the rejection of 9 unsuitable items from the scale, a total of 71 items in ten dimensions of home environment scale were selected which are shown below in table 3 along with the possible range of scores:
Table 3: No. of items and range of scores in each dimension of HES Evaluation of tool validity
When a test measures what it has been suposed to measure, is said to be valid. To determine the validity of the test, the researchers tested face validity, construct validity and discrimination validity.
Face validity or content validity
The content validity of the „Home Environment Scale‟ was tested by more than 20 experts. It is evident from the assessment of experts that items of the test are directly related to the different dimensions of Home Environment.
Construct validity
In order to find out the construct validity, the researcher calculated correlation between each sub-scale‟s score and total score of the scale.
Table 4: Correlation between Each Dimension and Total Score
From the perusal of the table 4 above, it can be concluded that the correlation coefficient of all dimensions (.712, .684, .609, .379, .431, .519, .513, .616, .550, and .515 respectively) are significant at .01. This indicates that all dimensions are related to home environment and the tool has good construct validity.
Dimension No. of Items Possible range of scores
A Family integration 8 8-40
B Social climate of the family 7 7-35
C Guidance (Assistance) provided at home 7 7-35
D Organization and management of the family 7 7-35
E Conflict 6 6-30 F Emotional Support 7 7-35 G Success Orientation 7 7-35 H Control 7 7-35 I Self-expression 8 8-40 J Independence 7 7-35 Total 71 1-355
Dimension ‘r’ values Dimension ‘r’ values
A 0.712** F 0.519**
B 0.684** G 0.513**
C 0.609** H 0.616**
D 0.379** I 0.550**
Factor Analysis
However the scale was also subjected to exploratory factor analysis as the minimum number of cases required for factor analysis is 100 (Kline, 1986). All the ten components were retained as the eigenvalues are above 1. From the exploratory factor analysis items loading .4 were selected and items below .4 were dropped from the scale. From the factor analysis it can be concluded that all the items are measuring the same construct.
Discrimination validity
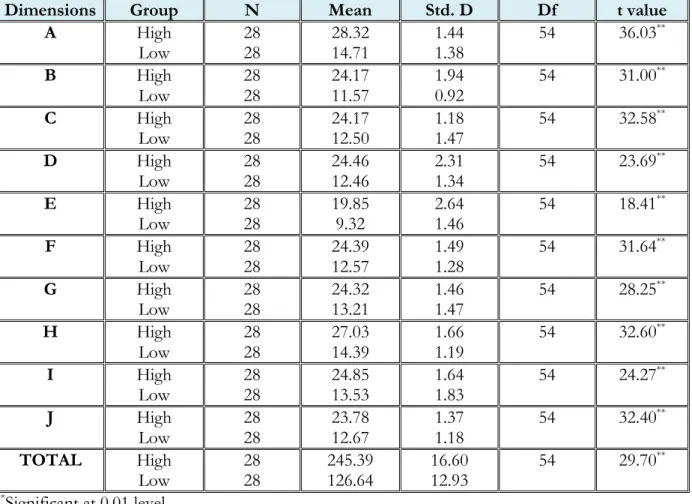
To find out the discrimination validity of the items the researchers used item analysis (difficulty level value and discrimination value). For knowing the level of discrimination validity for each dimension of the scale, ‘t’ test for two independent samples was used (high group 27% and low group 27%). Finally the discrimination validity of whole test was also determined by using ‘t’ test. Discrimination validity for each domain and whole test is given in the table below. It indicates that all ‘t’ values are significant at level 0.01 and the means of high group are also higher than low group which support the high validity of home environment scale.
Table 5: t values for each dimension of the HES
**Significant at 0.01 level
Reliability of the Home Environment Scale
The degree of consistency among test scores is called reliability. The values of reliability coefficients (Cronbach alpha) for each sub-scale and for the whole scale are shown below:
Dimensions Group N Mean Std. D Df t value
A High Low 28 28 28.32 14.71 1.44 1.38 54 36.03** B High Low 28 28 24.17 11.57 1.94 0.92 54 31.00** C High Low 28 28 24.17 12.50 1.18 1.47 54 32.58 ** D High Low 28 28 24.46 12.46 2.31 1.34 54 23.69 ** E High Low 28 28 19.85 9.32 2.64 1.46 54 18.41 ** F High Low 28 28 24.39 12.57 1.49 1.28 54 31.64** G High Low 28 28 24.32 13.21 1.46 1.47 54 28.25 ** H High Low 28 28 27.03 14.39 1.66 1.19 54 32.60 ** I High Low 28 28 24.85 13.53 1.64 1.83 54 24.27 ** J High Low 28 28 23.78 12.67 1.37 1.18 54 32.40** TOTAL High Low 28 28 245.39 126.64 16.60 12.93 54 29.70 **
Table 6: Reliability coefficients of HES
Dimensions Alpha Dimensions Alpha
A .753 G .747 B .774 H .736 C .708 I .706 D .729 J .725 E .781 Total Reliability of the Scale .895 F .719 Final form
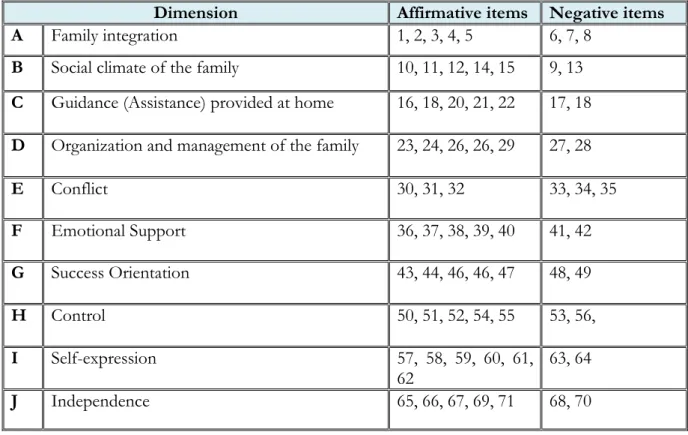
The final form of the scale along with serial no. of items for affirmative and negative statements is presented in the below table 7.
Table 7: Item Presentation in the final form of HES:
Dimension Affirmative items Negative items
A Family integration 1, 2, 3, 4, 5 6, 7, 8
B Social climate of the family 10, 11, 12, 14, 15 9, 13
C Guidance (Assistance) provided at home 16, 18, 20, 21, 22 17, 18
D Organization and management of the family 23, 24, 26, 26, 29 27, 28
E Conflict 30, 31, 32 33, 34, 35 F Emotional Support 36, 37, 38, 39, 40 41, 42 G Success Orientation 43, 44, 46, 46, 47 48, 49 H Control 50, 51, 52, 54, 55 53, 56, I Self-expression 57, 58, 59, 60, 61, 62 63, 64 J Independence 65, 66, 67, 69, 71 68, 70
Table 8: Scoring table for all dimensions of HES
Dimensions A B C D E F G H I J
Score Mean Stanine
The table 8 above represents the scoring for each dimension of the scale. The table is blank, because the raw scores, mean and stanines will differ from sample to sample. The table is to be filled after the data have been collected. The interpretation of the scores is done separately for each dimension based on the Z value. Then the nine levels based on Z values ranging from -1.75
to +1.75 are to be divided. The stanine procedure is the standardized technique for the categorization of the scores for meaningful interpretation.
Results
After following these steps to construct the scale and after analyzing the data from the first and the last application by using adequate statistical methods, it has been concluded that:
The study has produced a scale measuring the attitude of senior secondary school students towards their home environment. This scale includes 71 items which measures ten dimensions of home environment viz, Family integration, Social climate of the family, Guidance (Assistance) provided at home, Organization and management of the family, Conflict, Emotional Support, Success Orientation, Control, Self-expression and Independence.
The scale has been validated through content, construct and discrimination validity. The content validity has been evaluated by experts, construct validity has been calculated by Pearson‟s correlation. The correlation coefficients of all dimensions are (.712, .684, .609, .379, .431, .519, .513, .616, .550, and .515 respectively) which are significant at .01 level. This indicates that all dimensions are related to home environment and the scale has good construct validity. The discrimination validity has been evaluated through „t‟ test between high group 27% and low group 27%. All „t‟ values are significant at level 0.01 and the means of high group are also higher than low group which support the high validity of HES.
The reliability of the scale was evaluated by calculating Alpha Cronbach Coefficient. All reliability coefficient values are above .70. Thus home environment scale is a reliable scale whose reliability is 0.89 and the reliability for each dimension of HES is .75, .77, .70, .72, .78, .71, .74, .73, .70, & .72 respectively.
To categorize the students into different categories with respect to their attitude towards home environment, the researchers used the stanine procedures.
References
Anastasi, A. (1987). Psychological Testing. New York: Macmillan Co.
Bandhana, & Sharma, D. (2012). A Study of Home Environment and Reasoning Ability among Secondary School Students. Developing Country Studies, 2 (1), 73-80. Retrieved from www.iiste.org. Best, J. W., & Kahn, J. V. (2010). Research in Education. New Delhi: PHI Learning Ltd.
Biel, A. (1986). Childrens Spatial Knowledge about Their Home Environment. Children's Environments
Quarterly, 3(4), 2-9.
Boyd, C. P. et al, (1997). The Family Environment Scale: Reliability and Normative Data for an Adolescent Sample. Family Process36:369-373, retrieved from https://www.researchgate.net/publication/51334514
Cohen, L., Manion, L., & Morrison, K. (2007). Research Methods in Education (6th ed.). New York: Routledge.
Cunningham, J. B., & Aldrich, J. O. (2012). Using SPSS: An Interactive Hands-On Approach. New Delhi: Sage Publications India Pvt Ltd.
Ebel, R. L., & Frisbie. (2004). Essentials of Educational Measurement. New Delhi: PHI Learning Pvt Ltd. Ferguson, G. A., & Yashio, T. (1989). Statistical Analysis in Psychology and Education. New York: McGraw
Hill Book Co.
Field, A. (2014). Discoevring Statistics using IBM SPSS Statiatics (4th ed.). New Delhi:Sage Publications India Pvt Ltd.
Garret, H. E. (1973). Statistics in Psychology and Education. Bombay Vakils: Feffer & Simons Pvt Ltd. Guilford, J. P. (1987). Psychometric Methods. New York: McGraw Hill.
Guilford, J. P., & Beryamin, F. (1946). Fundamental Statistics in Psychology and Education. Singapore: McGraw Hill Book Co.
Gupta, N., Joshi, R. & Pasbola, H. (2008). Effect of Home Environment upon Emotional Maturity among female adolescents of Joint and Nuclear Family Structure. Behavioural Scientist, 9(2): 87-92.
Kundu, G. (1975). A New Technique of Attitude Measurement. Calcutta: Annupurna Publishing House McLeod, S. A. (2008). Likert Scale. Retrieved from www.simplypsychology.org/likertscale.htm
Mishra, K. S. (1989). Manual of Home Environment Inventory. Allahabad: Ankur Psychological Agency, India.
Mishra, S., & Bamba, V. (2012). Impact of family environment on academic achievement of secondary school students in science subject. International Journal of Research in Economics & Social
Sciences, 2(5), 42-49.
Mohanraj, R and Latha (2005). Perceived family environment in relation of adjustment and academic achievement. Journal of the Indian Academy of Applied Psychology: 31(1-2): 18-23.
Thondike, R. M., & Tracy, C. T. (2011). Measurement and Evaluation in Psychology. New Delhi: PHI Learning Pvt Ltd.
Wani, M. A., & Masih, A. (2015). Facilitating Learning by linking the two Environments: Interface between Home and School through Technology. International Education Conference on Learning