ISSN 2324-805X E-ISSN 2324-8068 Published by Redfame Publishing URL: http://jets.redfame.com
Perceived Coach Attitudes and Behaviors Scale: Development and
Validation Study
Hanifi Üzüm1, Ünal Karlı1, Nuh Osman Yıldız1 1
School of Physical Education and Sport, Abant Izzet Baysal University, Bolu, Turkey
Correspondence: Hanifi Uzum, School of Physical Education and Sport, Abant Izzet Baysal University, Bolu, Turkey.
Received: February 12, 2018 Accepted: February 20, 2018 Online Published: February 24, 2018 doi:10.11114/jets.v6i3.3018 URL: https://doi.org/10.11114/jets.v6i3.3018
Abstract
The purpose of the study was to develop a scale, which will serve to determine how attitudes and behaviors of the coaches are perceived by the athletes. The scale, named as “Perceived Coach Attitudes and Behaviors Scale” (PCABS) was developed through various processes including exploratory and confirmatory factor analysis. Following the literature review process in the beginning stage, focus group interviews were conducted. As a result of literature review process and focus group interviews an item pool of 61 items was formed, and after gathering the opinions and critics of experts in the area of language and sports science, the final form of the scale was constructed. The exploratory factor analysis (EFA) on 200 athletes revealed a construct comprised of 25 items and 3 sub-dimensions. Subsequently, confirmatory factor analysis (CFA) conducted on 266 athletes confirmed the structural validity of the scale composed of 24 items and 3 sub-dimensions. The first sub-dimension named "Characteristic Features ", with an internal consistency value of 0.88, consisted of items 1, 2, 3, 4, 6, 7, 8, 9, 10, 11, 18, 20, and 23. The second sub-dimension named "Knowledge and Skills Accumulation" consisted of items 13, 14, 15, 16, 17, 19, 21, 22, and 24 had an internal consistency value of 0.86. The final sub-dimension named "Being Fair" consisted of 5th and 12th items with an internal consistency value of 0.56. Items 1, 2, 3, 4, 6, 7, 8, 9, 10, 18, 20 and 23 were reverse coded items of the scale.
As a conclusion, the analysis revealed that “Perceived Coach Attitudes and Behaviors Scale”, with its three sub-dimensions and 24 items, is a structurally valid and reliable scale, can be used to identify the athletes' perceptions about their coaches.
Keywords: coach, fairness, sufficiency, perception
1. Introduction
for constituting the notions such as the accomplishments of the athletes, team climate and communication within the organization (Smith et al. 1983, p.213).
In this context, it’s being seen that the studies intended for coach attitudes and behaviors are increasing in the literature (Tharp and Gallimore, 1976; Smith et al., 1979; Chelladurai, 1984; Kenow and Williams, 1999; Teatro, 2014). When studies that were made on coach attitudes and behaviors are examined, it’s pointed out that the majority of them are designed according to qualitative research methods. Hence this study what is aiming to develop a scale which is going to ensure measuring how attitudes and behaviors displayed by the coaches are being perceived by the athletes is considered to be important for theoretically defining those aspects, as for practically, creating a self-evaluation opportunity for coaches and sports managers. When previous works analyzed, the studies which were categorizing coach attitudes and behaviors in different magnitudes from past to present day and on different coach manners and behaviors such as coaches’ sufficiency, fairness, ethic principals and behaviors are being seen. In a study made by Gilbert and Trudel (2004), coach attitudes and behaviors were summed in 4 dimensions as “the best implementations” which are being tried by the coach (leadership style, effectiveness, general relationships), “coach behavior” (attitudes, way of decision making, informing and perception), “characteristics of the coach” (age, gender and such demographic variables) and “career development of the coach” (education, athletics background, idealism and competency). In another study conducted by Gearity (2012) ethical and unethical behaviors of the coach were investigated. In a research by Tharp and Gallimore (1976), a basketball coach was observed in practice and competition environments for more than 30 hours. In the wake of observations, approximately 2300 codes were formed. These codes were grouped under 10 categories which are expressing coach behavior styles. In consequence of the study, coach behaviors during education such as scolding, rudeness, harsh communication and encouragement were resulted to be the dominant ones. When all these studies and literature are considered, in this work as well, items and sub-dimensions of the mentioned scale which will be developed were created in the light of literature and previous researches, and it was predicted that attitudes and behavior patterns which were found in studies can be gathered in 4 dimensions as coach’s character, sufficiency, communication with the athletes and fairness. In this study which was conducted based on these four sub-dimensions, it was intended to bring a valid and reliable quantitative measurement tool into the literature to measure how displayed attitudes and behaviors of people who are coaching in team sports and individual sports are being perceived by the athletes.
2. Method
2.1 Participants and Procedures
Exploratory Factor Analysis Study Group
For EFA, data collected from a sample of 200 athletes, consisted of 95 females and 105 males, who were contestant athletes from 16 different sports branches which were categorized as team sports and individual sports.
Confirmatory Factor Analysis Study Group
In CFA stage, the sample group was composed of contestant athletes (n=266; 128 female and 138 male) from16 different team and individual sports branches. Data was collected with face-to-face interview method. Participants’ average age is 20.69 ±4.99.
2.2 Instrument and Data Collection Tool
For the creation of item pool of “Perceived Coach Attitudes and Behaviors Scale”, initially, the relevant national and international literature were thoroughly reviewed (Teatro (2014), Güven and Öncü (2012), Gearity (2012), Dolaşır Tuncel and Büyüköztürk (2009), Gilbert and Trudel (2004), Tharp and Gallimore (1976). Afterwards the literature review process, semi-structured interviews were prepared and conducted with athletes who attended the tournaments organized by the sports federations in 2017. As a result of the interviews, coach’s sufficiency, communication with the athletes, characteristics of coach and fairness emerged as important main themes.
Based on the process an item pool consisted of 61 questions were grouped under 4 sub-dimensions. For expert validity, the items were evaluated and reviewed by three academicians working in the field of Physical Education and Sport science. Following the necessary editing made by the experts, the scale was inspected by two Turkish linguists and it was finalized after required and suggested corrections. The first part of the scale was composed of demographic questions and the second part was consisted of 61 items reflecting perceived coach behaviors and attitudes. In the item evaluation 5-point likert type scale was used (Never=1 to Always=5).
2.3 Data Analysis
(KMO) measure of sampling adequacy and Bartlett’s test of Sphericity were conducted for measuring the applicability of EFA. Eigen Value and Scree Plot tests were performed for determining the significant components and deciding factorial structure of the scale.
In CFA, goodness of fit, standard loads, R2 values and t-values were checked. For testing the reliability of sub-dimensions Cronbach’s Alpha internal consistency test was conducted. Finally, Pearson Correlation analysis was used to see relationships of the sub-dimensions with each other which were procured from the scale.
3. Results
Initially, preliminary tests such as KMO and Bartlett’s Sphericity test results checked to see the adequacy of sample and suitability of the sample for conducting EFA. KMO and Bartlett’s test results are reported in Table 1.
Table 1. KMO and Bartlett’s Sphericity Test Results
When Table 1 is analyzed, it was noted that the scale’s KMO measure of sampling adequacy value is 0.88 and significance value of Bartlett’s Sphericity Test is significant, P<0.01.
Table 2. Eigenvalues and The Explained Variances
Total Variance Explained
Initial Eigenvalues Loads After Rotations
Component Total % of Variance Cumulative % Total % of Variance Cumulative %
1 16.440 28.345 15.653 8.005 32.019 22.206
2 3.212 5.537 31.169 2.311 9.245 40.655
3 2.478 4.272 37.207 1.623 6.493 47.757
4 1.849 3.188 41.343
After examining Table 2, it is observed that 25 of the analyzed items are grouped under three factors which have eigenvalues higher than 1. These three obtained factors are explaining approximately 47.757 % of the total variance. Scree plot analysis results, which show that in how many dimensions the items can be summed according to the eigenvalues, are presented at Figure 1. When the graphic is investigated, it’s seen that the optimum factor number at vertical axis that witnesses rapid declines with high momentum is three and the contributions that were brought by additional factors subsequent to three are close to each other.
Figure 1. Factor Analysis Scree Plot Graph of the Scale
Kaiser-Meyer-Olkin Measure of Sampling Adequacy 0.88
Bartlett’s Sphericity Test
Approximate Chi-Square 5772.149
Degrees of Freedom 1653
Table 3. Rotated Factor Loads
Factors
1 2 3
M22 .813
M17 .746
M2 .727
M10 .726
M18 .681
M16 .659
M15 .627
M24 .627
M3 .572
M53 .544
M9 .480
M48 .436
M60 .361
M56 .748
M57 .732
M45 .705
M38 .682
M47 .647
M61 .646
M36 .624
M37 .601
M52 .559
M40 .816
M14 .758
M27 .479
Method: Principal component analysis. Rotation Method: Varimax
When Table 3 is examined, it’s seen that the first factor consists of items (22, 17, 2, 10, 18, 16, 15, 24, 3, 53, 9, 48, 60), the second factor consists of items (56, 57, 45, 38, 47, 61, 36, 37, 52) and the third factor consists of items (40, 14, 27). For the construct validity of the scale confirmatory factor analysis was applied to the structure with 25 items and 3 factors. For confirmatory factor analysis, new data were collected by applying the re-designed scale (items ordered from 1 to 25) to 266 participants.
Table 4. The first phase and the final phase of CFA goodness of fit results
Goodness of Fit
Index Values Acceptable Fit Good Fit
Chi-Square (X2) 521,00
Degrees of Freedom 249
Chi-Square/sd 2,09 2≤ X2/sd ≤5 0≤ X2/sd≤2
RMSEA 0,06 0,05≤RMSEA ≤0,10 0≤RMSEA <0,05
SRMR 0,05 0,05≤ SRMR ≤0,10 0≤ SRMR ≤0,05
GFI 0,86 0,90≤ GFI ≤0,95 0,95≤ GFI ≤1,00
AGFI 0,83 0,85≤ AGFI ≤0,90 0,90≤ AGFI ≤1,00
CFI 0,97 0,95≤ CFI ≤0,97 0,97≤ CFI ≤1,00
NNFI 0,97 0,95≤ NNFI ≤0,97 0,97≤ NNFI ≤1,00
NFI 0,95 0,90≤ NFI ≤0,95 0,95≤ NFI ≤1,00
Table 5. Standard loads, R2 values and t values as a result of CFA
Items Standard Loads R2 t values Factor 1 M1 M2 M3 M4 M6 M7 M8 M9 M10 M11 M18 M20 M23 0,45 0,49 0,72 0,55 0,44 0,37 0,33 0,39 0,40 0,58 0,69 0,69 0,74 0,55 0,51 0,28 0,45 0,56 0,63 0,67 0,61 0,60 0,42 0,31 0,31 0,26 13,85 13,11 9,02 12,10 13,99 15,24 15,91 14,99 14,77 11,56 9,66 9,58 8,55 Factor 2 M13 M14 M15 M16 M17 M19 M21 M22 M24 0,63 0,88 0,48 0,50 0,50 0,72 0,48 0,43 0,55 0,35 0,10 0,52 0,50 0,50 0,28 0,52 0,58 0,46 10,36 5,50 13,10 12,70 12,60 8,90 13,01 13,95 11,87 Factor 3 M5 M12 0,73 0,83 0,46 0,12 5,53 4,97
On table 5, it is seen that item 14 has the highest standard load values (0,88), t values (5,50) and R2 values (0,10); and item 8 has the lowest standard load values (0,33), t values (15,91) and R2 values (0,67).
Table 6. Items comprising the sub dimensions and internal consistency values (alpha values) of the sub-dimensions
Number
of items
Alpha
values of
sub-dime
nsions
CHAR
AC
TE
R
IS
TI
C
FEA
TUR
ES
Item 1. Resorts to illegal methods for victory. Item 2. Blames the athletes in the event of failure.
Item 3. Does not make a statement to athletes in any subject Item 4. Motivates the athletes by intimidating.
Item 6. Uses his/her status for his/her own benefits. Item 7. Acts irresponsibly.
Item 8. Acts inconsistent most of the time. Item 9. Tells lies.
Item 10. Demands that the athletes act illegally for victory. Item 11. Does not respect to personal choices.
Item 18. Asks the athletes for things that they can’t do. Item 20. Resorts to violence in cases of his/her inability. Item 23. Constantly argues with the referees during competition.
13 α=0.88
KNOWLEDGE
AN
D SKILLS
AC
CU
MULA
T
ION
Item 13. Tactically solves the game well.
Item 14. Does not refrain to take risks in the game. Item 15. Cares about team work.
Item 16. Does trainings within the plan.
Item 17. Consistently follows the innovations in the field.
Item 19. It is an advantage for us that he/she comes from within the field. Item 21. Meets my expectations.
Item 22. Gives tactical instructions which I need during competition. Item 24. Improves my weaknesses during training.
9 α=0.86
BEI
NG
F
AI
R
Item 5. Gives more value to the athletes with high performance.
Item 12. Treats the athletes of opposite sex more understandingly. 2 α=0.56
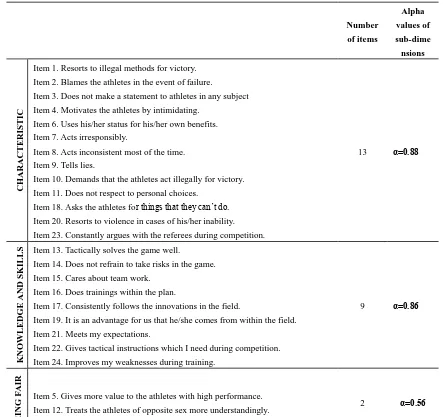
According to table 6, the first sub-dimension named as "Characteristic Features" consisted of 13 items (items 1, 2, 3, 4, 6, 7, 8, 9, 10, 11, 18, 20, and 23) with an internal consistency value of .88. The second sub-dimension entitled as "Knowledge and Skills Accumulation" consisted of 9 items (items 13, 14, 15, 16, 17, 19, 21, 22, and 24) and had an internal consistency value of .86. "Being Fair" as the third sub-dimension composed of items 5 and 12 with an internal consistency of.56. Items 1, 2, 3, 4, 6, 7, 8, 9, 10, 18, 20 and 23 were determined as reverse coded items. Turkish version of the scale can be seen in appendix part.
To measure the relationships between the sub-dimensions of the scale, Pearson Correlation Moment analysis was conducted and the results are given at Table 7.
Table 7. Relationships between the Sub-Dimensions of the Scale
Characteristic Features
Knowledge and Skills Accumulation
Being Fair
Characteristic Features 1 0,577** -0,399**
Knowledge and Skills Accumulation 1 -0,238**
Being Fair 1
** 0.01 Significance Level
and Skills Accumulation sub-dimension (r= 0,57), and a negative moderate relationship with Being Fair (r= -0,39) sub-dimension. It’s also seen that there is a negative low level relationship between Knowledge and Skills Accumulation and Being Fair (r=-0,23).
4. Discussion
In this study, a scale, which is going to be used in determination of perceived coach attitudes and behaviors by the athletes, was developed. In this part of the report, the findings gathered via statistical analysis procedures were discussed in the light of related literature.
For starters, measure of sampling adequacy test Kaiser-Meyer-Olkin (KMO) was conducted to decide the collected data’s conformity for the factor analysis. It’s seen by reviewing the literature that the closer the obtained value to 1, the more suitable is the data to perform exploratory factor analysis (Akgül and Çevik ; 2005, Bayram; 2004, Şencan; 2005, Tavşancıl; 2006, Yarar et al.; 2016). When Table 1 is checked, it’s noted that KMO measure of sampling adequacy value of the scale is 0.88. It’s observed that this value is excellent for KMO and it’s suitable to conduct analysis on related data set. Also, Bartletts’s Test of Sphericity was used to test the hypothesis of whether the correlation matrix is similar matrix or not (Akgül and Çevik, 2005). As a result of this test, the hypothesis was rejected at P<0,01 level. This conclusion shows that the data set is fit for factor analysis by revealing the relationships among the items (Table 1). After detecting the suitability of the gathered data for factor analysis, by examining the eigenvalues regarding the data at hand, it was found that the items which were processed at the final phase of the factor analysis were grouped under three factors that had eigenvalues greater than 1. These three factors are explaining approximately 47.75% of the total variance (Table 2). In spite of the belief that the higher the variance ratio, stronger the factor structure according to the respective literature, variance ratios changing between 40% to 60% are accepted for the analysis in social sciences (Tavşancıl, 2006). In light of the information, it can be said that the obtained variance is enough for the developed scale. On Figure 1, the eigenvalues scree plot graph which has the eigenvalues on vertical axis and factors on horizontal axis can be seen. By examining the graphic it can be decided that suitable number of the factors on the vertical axis which is a scene of rapid declines with high momentum is three. It’s also observed that contributions of additional factors subsequent to three are close to each other. On this basis, it is accepted that our measurement tool can be formed by three factors. As for factor loads cut-off point, it is decided as .40. Reasonableness of having .40 as factor loads cut-off point is supported by respective sources such as Akgül and Çevik, (2005), Hatcher, (1994) and Tavşancıl (2006).
After testing the suitability of the data for factor analysis and possibility for the scale to be formed by three sub-dimensions, varimax rotation test was employed with the purpose of determining which items will be under which sub-dimensions. At the first step of this factor analysis of eight phases, items 7, 8, 11, 12, 13, 25, 26, 29, 30, 31, 32, 34, 35, 39, 42, 50, 59 which were observed that the factor loads are below .40 and the values between two factor loads that were gathered at one item is under .10 were taken out of the analysis. At the second step, after varimax rotation method, items 4 and 5 were taken out because of the reason that the values between two factor loads gathered at these two items are below .10. After third rotation, item 33 was removed from the analysis as well for having value .10 between two factor loads gathered at this item. With fourth rotation, items 6, 21, 25, 28, 41, 44, and 45 were eliminated of the analysis for not conceptually having desired factor loads in accordance with the expectations of the researchers which means not fitting the theoretical structure. At fifth step, by looking at the Cronbach Alpha values of the remaining items, it was noted that the alpha value of the sub-dimension which contains items 23, 43, 54 was below .50 and these items were removed from the analysis. After removing item 49 with the varimax rotation that was done again in sixth step, one of the sub-dimensions were left with only two items, therefore this sub-dimension was canceled and items 1 and 19 were taken out of the analysis too. As a result of the exploratory factor analysis which was done with varimax rotation that was performed for the last time, the scale was appeared to be a structure with 25 items and three factors (Table 3).
and t values regarding this structure were presented at Table 5. When it’s examined it’s noticed that item 14's standard load value was the highest one (0.88), t values (5.50) and R2 values (0.10); and item 8's standard load value was the lowest one (0.33), t values (15.91) and R2 values (0.67).
It’s indicated that t value -revealing the relationship between observed variable and latent variable- will be significant at level 0.05 when it passes over 1.96 and at level 0.01 if it passes over 2.56 (Çokluk et al.; 2010 When the t values between 24 items -which were formed with this analysis- and their latent variables inspected, it’s noted that the lowest t value belongs to item 12 (4.97) and it’s over 2.56. While the standard load values show the correlation between each observed variable and related latent variable, R2 shows the strength of the relationship between the observed and latent variable (Çokluk et al., 2010; Şimşek, 2007). It can be said by checking that the standard loads and R2 values of 24 items which were subjected to analysis are in reasonable limits.
Afterwards, Cronbach’s Alpha internal consistency test was employed to all the sub-dimensions and the scale which is composed of the items in total. Cronbach’s Alpha internal consistency values of the sub-dimensions were delivered on Table 6. When the table is studied, the values were designated as for the first factor (Characteristic Features) α=0,88, for the second factor (Knowledge and Skills Accumulation) α=0,86 and for the third factor (Being Fair) α=0,56. According to George and Mallery (2003) the Alpha values were explained as “.90 and above" is excellent, ".80 and above" is good," .70 and above" is acceptable, ".60 and above" is questionable, ".50 and above" is poor and finally "below .50" is unacceptable”. Thus, when the alpha coefficients are examined, it can be said that they have good values. As for the cause of the third factor’s Alpha coefficient being lower in comparison to the other factors, having low number of questions can be shown.
Correlation values of three sub-dimensions were calculated to interpret the construct validity of those sub-dimensions which emerged in the wake of factor analysis (Table 7). As a result of this calculation, it’s seen that Characteristic Features sub-dimension has a positive moderate relationship with Knowledge and Skills Accumulation sub-dimension (r= 0,57) , and a negative moderate relationship with Being Fair (r= -0,39) sub-dimension. It’s also noted that there is a negative low level relationship between Knowledge and Skills Accumulation and Being Fair (r=-0,23). According to the outcome of this analysis, unfair behaving tendencies of the Coaches will be low if they have high knowledge and skill level and a strong personality and character, therefore we can say that the relationship between sub-dimensions is as expected.
Below are the psychometric features of the measurement tool.
On the Characteristic Features dimension, what kind of impression coaches are leaving on athletes characteristics-as a result of reflection of some of the coach’s characteristic features (blaming, self-seeking, threatening, violence, status, irresponsibility, inconsistency, miscommunication etc.) on the work life-is being measured.
On the Knowledge and Skills Accumulation dimension, how the coaches’ backgrounds of knowledge and skills (technique, tactic, planning, training etc.) about the focused coaching area are being perceived by the athletes while the coaches are practicing their profession is being evaluated.
As for the Being Fair dimension, how the fairness level of the coaches’ way of behaving to their athletes is being perceived and whether some of the specialties that the athletes have (gender, being the star athlete etc.) have an effect on the coaches’ fair behaving pattern or not are being tested.
5. Conclusion
As a conclusion, it can be said that the developed “Perceived Coach Attitudes and Behaviors Scale” is a dependable measurement tool to determine how the behaviors of coaches in team and individual sports are being perceived by the athletes within the three designated sub-dimensions. In further studies, scale items and sub-dimensions can be broadened by adding new sub-dimensions and items covering such features as leadership, goal setting, planned working, discipline etc. and a more comprehensive scale can be developed in measuring coach attitudes and behaviors.
References
Akgül, A., & Çevik, O. (2005). İstatistiksel Analiz Teknikleri, SPSS’te İşletme Yönetimi Uygulamaları. Ankara: Emek Ofset.
Allport, G. W. (1935). Attitudes in Handbook of social psychology. Edited by C. Murchison, 798–844. Worcester, MA: Clark Univ. Press.
Bayram, N. (2004). Sosyal Bilimlerde SPSS ile Veri Analizi. Bursa: Ezgi Kitapevi.
Çokluk, Ö., Şekercioğlu, G., & Büyüköztürk, Ş. (2010). Sosyal Bilimler İçin Çok Değişkenli İstatistik. Ankara: Pagem Akademi
Dolaşır, T. S., & Büyüköztürk, Ş. (2009). Antrenörlerin Mesleki Etik İlkeleri Nelerdir? Nasıl Ölçülür? Ölçek Geliştirme: Ölçeğin Geçerliliği ve Güvenirliği. Spormetre Beden Eğitimi ve Spor Bilimleri Dergisi, 7(4).
Gearity, B. T. (2012). Poor teaching by the coach: A phenomenological description from athletes' experience of poor coaching. Physical Education & Sport Pedagogy, 17(1). https://doi.org/10.1080/17408989.2010.548061
George, D., & Mallery, P. (2003). SPSS for Windows step by step: A simple guide and reference. 11.0 update (4th ed.). Boston: Allyn & Bacon.
Gilbert, W. D., & Trudel, P. (2004) Analysis of coaching science research published from 1970-2001.Research Quarterly for Exercise and Sport, 75. https://doi.org/10.1080/02701367.2004.10609172
Güven, Ö., & Öncü, E. (2012). Antrenörlerin Etik Dışı Davranışları İle İlgili Sporcu Algısı Ölçeğinin geliştirilmesi.
Spormetre Beden Eğitimi ve Spor Bilimleri Dergisi, 10(2).
Hatcher, L. (1994). A Step-by-Step Approach to Using The SAS (R) System for Factor Analysis and Structural Equation Modeling. Cary, NC: SAS Institute.
Karakoç, Ö., Yüksek, S., Aydın, A. D., Karakoç, B., Yetiş, Ü., & Baydil B. (2011). Milli Takım Düzeyindeki Erkek Judocuların Kulüp Antrenörlerinde Gözlemledikleri Etik Dışı Davranışlar, Kastamonu Eğitim Dergisi, 19(1). Kenow, L., & Williams, J. M. (1999). Coach-athlete compatibility and athlete's perception of coaching behaviors.
Journal of Sport Behavior, 22.
Şencan, H. (2005). Sosyal ve Davranışsal Ölçümlerde Güvenilirlik ve Geçerlilik. Seçkin Yayıncılık, Ankara.
Şimşek, Ö. F. (2007).Yapısal Eşitlik Modellemesine Giriş: Temel İlkeler ve LISREL Uygulamaları. Ankara: Ekinoks Yayınları.
Smith, R. E., Smoll, F. L., & Curtis, B. (1979). Coach effectiveness training: A cognitive behavioral-approach to enhancing relationship skills in youth sport coaches. Journal of Sport Psychology, 1. https://doi.org/10.1123/jsp.1.1.59
Smith, R. E., Zane, N. W. S., Smoll, F. L., & Coppel, D. B. (1983). Behavioral assessment in youth sports: Coaching behaviors and children’s attitudes. Medicine and Science in Sport and Exercise, 15. https://doi.org/10.1249/00005768-198315030-00005
Tavşancıl, E. (2014). Tutumların Ölçülmesi ve SPSS ile Veri Analizi. Ankara: 3. Baskı, Nobel Yayınları, 2006.
Teatro, C. Coaching Efficacy and Stakeholders‘ Perceptions of Coaches: Relationships with National Coaching
Standards, A Dissertation Presented in Partial Fulfillment of the Requirements for the Degree Doctor of Philosophy, Arızona State Unıversıty.
Tharp, R. G., & Gallimore, R. (1976). Basketballs John Wooden: What a coach can teach a teacher. Psychology Today,
9(8).
Yarar, H., Eroğlu, H., Uzum, H., & Polat, E. (2016). Sporcu Kilo Düşme Yöntemleri ve Etkileri Ölçeği: Geçerlik ve güvenirlik çalışması. Journal of Human Sciences,13(3). https://doi.org/10.14687/jhs.v13i3.4212
Appendix
Turkish Version of Scale
Karakteristik Özellikler Boyutu
Madde 1. Galibiyet için yasal olmayan yöntemlere başvurur. Madde 2. Başarısızlık durumunda sporcuları suçlar.
Madde 3. Sporculara herhangi bir konuda açıklama yapmaz. Madde 4. Sporcuları tehdit ederek motive eder.
Madde 6. Kendi çıkarları için statüsünü kullanır. Madde 7. Sorumsuzca davranır.
Madde 8. Çoğu zaman tutarsız davranır. Madde 9. Yalan söyler.
Madde 11. Kişisel tercihlere saygı duymaz
Madde 18. Sporculardan yapamayacağı şeyler ister. Madde 20. Yetersiz kaldığı durumlarda şiddete başvurur. Madde 23. Müsabaka esnasında hakemlerle sürekli tartışır. Bilgi ve Beceri Birikimi
Madde 13. Taktiksel olarak oyunu iyi çözer. Madde 14. Oyun içerisinde risk almaktan kaçınmaz. Madde 15. Takım çalışmasına önem verir.
Madde 16. Antrenmanları plan dahilinde yapar. Madde 17. Alandaki yenilikleri sürekli takip eder. Madde 19. Alan içinden gelmesi bizim için bir avantajdır. Madde 21. Beklentilerimi karşılar.
Madde 22. Müsabaka esnasında ihtiyacım olan taktikleri verir. Madde 24. Antrenman esnasında eksik yönlerimi geliştirir. Adaletli Olma
Madde 5.Performansı yüksek olan sporculara daha fazla değer verir. Madde 12. Karşı cinsten sporculara daha anlayışlı davranır.
Copyrights
Copyright for this article is retained by the author(s), with first publication rights granted to the journal.