An approach to Enhance Automatic Diagnosis of
Diabetic Retinopathy and Classification by Hybrid
Multilayer Feed forward Neural Networks by
Genetic Algorithm
Rupa V. Lichode
M. Tech ( Computer Science and Engineering )
Department of Computer Technology
R.C.E.R.T. Chandrapur, Maharastra, India
ABSTRACT-
For a particularly long time, Automatic diagnosis of diabetic retinopathy from digital fundus images has been an active research topic in the medical image processing community. This paper describes what is the diagnosis of Diabetic Retinopathy by various image processing techniquesand how proposed work can be help to enhace it further. In the beginning section introduction provides the terminology related to DR like fundus images with different types of stages in Diabetic Retinopathy as NPDR( Non Proliferative DR) and PDR( Proliferative DR) levels. Further sections describes different features extraction of Fundus images like exudates, microaneurysms, optic Disc, macula, blood vessels, texture properties like entropy ect. as a responsible parameters for DR with image processing. Brief description of Genetic algorithm and Multilayer feed forward neural network is given. Next section describes how proposed algorithm for classification of Diabetic retinopathy on feature vector can be applicable to train the artificial neural network. This elaborates how Genetic algorithm can be utilized on the training dataset of multilayer feed forward Neural Network . Last section covers the comparing the proposed algorithm with present algorithm to enhance further to expect better results. Finally conclusion on rework and references are included with their reference numbers.1. INTRODUCTION
Diabetes has become one of the rapidly increasing health threats worldwide [21]. Proper and early treatment of diabetes is cost effective since the implications of poor or late treatment are very expensive. Fundus imaging has an important role in diabetes monitoring since occurrences of retinal abnormalities are common and their consequences serious. However, since the eye fundus is sensitive to
vascular diseases, fundus imaging is also considered as a candidate for non-invasive screening. The success of this type of screening approach depends on accurate fundus image capture, and especially on accurate and reliable image processing algorithms for detecting the abnormalities. Numerous algorithms have been proposed for fundus image analysis by many research groups [13, 6, 9, 15, 18]. However, it is impossible to judge the accuracy and reliability of the approaches because there exists no commonly accepted and representative fundus image database and evaluation protocol.
In the type 1 diabetes, the insulin production in the pancreas is permanently damaged, whereas in the type 2 diabetes, the person is suffering from increased resistance to insulin. The type 2 diabetes is a familial disease, but also related to limited physical activity and lifestyle [21]. The diabetes may cause abnormalities in the retina (diabetic retinopathy), kidneys (diabetic nephropathy), and nervous system (diabetic neuropathy) [14]. The diabetes is also a major risk factor in cardiovascular diseases [14].
The diabetic retinopathy is a micro vascular complication of diabetes, causing abnormalities in the retina, and in the worst case, blindness. Typically there are no salient symptoms in the early stages of diabetic retinopathy, but the number and severity predominantly increase during the time. The diabetic retinopathy typically begins as small changes in the retinal capillaries. The first detectable abnormalities are mircroaneurysms (Ma) (Fig. 2.1(a)) which are local distensions of the retinal capillary and which cause intra retinal hemorrhage (H) (Fig. 2.1(b)) when ruptured. The disease severity is classified as mild non-proliferative diabetic retinopathy when the first apparent microaneurysms appear in the retina [19]. In time, the retinal edema and hard exudates (He) (Fig. 2.1(c)) are followed by the increased permeability of the capillary walls. The hard exudates are lipid formations leaking from
these weakened blood vessels. This state of the retinopathy is called moderate non-proliferative diabetic retinopathy [19]. However, if the above-mentioned abnormalities appear in the central vision area (macula), it is called diabetic maculopathy [21]. As the retinopathy advances, the blood vessels become obstructed which causes micro infarcts in the retina. These micro infarcts are called soft exudates (Se) (Fig. 2.1(d)). When a significant number of intra retinal hemorrhages, soft exudates, or intra retinal micro-vascular abnormalities are encountered, the state of the retinopathy is defined as severe non-proliferative diabetic retinopathy [19].
The severe non-proliferative diabetic retinopathy can quickly turn into proliferative diabetic retinopathy when extensive lack of oxygen causes the development of new fragile vessels [19]. This is called as neo-vascularisation (Fig. 2.1(e)) which is a serious eye sight threatening state. The proliferative diabetic retinopathy may cause sudden loss in visual acuity or even a permanent blindness due to vitreous hemorrhage or tractional detachment of the central retina. After diagnosis of diabetic retinopathy, regular monitoring is needed due to the progressive nature of the disease. However, broad screenings cannot be performed due to the fact that the fundus image examination requires attention of medical experts. For the screening, automatic image processing methods must be developed.
(a) (b)
(c) (d)
(e) Figure 2.1
Figure 2.1:Abnormal findings in the eye fundus caused by the diabetic retinopathy: (a) microaneuryms (marked with an arrow), (b) hemorrhages, (c) hard exudates, (d) soft exudate (marked with an arrow), and (e) neovascularization.
2.1 Current evaluation practices
In medical diagnosis, the medical input data is usually classified into two classes, where the disease is either present or absent. The classification accuracy of the diagnosis is assessed using the sensitivity and specificity measures. Following the practises in the medical research, the fundus images related to the diabetic retinopathy are evaluated by using sensitivity and specificity per image basis. Sensitivity is the percentage of abnormal funduses classified as abnormal, and specificity is the percentage of normal fundus classified as normal by the screening. The higher the sensitivity and specificity values, the better the diagnosis. Sensitivity and specificity can be computed as [22]:
Sensitivity (SN) = TP/TP + FN,
Specificity (SP) = TN/TN + FP (1) where TP is the number of abnormal fundus images found as abnormal, T N is the number of normal fundus images found as normal, FP is the number of normal fundus images found as abnormal (false positives) and FN is the number of abnormal fundus images found as normal (false negatives). Sensitivity and specificity are also referred to as the true positive rate (TPR) and true negative rate (TNR), respectively.
2.2 Automatic methods
As mentioned previously, the diagnosis of diabetic retinopathy can be divided into the following two categories:
1. Screening of the diabetic retinopathy 2. Monitoring of the diabetic retinopathy
Most automatic systems approach the detection directly using shape, color, and domain knowledge of diabetic retinopathy findings, but the abnormalities can also be found indirectly
by detecting changes between two fundus images taken from the same eye in different time moment [11, 17]. The direct approach contributes to screening of the disease, where indirect approach contributes to both screening and monitoring of the diabetic retinopathy. Both approaches use roughly the following stages for finding abnormalities in fundus images: 1) image enhancement 2) candidate diabetic retinopathy finding detection 3) classification to correct diabetic retinopathy category (or hypothesis rejection).
The automatic methods either use the vital domain information provided by the normal fundus parts or remove them due to their similar color and shape appearance with abnormal fundus findings.
3. PROPOSED ALGORITHM
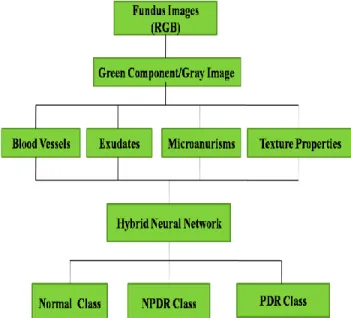
Proposed algorithm for the enhancement of DR is given as below in figure 3.1
Step 1. Input Fundus Image
Step 2. Various Feature Extraction by applying image processing Tools.
Step 3. Creation of feature vector of input image Step 4. Classification with HybridMLFFNN
Figure 3.1 Proposed system for Automatic DR
3.1 Hybrid Multi Layer Feed Forward Neural Network
Hybridization of HybridMLFFNN is be done by two step learning process can be called as Neural-genetic network
learning algorithm is as in figure below
First learning stage ( Proposed Step):- Genetic Algorithm
1. Initialize a population of chromosomes
2. Calculate the fitness value for each chromosome according to Mean square function objective function (MSE)
3. Apply crossover and mutation to produce new chromosome
4. Replace new generation as current generation 5. Stop first learning stage
Second learning stage:-
Multilayer Feed forward neural network[24][25]
Set the best chromosomes (obtained from GA) as the initial weight and bias vector.
Apply this best set of chromosomes as a optimized weight and bias to train the multilayer feed forward neural network.
3.2 Training of ANN
The ANN is a feed-forward back propagation network and uses supervised learning to train the neural network. Supervised learning is by providing the ANN with input data and matches them with output results. Its weights would adjust according to its learning rules as it undergoes training before being tested for accuracy. The ANN used for classification in this project as shown in the figure 3.2 below.
Figure 3.2 Four-layer feed-forward neural network
classifier
The input layer is made up of nodes to accept the 5 data values while the subsequent layers process the values using activation function. There are 10 neurons for each “hidden layer” and the trained network would output binary numbers which represent the different stages.
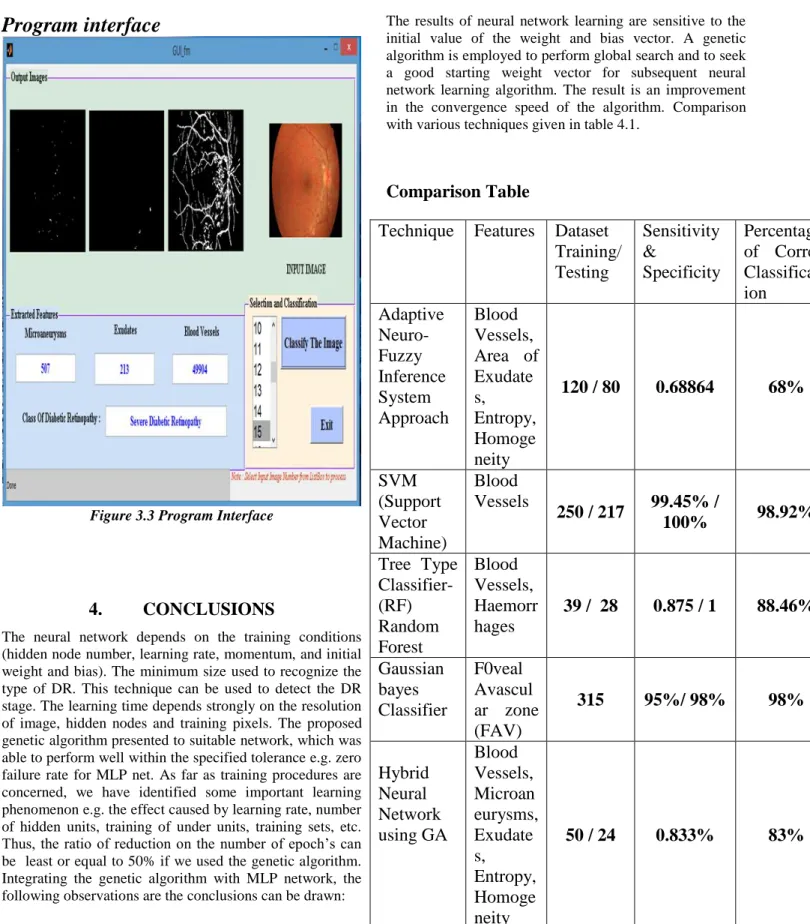
Program interface
Figure 3.3 Program Interface
4.
CONCLUSIONS
The neural network depends on the training conditions (hidden node number, learning rate, momentum, and initial weight and bias). The minimum size used to recognize the type of DR. This technique can be used to detect the DR stage. The learning time depends strongly on the resolution of image, hidden nodes and training pixels. The proposed genetic algorithm presented to suitable network, which was able to perform well within the specified tolerance e.g. zero failure rate for MLP net. As far as training procedures are concerned, we have identified some important learning phenomenon e.g. the effect caused by learning rate, number of hidden units, training of under units, training sets, etc. Thus, the ratio of reduction on the number of epoch‟s can be least or equal to 50% if we used the genetic algorithm. Integrating the genetic algorithm with MLP network, the following observations are the conclusions can be drawn:
The results of neural network learning are sensitive to the initial value of the weight and bias vector. A genetic algorithm is employed to perform global search and to seek a good starting weight vector for subsequent neural network learning algorithm. The result is an improvement in the convergence speed of the algorithm. Comparison with various techniques given in table 4.1.
Comparison Table
Technique Features Dataset
Training/
Testing
Sensitivity
&
Specificity
Percentage
of Correct
Classificat-ion
Adaptive
Neuro-Fuzzy
Inference
System
Approach
Blood
Vessels,
Area of
Exudate
s,
Entropy,
Homoge
neity
120 / 80
0.68864
68%
SVM
(Support
Vector
Machine)
Blood
Vessels
250 / 217
99.45% /
100%
98.92%
Tree Type
Classifier-(RF)
Random
Forest
Blood
Vessels,
Haemorr
hages
39 / 28
0.875 / 1
88.46%
Gaussian
bayes
Classifier
F0veal
Avascul
ar zone
(FAV)
315
95%/ 98%
98%
Hybrid
Neural
Network
using GA
Blood
Vessels,
Microan
eurysms,
Exudate
s,
Entropy,
Homoge
neity
50 / 24
0.833%
83%
5.
REFERENCES
[1] Kanika Verma, Prakash Deep and A. G. Ramakrishnan, “Detection and Classification of Diabetic Retinopathy using Retinal Images”, India Conference (INDICON), 2011 Annual IEEE ,(3),1-6,December 2011
[2] Arturo Aquino*, Manuel Emilio Gegúndez-Arias, and Diego Marín “Detecting the Optic Disc Boundary in Digital Fundus Images Using Morphological, Edge Detection, and Feature Extraction Techniques”, IEEE TRANSACTIONS ON MEDICAL IMAGING, 29(3 ), 11, NOVEMBER 2010
[3] Fatma Demirezen Yagmur, Bekir Karlık, Ali Okata, Automatic „Recognition of Retinopathy Diseases by Using Wavelet Based Neural Network”, Applications of Digital Information and Web Technologies, 2008. ICADIWT 2008.,1(3), 4-6Aug.2008
[4]T. Ashok Kumar, S. Priya, Varghese Paul, “Automatic Feature Detection in Human Retinal Imagery using Bitplane Slicing and Mathematical Morphology”, European Journal of Scientific Research, ISSN 1450-216X Vol.80 No.1(3):57-67, 2012
[5]Ahmad Fadzil M. Hani, Senior Member, IEEE, Nor Fariza Ngah, Tara M. George, Lila I. Izhar, Hermawan Nugroho, and Hanung Adi Nugroho “Analysis of Foveal Avascular Zone in Colour Fundus Images for Grading of Diabetic Retinopathy Severity”, 32nd Annual International Conference of the IEEE EMBS, 32(6):5632-5635,Aug.2010
[6] Alan D. Fleming, Sam Philip, Keith A. Goatman, John A. Olson, and Peter F. Sharp. “Automated microaneurysm detection using local contrast normalization and local vessel detection”. IEEE Transactions in Medical Imaging, 25(9):1223–1232, September 2006.
[7] Xiaohui Zhang and O. Chutatape. “Detection and classification of bright lesions in colour fundus images”. In Proceedings of IEEE Internationl Confrence on Image Processing (ICIP), volume 1, pages 139–142, October 2004. 18
[8] Wynne Hsu, P. M. D. S Pallawa, M. Li Lee, and Au Eong K.-G. “The role of domain knowledege in the detection of retinal hard exudates”. In Proc. of the IEEE Conference on Computer Vision and Pattern Recognition (CVPR), volume 2, pages 246–251, Kauai, Hi, USA, December 2001.
[9] Xiaohoui Zhang and Opas Chutape. “A SVM approach for detection of hemorrhages in background diabetic retinopathy”. In Proceedings of International Joint Confrence on Neural Networks, pages 2435–2440, Montreal and Canada, July 2005.
[10]Xiaohoui Zhang and Opas Chutape. “Top-down and bottom-up strategies in lesion deection of background diabetic retinpathy”. In Proc. of the IEEE Conf. on
Computer Vision and Pattern Recognition (CVPR), volume 2, pages 422–428, San diego, CA, USA, July 2005.
[11]Harihar Narasimha-Iyer, Ali Can, Bandrinath Roysam, Charles V. Stewart, Howard L.Tanenbau, Anna Majerovics, and Hanumant Singh. “Robust detection and classfication of longitudinal changes in color retinalfundus images for monitoring diabetic retinopathy”. IEEE Transactions on Biomedical Engineering, 53(6):1084–1098, June 2006.
[12]M. Niemeijer, M. D Abr`amoff, and B. van Ginneken. “Automatic detection of the presence of bright lesions in color fundus photographs”. In Proceedings of IFMBE the 3rd European Medical and Biological Engineering Confrence, volume 11 of 1, pages 1823–2839, Prague and Czech republic, November 2005.
[13]M. Niemeijer, B. van Ginneken, J. Staal, M. S. A. Suttorp-Schulten, and N. D. Abramoff. “Automatic detection of red lesion in digital color fundus photographs‟. IEEE Transactions on Medical Imaging, 24(5):584–592, May 2005.
[14]M. Niemi and K. Winell. „Diabetes in Finland, prevalence and variation in quality of care”. Kirjapaino Hermes Oy Tampre, Finland, 2006.
[15]Alireza Osareh, Majid Mirmehdi, Barry Thomas, and Richard Markham. “Classification and localization of diabetic-related eye disease”. In Proc. of 7th European Conference on Computer Vision (ECCV), pages 502– 516, 2002.
[16]P.J. Phillips, H. Moon, S.A. Rizvi, and P.J. Rauss. “The FERET evaluation methodology for face-recognition algorithms”. IEEE Trans. on Pattern Analysis and Machine Intelligence, 22(10), 2000.
[17]Richard J. Radke, Srinivas Andra, Omar Al-Kofahi, and Badrinath Roysam. “Image change detection algorithms: a systematic survey”. IEEE Transactions on Image Processing, 14(3):294–307, March 2005.
[18]C. I. S`anchez, R. Hornero, M. I .L`opez, and J. Poza. “Retinal image analysis to detect and quantify lesions associated with diabetic retinopathy”. In Proceedings of the 26th Annual International Confrence of the IEEE Engineering in Medicine and Biology Society (EMBS), pages 1624–1627, San Francisco, CA, USA, September 2004.
[19]C. P. Wilkinson, Frederick L. Ferris, Ronald E. Klein, Paul P. Lee, Carl David Agardh, Matthew Davis, Diana Dills, Anselm Kampik, R. Pararajasegaram, and Juan T. Verdaguer. “Proposed international clinical diabetic retinopathy and diabetic macular edema disease severity scales ophthalmology”, 10(9):1677–1682, September 2003.
[20]C. Sinthayothin, J. F. Boyce, T. H. Williamson, E. Mensah, S.Lal, and D. “User Automated detection of
diabetic retinopathy on digital fundus images”. Diabetic Medicine, 19:105–112, 2002.
[21]Gunvor von Wendt. “Screening for diabetic retinopathy: Aspects of photographic methods”. PhD thesis, Karolinska Institutet, 2005.
[22]T. Walter, J.-C. Klein, P. Massin, and A. Erginay. “A contribution of image processing to the diagnosis of diabetic retinopathy - detection of exudates in color fundus images of the human retina”. IEEE Transactions on Medical Imaging, 21:1236–1243, October 2002. [23]Huan Wang, Wynne Hsu, Kheng Guan Goh, and Mong
Li Lee. “An effective approach to detect lesions in color retinal images.” In Proc. of the IEEE Conf. on Computer Vision and Pattern Recognition (CVPR), pages 181–186, 2000.
[24]Majida Ali Abed , Ahmad Nasser Ismail and Zubadi Matiz Hazi “Pattern recognition Using Genetic Algorithm” International Journal of Computer and
Electrical Engineering, Vol. 2, No. 3, June, 2010 1793-8163 pg 583-589
[25]Yas Abbas Alsultanny∗, Musbah M. Aqel “Pattern recognition using multilayer neural-genetic algorithm” Neurocomputing 51 (2003) 237 – 247.
Author: Rupatai V. Lichode a Assistant professor in Rajiv Gandhi college of Engineering research and technology, Chandrapur Maharashtra. She has been teaching for decades. She is a Life Members of various technical societies like ISTE, IE ect. She has published and presented number of papers in various national, International conferences and journals. Her area of interests are Programming, Data Structure, Algorithms, Computational Theory, Digital Image processing, Operating System and many more.