Int. J. Data Envelopment Analysis (ISSN 2345-458X)
Vol.5, No.1, Year 2017 Article ID IJDEA-00422, 12 pages Research Article
Robust Optimization and Confidence Interval
DEA for Efficiency Evaluation with Intervals
Case Study: Evaluating CRM Units in a Call
Center in Tehran
Shabnam Mohammadi
a*, Mohammad Jafar Tarokh
b, Emran Mohammadi
c(a)
MSc. Student in E-Commerce, Industrial Engineering, K.N Toosi University,
Tehran, Iran
(b)
Associated Prof, IT Group, Industrial Engineering, K.N Toosi University,
Tehran, Iran
(c)
Associated Prof, Industrial Engineering, Iran University of Science &
Technology, Tehran, Iran
Received August 15, 2016, Accepted November 25, 2106
Abstract
Volatility and uncertainty of the real world is inevitable. Changes in input and output units make the loss of confidence in the results obtained from the performance assessment. To overcome this problem robust optimization suggested.in previous studies, measuring of interval efficiency were calculated based on optimistic viewpoint and pessimistic view point, while we believe that this approach ignores the frequency distribution that could affect ranking of DMUs. In present study, we try using Interval estimation of the mean, to Increase the confidence of efficiency by considering scattered data. At the end, we compare the obtained result of confidence interval DEA and robust DEA (RDEA) ranking in, terms of uncertainty.
Keywords: interval data, DEA, robust optimization, CRM.
*. Corresponding author, Email address: [email protected]
1156
1. Introduction
Data envelopment analysis (DEA) initiated by Charnes, Cooper and Rhodes (CCR) and extended by Banker, Charnes, & Cooper (BCC), is a useful method to evaluate relative efficiency of multiple-inputs and multiple-outputs units based on observed data [12]. DEA is used to establish a best practice group from among a set of observed units and to identify the units that are inefficient when compared to the best practice group. DEA also indicates the magnitude of the inefficiencies and improvements possible for the inefficient units [23]. DEA is a non-parametric frontier estimation methodology based on linear programming for measuring relative efficiencies of a collection of functionally similar firms or entities in transforming their inputs into outputs [4].
The beauty of data envelopment analysis model is that it requires no determination of weights by experts and their opinions, and evaluation of its performance is based solely on data [23].
DEA model, based on real data and resulting in real adjustments to the revenues of the regulated firms, are occasionally faced by the firms on the grounds that data either is imprecise for all or part of the reference set [17]. DEA is characterized by each DMU’s ability to select its most favorable weight, and evaluate its relative efficiency among DMUs [6]. The DEA formulation is given as follows in (1). Suppose that there is a set of n DMUs to be analyzed, each of which uses m common inputs and s common outputs. Let k (k=1... n) denote the DMU whose relative efficiency or productivity is to be maximized [24].
Maximize hk =
∑𝑠𝑟 = 1 𝑢𝑟𝑘 𝑌𝑟𝑘 ∑𝑚𝑖 =1 𝑉𝑖𝑘 𝑋𝑖𝑘
Subject to ∑ 𝑢𝑟 𝑌𝑟𝑗
𝑠 𝑟 =1 ∑𝑚𝑖=1 𝑉𝑖𝑘 𝑋𝑖𝑗
≤ 1 (1)
𝑢𝑟 𝑣𝑖 ≥ 0
i = 1, 2,… m r = 1, 2,…, s j = 1, 2,…, n
Entani in [8] modeled the relationship between DEA and IDE based on interval data. Wu [23] used TOPSIS method and DEA to ranking DMUs. Yousefi [25] proposed a developed DEA model and compare with MCDM method and result represented that proposed method is more reliable than TOPSIS and AHP. Chang [5] evaluated efficiency of DMUs by using BCC and CCR model on multiple increasing, decreasing or constant data. Wanke [22] represented a two stage DEA model to evaluate Brazilian banks using Cost efficiency and production efficiency, and also Central Performance DEA network model is used to improve the effectiveness of both steps. Soleimani [19] represented a methodology based on Shannon's entropy to mix results of different DEA models and gain complete ranking. Result suggested ranking methods using AHP. The DEA approach used in the literature has been under some serious criticism where a small perturbation could make a big change on the ranking [15]. Volatility and uncertainty of the real world is an integral part. Changes in input and output units make the loss of confidence in the results obtained from the performance assessment. So in most cases we face with imprecise data. To overcome this problem and increase the confidence in the results of the performance, interval data envelopment analysis and robust optimization is suggested, so the methodology of this paper is as follows: in section2, interval DEA and ranking methods, in section 3, robust DEA model are described. Then in section 4, case study is introduced and numerical results based DMUs are discussed. With respect of interval results, in section 5, DMUs are scored and finally in section 6, final notes are discussed based RIDEA model.
2. Interval DEA and Ranking methods
1157 Programming (LP) problem using scale transformations to obtain the precise efficiency estimates. Since 1999, interest for interval DEA models, has been increased [17]. The term 'imprecise data' reflects the situations where some of the input and output data are only reported within bounded intervals (interval number) while other data are known by definite values. Haghighat et al. [9] classified DMUs in three groups based on upper and lower bounds of efficiency scores. Smirlis et al. [18] proposed an interval DEA method for the case of missing values in the data set. Toloo et al. [21] proposed a prescriptive framework for analyzing and measuring overall profit efficiency with interval data, this framework can be applied to measure the effectiveness of DMUs in achieving behavioral or organization objectives relative to other DMUs and also fuzzy data. Hatami-Marbiniet et al. [10] proposed a comprehensive evaluation process for measuring the relative efficiencies of a set of DMUs in DEA. In their formulation, the intervals contain upper or lower bounds with different signs Hosseinzadeh Lotfi et al. [11] has proposed a method for ranking DMUs in different classes by intervals. Emrouznejad has proposed a general and multiplicative non-parametric ratio models for DEA problems with interval data [7]. A similar study was conducted by Jahanshahloo et al. [12] to evaluated efficiency of DMUs based on interval data. In this study data are interval and includes upper bound and lower bound
xij ϵ [xijL, xijU] , yijϵ [yijL, yijU]
Suppose there are n DMUs, where each DMU j (j∈J, J={1, … , 𝑛}) consumes m inputs 𝑋𝑗𝑇 = (𝑥1𝑗, … 𝑥𝑚𝑗) to produce s
outputs 𝑌𝑗𝑇 = (𝑦1𝑗, … 𝑦𝑠𝑗). Assume Yj ≥ 0,
Xj ≥ 0, Yj ≠0, Xj≠0.The upper limit of interval efficiency is obtained from the optimistic viewpoint and the lower limit is obtained from the pessimistic viewpoint.
The following model provides such an upper bound for DMU jo:
ℎ𝑗𝐿0 = max ∑𝑠𝑟=1𝑢𝑟𝑦𝑟𝑗0 𝐿
s.t. ∑𝑚𝑖=1𝑣𝑖𝑥𝐼𝑗𝑈0 = 1,
∑𝑠𝑟=1 𝑢𝑟𝑦𝑟𝑗0
𝑈 – ∑ 𝑣 𝑖 𝑚
𝑖=1 𝑥𝑖𝑗0
𝐿 ≤ 0, (2)
∑𝑠𝑟=1 𝑢𝑟𝑦𝑟𝑗𝐿 – ∑𝑚𝑖=1𝑣𝑖𝑥𝑖𝑗 𝑈 ≤ 0,
j = 1,…,n, j≠ j0 ,
Ur, vi ≥ ɛ, r = 1… s i= 1,…,m.
We denote by ℎ𝑗0𝑈 the efficiency score attained by DMU jo .The model below provides a lower bound of the efficiency score for DMU jo:
ℎ𝑗𝑈0 = max ∑𝑠𝑟=1 𝑢𝑟𝑦𝑟𝑗0 𝑈
s.t. ∑𝑚𝑖=1 𝑣𝑖𝑥𝐼𝑗0
𝐿 = 1, (3)
∑𝑠𝑟=1 𝑢𝑟𝑦𝑟𝑗0
𝑈 – ∑ 𝑣 𝑖 𝑚
𝑖=1 𝑥𝑖𝑗𝐿0 ≤ 0,
∑𝑠𝑟=1 𝑢𝑟𝑦𝑟𝑗𝐿 – ∑𝑚𝑖=1 𝑣𝑖𝑥𝑖𝑗𝑈 ≤ 0,
j = 1,…,n, j≠ j0 ,
Ur, vi ≥ ɛ , i = 1,…,s r = 1… m.
As noted before confidence interval is used instead of optimistic viewpoint and pessimistic viewpoint to consider frequency distribution. Interval estimation of the mean is used to increase confidence in the calculation results of interval estimation performance of the DMUs. In addition the Interval estimation of the mean has the following advantages:
1. Confidence is controlled by a manager or analyst
2. Scattering data is considered and then make distance.
3. with increasing sample size, shorter range and higher reliability.
In order to reduce the estimation error, interval estimation calculated with 95% confidence. If the population distribution is unknown but the sample size is large, by using (4), an interval estimation with certainty a 100% (1-α) for the parameter μ, can be performed is Sample standard deviation, α is significant level.
𝑋̅ – 𝑧 1−∝ 2,
𝑆
√𝑛 < µ < 𝑋̅ + 𝑧 1−∝2 𝑆
1158 One of the difficulties in the interval approach is the evaluation of the lower and upper bounds of the relative efficiencies of the DMUs [17].
Sengupta's approach: Interval B is alternatively represented as B =〈m(B), w(B)〉, where m (B) and w (B) are the mid-point and half-width of interval B, m (B) = 1
2 (b l
+bu), w (B) = 1
2 (b u
–bl). After this representation, Sengupta and Pal introduced the acceptability function to compare two interval numbers A and B as follows: A (<) = m (B)− m (A)
w (B) + w (A) . A (<) may be
interpreted as the "first interval to be inferior to the second interval''. Here the term `inferior to' (`superior to') is analogous to `less than' (`greater than'). Decision Maker can decide to select one of the two interval numbers (for maximizing or minimizing) by the value of A (<).This procedure states that between two interval numbers with the same mid-point,the less uncertain interval will be the best choice for both of maximization and minimization [13].
The degree of acceptability A<B Can be based on the relative position of the mean and width of the interval B compared to the average and between width of interval A divided as follows :
= 0 if m (A) = m (B) (5) (A< B) > 0, <1 if aR > bL, m (A) < m(B)
≥ 1 if aR ≤ bL, m (A) < m(B)
So Sengupta's approach is selected in this research for evaluating interval results.
3. The Robust DEA Model
One of the assumptions of classical planning in terms of mathematical certainty is that all parameters are completely certain because most of the parameters in the prediction and measurement are associated with uncertainty. Classical modeling approaches in operation research under uncertainty consider a full probabilistic characterization. In fact, in many models the uncertainty is ignored altogether, and a
representative nominal value of the data is used [16]. Robust DEA models and their application are used for stock performance evaluation by Peykani [14] one way to avoid the damage caused by lack of attention to the issue of uncertainty, is using of flexible models to impose uncertainty. Optimization model with controller parameters of conservative as a robust approach is one of the most powerful and flexible model in the field.
The first research in robust firm was presented in the early seventies by Soyster 20] in the form of a linear optimization model that gives us Good answers for all incoming data, as each input can take any value from the interval. This approach tends to find the answers that are more conservative. This approach tends to find the answers that are more conservative. This means that to ensure consistent replies in this approach, face away from the optimality problem too much. Ben- Tal and Nemirovski [1] assuming elliptical data sets with uncertainties, presented efficient algorithms for solving convex optimization problems under uncertainty data. However, given that the robust formulations were derived from quadratic cone Issues, These methods cannot be directly used for discrete optimization problems. Bertsimas and Sim [2] introduced different approach to control the level of conservatism; this approach has the advantage that leads to a linear optimization model and also be applicable on discrete optimization models.
So in conclusion we can say, three main approaches have been proposed by researchers based robust optimization that they are Soyster robust optimization, Ben-tal and Nemirivski [1] robust optimization approach and Bertsimas and Sim [2] robust optimization approach.
1159 approach leads to quadratic and conic - based formulations and as result this approach can not directly be used for discrete optimization problems, while Bertsimas & Sim approach in addition to the ability to control the level of conservatism, leading to a linear optimization model and is also applicable to discrete optimization models.
Due to this feature, Bertsimas & Sim approach in order to design a model based on data envelopment analysis in this study is used.
It is assumed that the uncertainty, are considered in the constraints and objective functions.
Uncertainty intervals are defined as follows: Each of the coefficients of the constraints N= {1,2, …, n}jϵ ،aij is as a random variable
independent and symmetrical distribution but unknown (âij(. ãij Represents the
deviation from the nominal rate of
aij .so ãij is in [ aij _âij , aij+ âij]. Each of
the coefficients of the objective function is in [cj _dj , cj+ dij], that dj represents
deviation from the nominal rate of cj. Bertsimas &Sim define Γi parameter for each constraint, that is not necessarily an integer and its value is in the interval
[0, n]. the role of this parameter is adjusting of robustness. IfΓi=n, Constraint i is the highest level of protection against uncertainty. It should be noted that if e is the deviation of the data, can show dj and
âij based on e, as dj =ecj and eaij =âij.
Bertsimas & Sim Linear programming model is as follows (Bertsimas &Sim, 2003): [2]
Minc'x + z0 Γ0 + ∑𝑗𝜖𝐽 𝑝0j (6)
S.to. ∑ 𝑎𝑗 ijxj + zi Γi + ∑𝑗𝜖𝐽 𝑝ij ≤ bi
Z0 + p 0j ≥ dj yj ∀i,j 𝜖 Ji
Zi + pij ≥ 𝑎̂𝑖𝑗 yj ∀i ≠ 0, j 𝜖 Jj
–yj ≤ xj ≤ yj ∀j xj≥ 0
pij,yj , zi ≥ 0 ∀i,j
Zi + pij ≥ 𝑒 𝑎𝑖𝑗 yj
4. Case Study and Numerical Results
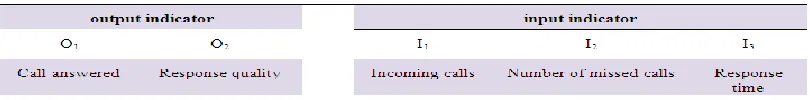
Changes in input and output units make the loss of confidence in the results obtained from the performance assessment. Units that may be reported in terms of effective and ineffective in other circumstances arise. in fig 1, general framework of research provided. After determination of units and Input - output indicators, identified indicators, sent to project managers and operations managers of call center, and they were asked their opinion on the criteria (Delphi technic). After collecting opinions, 3 indicators has definite by experts of the eight indicators, and two other indicators that there was ambiguity about it ,were weighted and selected by entropy technic. Shannon proposes a non-linear model to estimate entropy. Entropy is a useful technic to model a least biased distribution from the partial information represented by certain moment restrictions, (diversified). The weighting results of indicators have calculated by proposed relations in (7) are presented in table 1.
Pij 𝑟𝑖𝑗
∑𝑚𝑖=1 𝑟𝑖𝑗=; ∀𝑖𝑗,
K = 1
ln 𝑚; ∀𝑗 (7)
Ej = – k ∑𝑚𝑖=1[𝑝𝑖𝑗 . ln 𝑝𝑖𝑗] ; ∀𝑗
Di = 1 – Ej; ∀𝑗
W𝑗 = 𝑑𝑗 ∑𝑛𝑗=1 𝑑𝑗
1161
Fig 1: Phases of research
Table1. Weighting result of indicators by entropy tec
According to the results of calculations in table1, two indicators, number of missed calls and number of incoming calls with maximum weights were selected by experts. According to the concept of efficiency, variables whose objective is to minimize
1161 Table2. Input and output indicators
Given that estimating parameter in form of point, increases the estimated error rate, in present study converted reported values in form of intervals and uses interval estimation of the mean with % 95 confidences to increase reliability. DMUs with their interval values is shown in table3. After determining the amount of interval indicators, efficiency units are calculated
based on IDEA. Performance models can be calculated based on output-oriented and input-oriented.in present study, given that there is no control over the output values, we calculated efficiency of DMUs based on input oriented CCR model. The results of efficiency score in lower bound and upper bound shown in table 4.
Table3. DMUs with interval values
1162
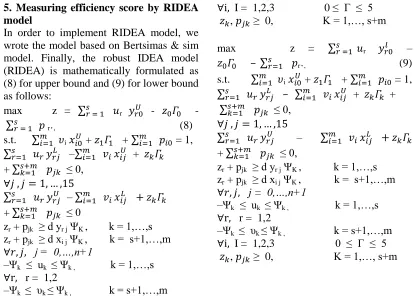
5. Measuring efficiency score by RIDEA model
In order to implement RIDEA model, we wrote the model based on Bertsimas & sim model. Finally, the robust IDEA model (RIDEA) is mathematically formulated as (8) for upper bound and (9) for lower bound as follows:
max z = ∑𝑠𝑟 = 1 𝑢r 𝑦𝑟0𝑈 - 𝑧0𝛤0
∑𝑠 𝑝
𝑟 = 1 r0, (8)
s.t. ∑𝑚𝑖=1 𝜐i𝑥𝑖0𝑈 + 𝑧1𝛤1 + ∑𝑚𝑖=1 𝑝𝑖0 = 1,
∑𝑠𝑟=1 𝑢𝑟𝑦𝑟𝑗𝐿 –∑𝑖=1𝑚 𝑣𝑖𝑥𝑖𝑗𝑈 + 𝑧𝑘𝛤𝑘
+ ∑𝑠+𝑚𝑘=1 𝑝𝑗𝑘 ≤ 0,
∀𝑗 , 𝑗 = 1, … ,15
∑𝑠𝑟=1 𝑢𝑟𝑦𝑟𝑗𝑈 – ∑𝑚𝑖=1 𝑣𝑖𝑥𝑖𝑗𝐿 + 𝑧𝑘𝛤𝑘
+ ∑𝑠+𝑚𝑘=1 𝑝𝑗𝑘 ≤ 0
zr + pjk ≥ d yr j ΨK , k = 1,…,s
zr + pjk ≥ d xi j ΨK , k = s+1,…,m
∀𝑟, 𝑗, j = 0,…,n+1
–Ψk ≤ uk ≤ Ψk , k = 1,…,s
∀r, r = 1,2
–Ψk ≤ υk ≤ Ψk , k = s+1,…,m
∀i, I = 1,2,3 0 ≤ Γ ≤ 5
𝑧𝑘, 𝑝𝑗𝑘 ≥ 0, K = 1,…, s+m
max z = ∑𝑠𝑟 =1 𝑢r 𝑦𝑟0𝑙 –
𝑧0𝛤0 – ∑𝑠𝑟=1 𝑝r0, (9)
s.t. ∑𝑚𝑖=1 𝜐i𝑥𝑖0𝑈 + 𝑧1𝛤1 + ∑𝑚𝑖=1 𝑝𝑖0 = 1,
∑𝑠𝑟=1 𝑢𝑟𝑦𝑟𝑗𝐿 – ∑𝑖=1𝑚 𝑣𝑖𝑥𝑖𝑗𝑈 + 𝑧𝑘𝛤𝑘 +
∑𝑠+𝑚𝑘=1 𝑝𝑗𝑘 ≤ 0,
∀𝑗 , 𝑗 = 1, … ,15
∑𝑠𝑟=1 𝑢𝑟𝑦𝑟𝑗𝑈 – ∑𝑚𝑖=1 𝑣𝑖𝑥𝑖𝑗𝐿 + 𝑧𝑘𝛤𝑘
+ ∑𝑠+𝑚𝑘=1 𝑝𝑗𝑘 ≤ 0,
zr + pjk ≥ d yr j ΨK , k = 1,…,s
zr + pjk ≥ d xi j ΨK , k = s+1,…,m
∀𝑟, 𝑗, j = 0,…,n+1
–Ψk ≤ uk ≤ Ψk , k = 1,…,s
∀r, r = 1,2
–Ψk ≤ υk ≤ Ψk , k = s+1,…,m
∀i, I = 1,2,3 0 ≤ Γ ≤ 5
𝑧𝑘, 𝑝𝑗𝑘 ≥ 0, K = 1,…, s+m
Table 5.The results of efficiency score in different values of Gamma in upper bound
1 .e rteb a te fa rd a 2 .e m da d ca rt 3 .e m da d m o shta ri 4 . em d a dh a m k a r 5 .p is hkh a n 6 .e m da d sh o a b 7 .s a nd o g h 8 .e ba nki ng 9 .k ha ra zm i 1 0 .V IP s er v ic e 1 1 .s a da d 1 2 .a irl ine 1 1 3 .a irl ine 2 1 4 .b a nk 1 1 5 .b a nk 2
Γ= 0 1 1 1 1 1 1 1 1 1 1 1 1 3.025 1 1
Γ0=0.6
Γ1=0.6
Γi=0.6
d=0
.1
0.999 1 0.999 0.892 0.999 0.999 0.995 0.999 0.999 0.996 0.999 0.999 3 0.999 0.999
d=0
.5
0.999 0.999 0.999 0.558 0.999 0.999 0.978 0.999 0.999 0.983 0.999 0.998 2.919 0.999 0.999
d=0
.8
0.999 0.999 0.999 0.379 0.999 0.999 0.966 0.999 0.999 0.973 0.999 0.997 2.862 0.999 0.999
Γ0=1
Γ1=1.5
Γi=2
d=0
.1
0.999 1 0.999 0.818 0.999 0.999 0.990 0.999 0.999 0.992 0.999 0.999 2.958 0.999 0.999
d=0
.5
0.999 0.999 0.999 0.343 0.998 0.999 0.955 0.999 0.998 0.964 0.999 0.996 2.842 0.999 0.999
d=0
.8
0.999 0.998 0.999 0.139 0.998 0.999 0.929 0.999 0.998 0.944 0.999 0.993 2.750 0.999 0.999
Γ0=2
Γ1=3
Γi=5
d=0
.1
0.999 1 0.999 0.812 0.999 0.999 0.990 0.999 0.999 0.992 0.999 0.999 2.983 0.999 0.999
d=0
.5
0.999 0.999 0.9997 0.333 0.998 0.999 0.954 0.9996 0.998 0.964 0.999 0.996 2.832 0.999 0.999
d=0
.8
1163
Table 6.The results of efficiency score in different values of Gamma in lower bound
1 .e rteb a te fa rd a 2 .e m da d ca rt 3 .e m da d m o shta ri 4 . em d a dh a m k a r 5 .p is hkh a n 6 .e m da d sh o a b 7 .s a nd o g h 8 .e ba nki ng 9 .k ha ra zm i 1 0 .V IP s er v ic e 1 1 .s a da d 1 2 .a irl ine 1 1 3 .a irl ine 2 1 4 .b a nk 1 1 5 .b a nk 2
Γ= 0 0.118 0.099 0.102 1 0.122 0.081 1 0.091 0.061 0.087 0.091 0.077 0.059 0.013 0.062
Γ0=0.6
Γ1=0.6
Γi=0.6
d=0
.1
0.112 0.094 0.097 0.93 0.115 0.076 0.99 0.086 0.058 0.082 0.086 0.073 0.056 0.006 0.059
d=0
.5
0.087 0.072 0.075 0.720 0.089 0.059 0.99 0.066 0.045 0.063 0.067 0.056 0.043 0.005 0.045
d=0
.8
0.067 0.056 0.058 0.590 0.069 0.046 0.98 0.052 0.035 0.049 0.052 0.044 0.034 0.004 0.035
Γ0=1
Γ1=1.5
Γi=2
d=0
.1
0.106 0.089 0.092 0.884 0.109 0.072 0.99 0.081 0.055 0.078 0.082 0.069 0.053 0.005 0.056
d=0
.5
0.061 0.051 0.053 0.538 0.063 0.041 0.98 0.047 0.031 0.044 0.047 0.039 0.030 0.0046 0.032
d=0
.8
0.030 0.025 0.026 0.365 0.031 0.021 0.97 0.23 0.015 0.21 0.023 0.019 0.015 0.0045 0.016
Γ0=2
Γ1=3
Γi=5
d=0
.1
0.106 0.089 0.092 0.879 0.109 0.072 0.99 0.081 0.055 0.078 0.082 0.069 0.053 0.005 0.056
d=0
.5
0.061 0.051 0.053 0.518 0.063 0.041 0.98 0.047 0.031 0.044 0.047 0.039 0.030 0.0046 0.032
d=0
.8
0.030 0.025 0.026 0.337 0.031 0.020 0.97 0.023 0.015 0.021 0.023 0.019 0.015 0.0045 0.016
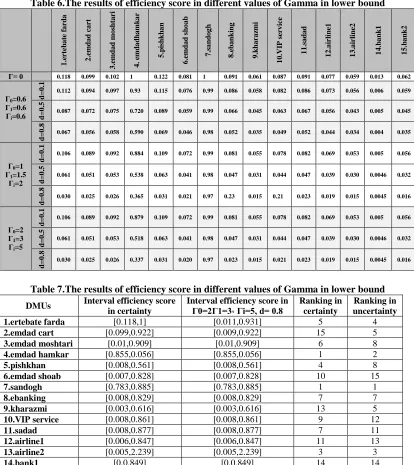
Table 7.The results of efficiency score in different values of Gamma in lower bound
DMUs Interval efficiency score
in certainty
Interval efficiency score in
Γ0=2Γ1=3 ، Γi=5, d= 0.8
Ranking in certainty
Ranking in uncertainty
1.ertebate farda [0.118,1] [0.011,0.931] 5 4
2.emdad cart [0.099,0.922] [0.009,0.922] 15 5
3.emdad moshtari [0.01,0.909] [0.01,0.909] 6 8
4.emdad hamkar [0.855,0.056] [0.855,0.056] 1 2
5.pishkhan [0.008,0.561] [0.008,0.561] 4 8
6.emdad shoab [0.007,0.828] [0.007,0.828] 10 15
7.sandogh [0.783,0.885] [0.783,0.885] 1 1
8.ebanking [0.008,0.829] [0.008,0.829] 7 7
9.kharazmi [0.003,0.616] [0.003,0.616] 13 5
10.VIP service [0.008,0.861] [0.008,0.861] 9 12
11.sadad [0.008,0.877] [0.008,0.877] 7 11
12.airline1 [0.006,0.847] [0.006,0.847] 11 13
13.airline2 [0.005,2.239] [0.005,2.239] 3 3
14.bank1 [0,0.849] [0,0.849] 14 14
15.bank2 [0.005,0.895] [0.005,0.895] 12 10
As mentioned in the previous section, Γ=0, shows efficiency scores in terms of certainty. Based on table 5, in certainty situation or in Γ=0, Performance Rating of all DMUs in upper bound are 1 except airline2 which can be up to 3.025. While in table 6 in lower bound, Performance Rating of 2 DMUs, Sandogh and Emdadhamkar are 1. In other words, in the worst case that
1164 However, since the result of efficiency rating are in interval form, Judgment is a little more difficult, So we need at first, rating units based on both upper and lower bound and then analysis result again.in next part we ranking DMUs based on Sengupta ranking in certainty and uncertainty
situation and compare results. Final result is shown in table7.
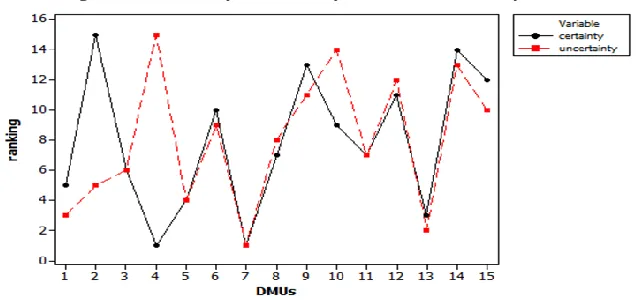
Based on obtained results of ranking in table 7, the degree of conformity of efficiency in terms of certainty and uncertainty of DMUs are provided in fig 2.
Fig 2. The degree of conformity of efficiency in terms of certainty and uncertainty
By comparing the results of the ranking in terms of certainty and uncertainty in table7, we noticed a change in the ranking of units. The rank of units such as Emdad hamkar and VIP, increased. This change indicates that performance of these units during uncertainty situation or in other words, changes in their input and output, drops rapidly. On the other hand, units such as Sadad and Emdad moshtari, although initially had low performance rating, however, increasing changes in input and output, their performance will not be impaired. Thus they have greater stability, and using robust approach, Can improve the ranking of units. The degree of conformity of efficiency in terms of certainty and uncertainty is shown in Fig 2.
Note that the ranking order of DMUs is changed in uncertainty situation as shown in Fig.2.Based on Fig 2, DMUs such as Emdad cart (2) and Emdad hamkar (4) which have most changes in ranking during uncertainty are less stable.
6. Conclusion
1165
Reference
[1] Ben-Tal, A., Nemirovski, A. (2000). Robust solutions of linear programming problems contaminated with uncertain data. Mathematical Programming, 88, 411–421.
[2] Bertsimas, D., Sim, M. (2003). Robust discrete optimization and network flows. Mathematical Programming Series 98, 49– 71.
[3] Bertsimas, D., pachamanova, D,.Sim, M. (2004). Robust linear optimization under general norms, Operations Research Letters 32, 510 – 516.
[4] Bougnola. M.-L, Dulá., J.H, EstellitaLins. M.P, Moreira da Silva.A.C. (2010). Enhancing standard performance practices with DEA. Omega 38. 33 – 45.
[5] Chang, Shih-Chi. (2011). Returns to scale in DEA models for performance evaluations.Technological Forecasting& Social Change. 78, 1389–1396.
[6] Ching-Kuo Wei, Liang-Chih Chen, Rong-Kwei Li, Chih-Hung Tsai, Hsiao-Ling Huang.(2012). A study of optimal weights of Data Envelopment Analysis – Development of a context-dependent DEA-R model, Expert Systems with Applications 39, 4599–4608.
[7] Emrouznejad, A., Rostamy-Malkhalifeh,M.,Hatami-Marbini, A.Tavana, M.(2012), General and multiplicative non-parametric corporate performance models with interval ratio data, Applied Mathematical Modelling 36, 5506–5514.
[8] Entani, T., Maeda, Y., Tanaka, H. (2002).Dual models of interval DEA and its extension to interval data, European Journal of Operation Research 136, 32-45.
[9] Haghighat MS, KhorramE. (2005).The maximum and minimum number of
efficient units in DEA with interval data.Appl Math Comput 163(2): 919–930.
[10] Hatami-Marbini.A, Emrouznejad.A,. Agrell.Per J.(2014) .Interval data without sign restrictions in DEA.Applied Mathematical Modelling 38. 2028-2036.
[11] Hosseinzadeh Lotfi, F., Navabakhs, M., Tehranian, A,. Rostamy-Malkhalifeh, M.,(2007). Ranking Bank Branches with Interval Data The Application of DEA, International Mathematical Forum, 2(9), 429 – 440.
[12] Jahanshahloo. G.R, Hosseinzadeh Lofti.F, Moradi. M. (2004). Sensitivity and stability analysis in DEA with interval data.Applied Mathematics and Computation 156, 463–477.
[13] Jahanshahloo. G.H, Hosseinzadeh Lotfi.F, Davoodi.A.R, (2009). Extension of TOPSIS for decision-making problems with wertyiinterval data: interval efficiency. Mathematical and Computer Modeling 49, 1137-1142.
[14] Peykani, P., Mohammadi, E., Jabbarzadeh, A.Jandaghian,A .,(2016). Utilizing Robust Data Envelopment Analysis Model for Measuring Efficiency of Stock, A case study: Tehran Stock Exchange, Journal of New Researches in Mathematics, 1(4) 16-24.
[15] Sadjadi.S.J, Omrani.H, (2008). Data envelopment analysis with uncertain data: An application for Iranian. Energy Policy 36. 4247–4254.
1166 Consistent and robust ranking in imprecise data envelopment analysis under perturbations of random subsets of data.Springer. OR Spectrum.
[18] Smirlis YG, Maragos EK, Despotis DK (2006) Data envelopment analysis with missing values: an interval DEA approach. Appl Math Comput 177(1):1–10.
[19] Soleimani-damaneh.M., Zarepisheh, M. (2009) .Shannon’s entropy for combining the efficiency results of different DEA models: Method and application. Expert Systems with Applications 36, 5146– 5150.
[20] Soyster, A. L. (1972). Convex programming with set-inclusive constraints and applications to inexact linear programming.Operations Research, 21(5) 1154-1157.
[21]
Toloo, M., Sohrabi, B., Nalchigar,
S. (2009). A new method for ranking
discovered rules from data mining by
DEA. Expert Systems with Applications,
36, 8503–8508.
[22] Wanke.P, Barros.C, (2014) Two-stage DEA: An application to major Brazilian banks, Expert Systems with Applications 41, 2337–2344.
[23] Wu, D. (2006). A note on DEA efficiency assessment using ideal point: An improvement of Wang and Luo’s model. Applied Mathematics and Computation, 183, 819–830.
[24] Yeh. C, Chi, D., Hsu, M. (2010). A hybrid approach of DEA, rough set and support vector machines for business failure prediction. Expert Systems with Applications 37, 1535–1541.
[25] Yousefi.A, Hadi-Vencheh.A. (2010), an integrated group decision making model and its evaluation by DEA for automobile