DOI: 10.2478/10004-1254-64-2013-2300 Scientifi c paper
DETECTION OF THALLIUM AND URANIUM IN
WELL WATER AND BIOLOGICAL SPECIMENS OF AN
EASTERN CROATIAN POPULATION
Mario ĆURKOVIĆ1, Laszlo SIPOS5, Dinko PUNTARIĆ2, Katarina DODIG-ĆURKOVIĆ3,
Nela PIVAC6, and Kristina KRALIK4
Department of Family Medicine1, Department of Public Health2, Department of Psychiatry3, Department of
Biophysics, Medical Statistics and Medical Informatics4, Josip Juraj Strossmayer University of Osijek School of
Medicine, Osijek, University of Zagreb Faculty of Chemical Engineering and Technology5, Ruđer Bošković Institute6,
Zagreb, Croatia
Using inductively-coupled plasma mass spectrometry (ICP-MS), we measured the concentrations of thallium and uranium in local water resources from three villages (Ćelije, Draž, and Potnjani) in eastern Croatia, with the aim to determine if they were associated with the levels of these same elements in the serum, urine, and hair collected from the residents of this area. The exposure of the local population to thallium and uranium through drinking water was generally low. ICP-MS was capable of measuring the levels of both of the elements in almost all of the analysed samples. Although there were differences in the concentrations of both elements in water samples and biological specimens taken from the residents, they did not reach the maximum contaminant level in any of the four sample types studied. Although hair was previously reported as an excellent indicator of occupational and environmental exposure to various elements, our study did not confi rm it as a reliable biological material for tracing thallium and uranium levels, mainly due to the very low concentrations of these elements, often well below the detection limit. However, our results have shown that the concentration of thallium and uranium in drinking water can be effectively traced in urine samples.
KEY WORDS: biological specimens,inductively-coupled plasma mass spectrometry, local water resources, toxic metals
Thallium is a naturally occurring trace element, widely distributed at very low concentrations in the earth’s crust. It is not an essential element for life and does not have a known biological use (1), but has been confi rmed toxic in studies on animals (2). As one of the most toxic heavy metals, thallium has also been responsible for many accidental, occupational, deliberate, and therapeutic poisonings (3, 4). Its continued use as a rodenticide in many developing countries and its increasing use in technology have raised concerns about the exposure risk for animals and humans (4). Major sources of thallium in the environment are fossil fuels and the smelting of ferrous and non-ferrous ores. Minor sources include oil
fraction refi nement, cement production, brickworks, potash-derived fertilizers, and the production and uses of thallium (5).
development and damages DNA (9). Data from experimental studies on animals and human epidemiology studies have shown that uranium has many harmful effects on the kidneys and reproductive organs (7).
The drinking water in eastern Croatia contains high concentrations of toxic elements such as arsenic, manganese, and iron (10-12). However, there is a lack of data about the possibility of the exposure of local inhabitants to thallium and uranium, since the drinking water from the studied sites has never been chemically analysed in such detail.
In this area, people often use private wells as a source of drinking water. Although the analysis of well water and determination of concentrations of potentially toxic elements can reduce the risk of harmful effects to human populations, the private owners of such wells are not obliged by the regulatory authorities to test their water. People using private wells are therefore at a risk of exposure to a variety of contaminants. The inhabitants of the rural areas of eastern Croatia mainly work in agriculture. Crop cultivation involves large amounts of phosphate fertilisers, which along with coal and fuel burning may be a source of both thallium and uranium in drinking water.
Therefore, the main objective of our study was to establish the levels of exposure to uranium and thallium in the drinking water of the aforementioned three villages and determine which biological specimen is most accurate in the detection of thallium and uranium levels.
MATERIALS AND METHODS
Study area
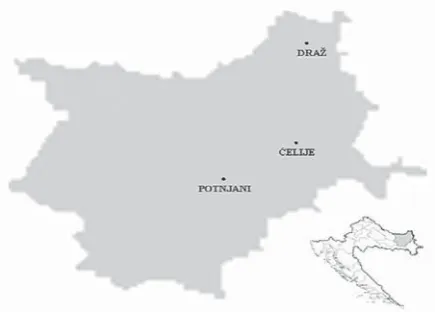
The study was performed between May 2005 and June 2007 in three communities: Ćelije, Draž, and Potnjani, situated in the eastern Croatia regions of Slavonija and Baranja. The locations of the sites are shown in Figure 1.
Water sampling and analysis
In the three communities, the residents use drinking water from wells (tube wells and dug wells) by pumping it into their household water pipes. A total of 90 samples of drinking water were collected: 56 samples in May and June of 2005 and 2006, and 34
samples in May and June of 2007 (Table 1). The wells were selected at random. The study was performed in accordance with the Croatian regulations on the safety of drinking water.
During the sampling of the well water, the water was allowed to run from the tap for about 60 seconds or was taken from the hydraulic accumulator that pumps the well water into the households. It was then sampled in 100 mL polyethylene bottles. After that, 1 mL of 33 % nitric acid was added to each polyethylene bottle containing a sample of the well water, and the bottles were shaken vigorously. The samples of well water were placed in a freezer at -20 °C. After collection, all of the samples were transported in a portable freezer to the Laboratory of General and Inorganic Chemistry, Faculty of Chemical Engineering and Technology, University of Zagreb. Complete analysis of the drinking well water samples was performed by inductively-coupled plasma mass spectrometry (ICP-MS) Perkin Elmer, ELAN DRC-e, according to United States Environmental Protection Agency (US EPA), method 200.8. (13). The operating conditions for all water and biological samples are described below.
Urine, blood, and hair sampling and analysis
The study included 30 sample donors of both sexes aged 35 to 75 years who lived in three village communities and represented a cross-section of the population in these communities. The study was approved by the Ethics Committee of University of Osijek School of Medicine. The purpose of the study was explained to each participant, who then provided their written informed consent.
Venous blood and spot urine samples were taken from 30 subjects from the three communities in May
and June of 2005 and 2006. During May and June of the third year (2007), 36 blood, spot urine, and hair samples were taken from 17 volunteers from Ćelije and Draž only.
The blood and urine samples were taken by a laboratory technician. At least 3 mL of blood was taken from each participant using a Vacuette® Blood
Collection Needle (38 mm×0.9 mm) and a Vacuette®
Serum Gel Tube (3.5 mL, Greiner Bio-One, Kremsmünster, Austria). The serum was separated into 1.5 mL Eppendorf® microtubes 3810X (3810X,
Eppendorf Geratebau, Hamburg, Germany) on the same day.
The spot urine samples were placed in 55 mL urine collection containers (Plastika Moćan, Samobor, Croatia). The hair samples, approximately 0.1 cm wide and 3 cm long, were cut with stainless steel scissors from the occipital scalp of each subject and placed into polyethylene bags. If the hair was short, several samples from the same part of the head were taken.
The serum and urine samples were stored at -70 °C until analysis and transported in a portable freezer to the Laboratory of General and Inorganic Chemistry, Faculty of Chemical Engineering and Technology,
University of Zagreb. All of the biological samples were analysed using ICP-MS.
Prior to the analysis, water samples were thawed and conditioned 24 h at laboratory temperature. Approximately 10 mL of each water sample were taken for the analysis. The serum and urine samples were thawed, acidifi ed with 60 % nitric acid (0.1 mL per 10 mL of sample), mixed well, and 0.5 mL diluted to 10 mL with 1 % nitric acid before analysis. The hair samples were washed with acetone, air-dried for 24 h, weighed to exactly 0.1 g, dissolved in 1 mL of nitric acid, and diluted to 10 mL for analysis. High purity nitric acid (“Suprapure”®, Merck KGaA, Darmstadt,
Germany) was used throughout.
The operating conditions of the ICP-MS using nickel sampler/skimmer cones were: RF power 1300 W, plasma gas fl ow 15 L min-1, auxiliary gas
fl ow 1 L min-1, nebulizer gas fl ow 0.94 L min-1 to
0.96 L min-1, peristaltic pump speed 1 L min-1. The
instrument was calibrated after every twelve samples, using an external “71-Element Group Multi Element Standard Solution” (Inorganic Ventures, Christiansburg, Virginia, USA) and internal standards with elements yttrium (Y), indium (In), terbium (Tb) and bismuth (Bi) (Inorganic Ventures, USA).
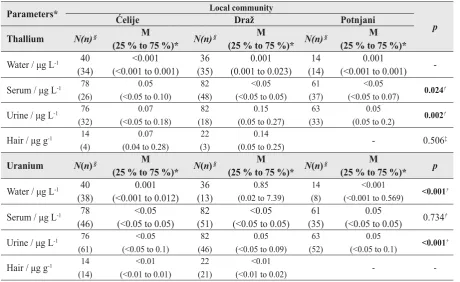
Table 1 Thallium and uranium concentrations measured in the drinking water and biological specimens (serum, urine, and hair) collected at three sampling sites (Ćelije, Draž and Potnjani)
Parameters* Local community
p
Ćelije Draž Potnjani
Thallium N(n) § M
(25 % to 75 %)* N(n)
§ M
(25 % to 75 %)* N(n)
§ M
(25 % to 75 %)*
Water / μg L-1 40
(34)
<0.001 (<0.001 to 0.001)
36 (35)
0.001 (0.001 to 0.023)
14 (14)
0.001
(<0.001 to 0.001)
-Serum / μg L-1 78 (26)
0.05 (<0.05 to 0.10)
82 (48)
<0.05 (<0.05 to 0.05)
61 (37)
<0.05
(<0.05 to 0.07) 0.024
†
Urine / μg L-1 76 (32)
0.07 (<0.05 to 0.18)
82 (18)
0.15 (0.05 to 0.27)
63 (33)
0.05
(0.05 to 0.2) 0.002
†
Hair / μg g-1 14 (4)
0.07 (0.04 to 0.28)
22 (3)
0.14
(0.05 to 0.25) - 0.506
‡
Uranium N(n) § M
(25 % to 75 %)* N(n)
§ M
(25 % to 75 %)* N(n)
§ M
(25 % to 75 %)* p
Water / μg L-1 40
(38)
0.001 (<0.001 to 0.012)
36 (13)
0.85 (0.02 to 7.39)
14 (8)
<0.001
(<0.001 to 0.569) <0.001
†
Serum / μg L-1 78
(46)
<0.05 (<0.05 to 0.05)
82 (51)
<0.05 (<0.05 to 0.05)
61 (35)
0.05
(<0.05 to 0.05) 0.734 †
Urine / μg L-1 76 (61)
<0.05 (<0.05 to 0.1)
82 (46)
0.05 (<0.05 to 0.09)
63 (52)
0.05
(<0.05 to 0.1) <0.001
†
Hair / μg g-1 14 (14)
<0.01 (<0.01 to 0.01)
22 (21)
<0.01
(<0.01 to 0.02) -
-*Median (interquartile range, 25 % to 75 %); †Kruskal Wallis test; ‡Mann Whitney test; §Number of samples (number of samples
The analytical methods were validated using standard reference materials: “ICP multi element standard solution X for surface water testing” (CertiPUR®,Merck, Darmstadt, Germany) and
standard samples “Trace Elements Urine Blank” and “Trace Elements Urine” (SERO AS, Billingstad, Norway).
Statistical analysis
Normality of distribution was tested with the Kolmogorov-Smirnov test. Median and interquartile ranges were given for variables that were not distributed normally. Since the data were not normally distributed, Kruskal-Wallis test and Mann-Whitney U-test were used to determine the differences in the measured parameters among the three communities. The signifi cance was set at p=0.05.
RESULTS
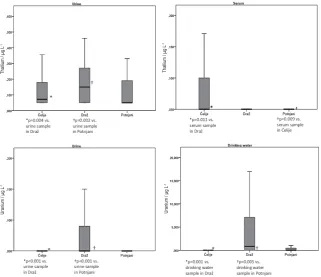
The levels of thallium and uranium measured in the samples of drinking well water and biological specimens (serum, urine, and hair) collected from the residents of the studied communities are shown in Table 1 and Figure 2.
Drinking well water
Concentrations of thallium in the majority of samples of drinking water collected in all three communities were below the detection limit, so these results could not be compared. Concentrations of uranium in the samples of drinking water were the highest in Draž, with a signifi cantly greater number of samples of drinking water that had measurable values of uranium, whereas the samples from the other two villages were mostly free of uranium. The Kruskal-Wallis test confi rmed signifi cant differences (p<0.001) between the uranium levels measured at all three sampling sites (Table 1, Figure 2). The most prominent differences (Mann-Whitney U-test) were observed between the uranium levels measured in the samples of drinking water from Draž as compared to the levels measured in Ćelije (p=0.001), and between Draž and Potnjani (p=0.005).
Serum
The thallium concentration measured in the serum samples from all of the three sampling sites differed signifi cantly (p=0.024; Kruskal-Wallis test) (Table 1, Figure 2). Thallium concentrations were signifi cantly higher (Mann-Whitney U-test) in serum samples taken from the subjects in Ćelije compared to Draž (p=0.011)
Figure 2 Median thallium and uranium concentration (μg L-1) measured in the drinking water and biological specimens (urine
and serum) collected at three sampling sites (Ćelije, Draž and Potnjani)
Thallium / μg L
-1
Thallium / μg L
-1
Uranium / μg L
-1
Uranium / μg L
and Potnjani (p=0.009). There was no signifi cant difference in the level of uranium.
Urine
The thallium concentration measured in the urine samples collected in all of the three villages differed signifi cantly (Kruskal-Wallis test, p=0.002) (Table 1, Figure 2). Thallium concentrations were signifi cantly higher (Mann-Whitney U-test) in urine samples from Draž compared to the samples taken from Ćelije (p=0.004) and Potnjani (p=0.002).
The uranium concentration was significantly different the in urine samples (Kruskal-Wallis test, p<0.001) collected in all three villages (Table 1, Figure 2). We found a statistically signifi cant difference (Mann-Whitney test, p<0.001) in the concentration of uranium in urine between subjects from Draž and Ćelije, and Draž and Potnjani.
Hair
There was no statistically signifi cant difference in the concentration of thallium in the hair samples of subjects from the communities Draž and Ćelije (Table 1).
A large number of hair samples from Draž and Ćelije had uranium concentrations below the detection limit, so these results could not be compared (Table 1).
DISCUSSION
The present study is the fi rst to report thallium and uranium levels measured in drinking water and three biological specimens in an eastern Croatian population using the ICP-MS method. On the grounds of the obtained data, it intention is to discuss the mutual relationships between these levels. The obtained results confi rm that ICP-MS was capable of measuring detectable levels for both elements in almost all of the samples analysed, but that urine was the most accurate.
Thallium and uranium in drinking water
The knowledge about the sources, mobility, and transport routes of thallium in the environment is very important to evaluate and reduce the risk of contamination with this element (14). The major sources of thallium in drinking water are leaching from ore-processing sites, as well as discharge from electronics, glass, and pharmaceutical industries (15). Other potential sources are inadequate waste removal
and storage and chemical dumps. Thallium compounds easily mix with water, whereas small amounts can be transmitted through the air from coal power plants, cement plants, and smelting plants (16-19). Although thallium is more toxic than cadmium, lead and mercury, data on its presence in water and biological tissues are scarce, perhaps due to the generally low levels of thallium in the environment and the high analytical detection limit (5). Several recent studies (3, 20-22) have dealt with the effect of thallium on the environment and its hazards to humans. In certain geochemically unfavourable areas, natural processes along with human activities can lead to an increase of thallium in surface water, groundwater, and soil (21-22). The exploitation of sulphide minerals leads to the enrichment of local soil, water, and crops with thallium, which fi nally results in chronic thallium poisoning (14). Most poisonings in people occur when water contains up to 3.214 mg L-1 of thallium (23).
The rules on the safety of drinking water in Croatia do not define standard values for thallium (24). However, the United States Environmental Protection Agency (15) set 2 μg L-1 as the maximum contaminant
level (MCL) for thallium in drinking water.
Our results have shown thatthere are no threats for residents in all of the three communities, since the thallium levels were very low and none of the monitoring sites exceeded the MCL value of 2 μg L-1.
Ingesting water from drilled wells is a source of exposure to uranium in different populations around the world (8, 25-28). Great variation in the exposure levels of uranium has been reported. In some areas of northern Greece, uranium concentrations in groundwater ranged from 0.01 μg L-1 to 10 μg L-1 (29).
The uranium concentration in drinking water samples collected in Punjab, India varied from 1.39 μg L-1 to
98.25 μg L-1, with a mean value of 19.84 μg L-1 (30).
Uranium levels in samples of Canadian drinking water ranged from undetectable in treated municipal water samples to exceptionally high (>700 μg L-1) in private
groundwater supplies (8). Similar elevated levels of uranium (866 μg L-1 and 1160 μg L-1) were detected
in the drinking well water of a private owner in rural north-western Connecticut, USA (28). Very high concentrations of naturally occurring uranium, up to 12,000 μg L-1, were measured in Finnish groundwater
and wells, presumably because the water in those areas runs through bedrock composed mainly of uranium-rich granitoids and granites (31).
generally low. In all of the three communities, the median level of uranium in drinking water was signifi cantly lower than 30 μg L-1, which is the new
provisional World Health Organization guideline value for uranium in drinking water (32). Croatian legal provisions on drinking water do not stipulate standards for the concentration of uranium in drinking water (24). Since people in the rural areas of eastern Croatia mainly work in agriculture, using large amounts of phosphate fertilizers for the cultivation of crops, we assume that the dissolution of phosphate fertilizers, together with the combustion of coal and other fuels (8), may have been the source of the uranium detected in the drinking water.
Thallium in biological specimens
An important step in the accurate evaluation of the potentially detrimental effects of thallium is the measurement of its content in biological specimens (33). For that purpose, blood, serum, urine, and hair are commonly used (2, 34-37).
In our study, thallium levels were determined in serum samples, and its highest concentration (median 0.05 μg L-1 and interquartile range <0.05 μg L-1 to
0.10 μg L-1) was detected in subjects from Ćelije.
However, these values were well below 2 μg L-1,
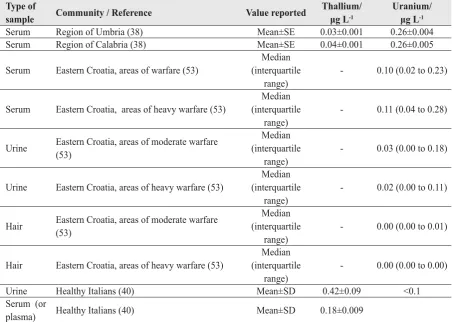
which is considered a normal total blood thallium concentration (38, 39). Furthermore, the levels of thallium measured in the serum of the subjects were quite comparable with the levels reported in two previous Italian studies (Table 2; 38, 40).
Blood thallium levels, however, are not considered reliable measures of exposure, except after extensive exposure (41). The possible reasons for that are the very rapid clearance of thallium from blood in animals and humans (6, 42, 43) and the peculiar kinetic features of thallium ion absorption in the gastrointestinal tract (44).
Thallium is excreted in both animals and humans predominantly by the kidneys and intestine, but also in partly through hair and milk. Studies on acute and chronic poisoning agree that the highest concentration is found in the kidneys (6).
Establishing human urinary thallium concentrations is a quick way to identify human exposure to thallium pollution (14). For a reliable analysis of thallium, the collection of 24-hour urine is advisable, because of the diurnal variation, i.e. peak excretion might vary as a result of a variation in drinking patterns. A thallium concentration higher than 20 μg L-1 is used
as evidence of excessive exposure (41), while urine
thallium concentrations greater than 200 μg L are considered toxic (41, 45).
Nails and urine in humans contain high concentrations of thallium in comparison with other biological samples (46). Data from the general EU population show thallium concentration in urine of 0.066 μg L-1 and in blood 0.063 μg L-1. The overall
correlations between thallium in urine and blood in this study were weak (47). The tentatively proposed reference intervals of thallium are (0.019±0.17) μg L-1
in urine and (0.014±0.19) μg L-1 in blood (47).
Since the concentration of thallium in most samples of drinking water in our study was below the detection limit, the higher concentrations of thallium measured in the urine of subjects from Draž and the higher concentrations of thallium measured in the serum of subjects from Ćelije cannot be attributed to drinking water, thus presumably refl ecting exposure to unknown sources. To determine the exact source, we would need to establish the occupational and other exposures of subjects with elevated levels of thallium in the urine and serum.
Uranium in biological specimens
Assessment of occupational or environmental exposure to uranium compounds is largely based on urinary analysis (48).ICP-MS has proven to be a fast, reliable and highly sensitive technique for measuring uranium concentrations in urine (49). Spot urine samples are routinely used to monitor occupational exposure to uranium and other toxic heavy metals, such as mercury, lead, and cadmium (50). The diurnal fl uctuations of uranium in spot samples and diurnal variations in the uranium concentrations in different urine samples from the same individual could be quite large (48, 50). Therefore, complete 24-hour urine samples give better precision in estimating uranium concentrations at low levels than spot samples (51). In our study, due to certain technical diffi culties, spot urine samples were used. To overcome the drawbacks that arise from the analysis of spot urine samples, they were taken in three consecutive years, together with hair samples (51, 52). The results obtained in our study (level of uranium in urine) were similar to the results reported in a previous study conducted in eastern Croatia (Table 2, 53).
study on a Finnish population, where drinking water was the major source of exposure to uranium, its content in different biological specimens (urine, hair, and nails) was correlated with uranium intake, particularly at elevated levels ≥10 μg per day (54). These results clearly demonstrate that uranium found in bioassays can be traced back to drinking water, thus providing a direct link to the source of exposure (55). Seldén et al. (56) found that subjects exposed to various concentrations of uranium in drinking water (range <0.20 μg L-1 to 470 μg L-1, median 6.7 μg L-1)
had eight times higher levels of urinary uranium than the control subjects, who were not exposed.
Hair is an excellent indicator of occupational and environmental exposure to various elements, including uranium. Compared to other biological specimens like blood and urine, which tend to show current and recent body status, hair provides status over a longer period of time (57). Hair is an effective bio-concentrator; the samples can be easily stored, the concentration refl ects an integrated value, and fi nally, the measurement of the 234U/238U isotopic ratio in digested hair samples by
multicollector-inductively coupled plasma mass
spectrometry (MC-ICPMS) is feasible and highly informative (55). Muikku et al. (58) investigated a Finnish working population that was not occupationally exposed to uranium and found that their mean uranium concentration in hair was 3- to 15- fold higher than the values reported in the literature, while the mean uranium concentration in urine was similar to those measured elsewhere in Europe. These large variations can be explained by the variation in uranium concentration in drinking water. Very high concentrations of uranium were also measured in private drilled wells in southern Finland (58).
The majority of hair samples from our study had uranium concentrations below the detection limit and these samples were not reliable biological material for tracing uranium. This was due to the fact that the subjects had obviously not ingested uranium concentrations sufficiently high for detection. However, the urine samples enabled us to work with these small concentrations. That is why we were able to fi nd a statistically signifi cant difference in the concentration of uranium in subjects from Ćelije and Potnjani (p<0.001), but not Draž.
Table 2 Comparative results on thallium and uranium concentrations in biological fl uids and hair reported in other studies
Type of
sample Community / Reference Value reported
Thallium/ μg L-1
Uranium/ μg L-1
Serum Region of Umbria (38) Mean±SE 0.03±0.001 0.26±0.004 Serum Region of Calabria (38) Mean±SE 0.04±0.001 0.26±0.005
Serum Eastern Croatia, areas of warfare (53)
Median (interquartile
range)
- 0.10 (0.02 to 0.23)
Serum Eastern Croatia, areas of heavy warfare (53)
Median (interquartile
range)
- 0.11 (0.04 to 0.28)
Urine Eastern Croatia, areas of moderate warfare (53)
Median (interquartile
range)
- 0.03 (0.00 to 0.18)
Urine Eastern Croatia, areas of heavy warfare (53)
Median (interquartile
range)
- 0.02 (0.00 to 0.11)
Hair Eastern Croatia, areas of moderate warfare (53)
Median (interquartile
range)
- 0.00 (0.00 to 0.01)
Hair Eastern Croatia, areas of heavy warfare (53)
Median (interquartile
range)
- 0.00 (0.00 to 0.00)
Urine Healthy Italians (40) Mean±SD 0.42±0.09 <0.1
Serum (or
plasma) Healthy Italians (40) Mean±SD 0.18±0.009
CONCLUSION
The results of this study show that the concentration of thallium and uranium in drinking water can be effectively traced in urine samples. Although hair is an excellent indicator of occupational and environmental exposure to various elements, our study did not confi rm it as a reliable biological material for tracing either the thallium or uranium concentration, mainly due to the very low concentrations of both elements.
Acknowledgements
The authors wish to thank the laboratory staff of the Osijek Health Center and the Osijek University Hospital. Our thanks also goes to all of the residents of the three villages who were directly or indirectly involved in this study.
REFERENCES
1. Cvjetko P, Cvjetko I, Pavlica M. Thallium toxicity in humans. Arh Hig Rada Toksikol 2010;61:111-9. doi: 10.2478/10004-1254-61-2010-1976
2. Chandler HA, Archbold GP, Gibson JM, O’Callaghan P, Marks JN, Pethybridge RJ. Excretion of a toxic dose of thallium. Clin Chem 1990;36:1506-9. PMID: 2387048 3. Peter AL, Viraraghavan T. Thallium: a review of public health
and environmental concerns. Environ Int 2005;31:493-501. doi: 10.1016/j.envint.2004.09.003
4. Mulkey JP, Oehme FW. A review of thallium toxicity. Vet Hum Toxicol 1993;35:445-53. PMID: 8249271
5. Cheam V. Thallium contamination of water in Canada. Water Qual Res J Can 2001;36: 851-77.
6. Nordberg GF, Fowler BA, Nordberg M, Friberg LT, editors.
Handbook on the Toxicology of Metals. 3rd ed. Burlington
(MA): Academic Press Inc; 2007.
7. Taylor DM, Taylor SK. Environmental uranium and human health. Rev Environ Health 1997;12:147-57. PMID: 9406286
8. Weir E. Uranium in drinking water, naturally. CMAJ 2004;170:951-2. doi: 10.1503/cmaj.1040214
9. Brugge D, deLemos JL, Oldmixon B. Exposure pathways and health effects associated with chemical and radiological toxicity of natural uranium: a review. Rev Environ Health 2005;20:177-93. PMID: 16342416
10. Habuda-Stanić M, Kuleš M, Kalajdžić B, Romić Ž. Quality of groundwater in eastern Croatia. The problem of arsenic pollution. Desalination 2007;210:157-62. doi: 10.1016/j. desal.2006.05.040
11. Ćavar S, Klapec T, Grubešić RJ, Valek M. High exposure to arsenic from drinking water at several localities in Eastern Croatia. Sci Total Environ 2005;339:277-82. doi: 10.1016/ j.scitotenv.2004.12.013
12. Santo V, Grgić J, Laslavić B, Dario M, Valek M. Concentration of arsenic, manganese and iron in drinking water of
Osijek-Baranya County. In: Lovrić E, editor. Proceedings of the 6th Scientifi c and Professional Assembly “Symposium Water and Public Water Supply”; 16-19 Oct 2002. Mlini, Župa Dubrovačka, Croatia. Zagreb: Croatian National Institute of Public Health; 2002. p. 69-77.
13. Wolf R.E, Denoyer E, Grosser Z. US EPA method 200.8 for the analysis of drinking waters and wastewaters, Perkin Elmer Inc., 2001., Application Note ENVA-300B.
14. Xiao T, Yang F, Li S, Zheng B, Ning Z. Thallium pollution in China: A geo-environmental perspective. Sci Total Environ 2012;421-422:51-8. doi: 10.1016/j.scitotenv.2011.04.008 15. United States Environmental Protection Agency (USEPA).
Drinking Water Contaminants, National Primary Drinking Water Regulations [displayed August 2011]. Available at http://water.epa.gov/drink/contaminants/index.cfm 16. Agency for Toxic Substances and Disease Registry (ATSDR).
Toxic Substances Portal-Thallium, Toxicological profi le for thallium [displayed September 2011]. Available at http:// www.atsdr.cdc.gov/toxprofi les/tp.asp?id=309&tid=49 17. Dolgner R, Brockhaus A, Ewers U, Wiegand H, Majewski
F, Soddeman H. Repeated surveillance of exposure to thallium in a population living in the vicinity of cement plant emitting dust containing thallium. Int Arch Occup Environ Health 1983;52:79-94. doi: 10.1007/BF00380610
18. Schaller KH, Manke G, Raithel HJ, Buhlmeyer G, Schmidt M, Valentin H. Investigation of thallium-exposed workers in cement factories. Int Arch Occup Environ Health 1980;47: 223-31. doi: 10.1007/BF00381680
19. Ewers U. Environmental exposure to thallium. Sci Total Environ 1988;71:(3)285-92. doi: 10.1016/0048-9697(88)90199-4
20. Li S, Xiao T, Zheng B. Medical geology of arsenic, selenium and thallium in China. Sci Total Environ 2012;421-422:31-40. doi: 10.1016/j.scitotenv.2011.02.040
21. Xiao T, Guha Y, Boyle D, Liu CQ, Chen J. Environmental concerns related to high thallium levels in soils and thallium uptake by plants in southwest Guizhou, China. Sci Total Environ 2004;318:223-44. doi: 10.1016/S0048-9697(03)00448-0
22. Xiao T, Guha J, Boyle D, Liu CQ, Zheng B, Wilson GC, Rouleau A. Chen J. Naturally occurring thallium: a hidden geoenvironmental health hazard? Environ Int 2004;30:501-7. doi: 10.1016/j.envint.2003.10.004
23. Lu CI, Huang CC, Chang YC, Tsai YT, Kuo HC, Chuang YH, Shih TS Short-term thallium intoxication: dermatological findings correlated with thallium concentration. Arch Dermatol 2007;143:93-8. doi: 10.1001/archderm.143.1.93 24. Pravilnik o zdravstvenoj ispravnosti vode za piće [Rules on
health suitability of drinking water, in Croatian]. Narodne novine 47/2008.
25. Kurttio P, Harmoinen A, Saha H, Salonen L, Karpas Z, Komulainen H, Auvinen A. Kidney toxicity of ingested uranium from drinking water. Am J Kidney Dis 2006;47:972-82. PMID: 16731292
26. Kurttio P, Komulainen H, Leino A, Salonen L, Auvinen A, Saha H. Bone as a possible target of chemical toxicity of natural uranium in drinking water. Environ Health Perspect 2005;113:68-72. doi: 10.1289/ehp.7475
27. Auvinen A, Salonen L, Pekkanen J, Pukkala E, Ilus T, Kurttio P. Radon and other natural radionuclides in drinking water and risk of stomach cancer: a case-cohort study in Finland. Int J Cancer 2005;114:109-13. doi: 10.1002/ijc.20680 28. Magdo HS, Forman J, Graber N, Newman B, Klein K, Satlin
nephrotoxicity in a young child exposed to uranium from contaminated well water. Environ Health Perspect 2007;115:1237-41. doi: 10.1289/ehp.9707
29. Katsoyiannis IA, Hug SJ, Ammann A, Zikoudi A, Hatziliontos C. Arsenic speciation and uranium concentrations in drinking water supply wells in Northern Greece: correlations with redox indicative parameters and implications for groundwater treatment. Sci Total Environ 2007;383:128-40. doi: 10.1016/ j.scitotenv.2007.04.035
30. Rani A, Singh S. Analysis of uranium in drinking water samples using laser induced fluorimetry. Health Phys 2006;91:101-7. doi: 10.1097/01
31. Kurttio P, Auvinen A, Salonen L, Saha H, Pekkanen J, Makelainen I, Vaisanen SB, Penttila IM, Komulainen H. Renal effects of uranium in drinking water. Environ Health Perspect 2002;110:337-42. PMID:11940450
32. World Health Organization (WHO). Guideliness for Drinking-water Quality, fourth edition. [displayed October 20011]. Available at http://www.scribd.com/doc/59802585/ Guidelines-for-Drinking-water-Quality-2011
33. Hirata M, Taoda K, Ono-Ogasawara M, Takaya M, Hisanaga N. A probable case of chronic occupational thallium poisoning in a glass factory. Ind Health 1998;36:300-3. doi: 10.2486/indhealth.36.300
34. Centers for Disease Control and Prevention (CDC). Thallium poisoning from eating contaminated cake--Iraq, 2008. MMWR Morb Mortal Wkly Rep 2008;57:1015-8. PMID: 18802411
35. Zhao G, Ding M, Zhang B, Lv W, Yin H, Zhang L, Ying Z, Zhang Q. Clinical manifestations and management of acute thallium poisoning. Eur Neurol 2008;60:292-7. doi: 10.1159/000157883
36. Pelclova D, Urban P, Ridzon P, Senholdova Z, Lukas E, Diblik P, Lacina L. Two-year follow-up of two patients after severe thallium intoxication. Hum Exp Toxicol 2009;28:263-72. doi: 10.1177/0960327109106487
37. Saha H, Sadhu HG, Karnik AB, Patel TS, Sinha SN, Saiyed HN. Erosion of nails following thallium poisoning: a case report. Occup Environ Med 2004;61:640-2. doi: 10.1136/ oem.2003.009464
38. Bocca B, Mattei D, Pino A, Alimonti A. Italian network for human biomonitoring of metals: preliminary results from two Regions. Ann Ist Super Sanita 2010;46:259-65. 39. Moore D, House I, Dixon A. Thallium poisoning. Diagnosis
may be elusive but alopecia is the clue. BMJ 1993;306:1527-9.
40. Minoia G, Sabbioni E, Apostoli P, Pietra R, Pozzoli L, Gallorini M, Nocolau G, Allesio L, Capodaglio E. Trace element reference values in tissues from inhabitants of the European Community I. A study of 46 elements in urine, blood and serum of Italian subjects. Sci Total Environ 1990;95:89-105. doi: 10.1016/0048-9697(94)90059-0 41. Ferguson TJ. Thallium. In: Olson KR, Anderson IB, Benowitz
NL, Blanc PD, Clark RF, Kearny TE, Osterloh J, editors. Poisoning and Drug Overdose. 4th ed. Singapore: The McGraw–Hill Companies; 2004. p. 352-4.
42. Bradley-Moore PR, Lebowitz E, Greene MW, Atkins HL, Ansari AN. Thallium-201 for medical use. II: Biologic behavior. J Nucl Med 1975;16:156-60. PMID: 1110422 43. Atkins HL, Budinger TF, Lebowitz E, Ansari AN, Greene
MW, Fairchild RG, Ellis KJ. Thallium-201 for medical use. Part 3: Human distribution and physical imaging properties. J Nucl Med 1977;18:133-40 PMID: 833658.
44. Luzanova IS, Pletneva TV, Maksimova TV, Salomatin EM, Lutskii Ia M. Measurement of thallium content in human urine by atomic absorption spectrometry after acute p o i s o n i n g . S u d M e d E k s p e r t 2 0 0 8 ; 5 1 : 4 1 - 3 . PMID:19048879
45. McMillan TM, Jacobson RR, Gross M. Neuropsychology of thallium poisoning. J Neurol Neurosurg Psychiatry 1997;63:247-50.
46. Das AK, Chakraborty R, Cervera ML, de la Guardia M. Determination of thallium in biological samples. Anal Bioanal Chem 2006;385:665-70. doi: 10.1007/s00216-006-0411-8
47. Sabbioni E, Minoia C, Ronchi A, Hansen BG, Pietra R, Balducci C. Trace element reference values in tissues from inhabitants of the European Union. VIII. Thallium in the Italian population. Sci Total Environ 1994;158:227-36. 48. Karpas Z. Uranium bioassay--beyond urinalysis. Health Phys
2001;81:460-3. PMID:11569642
49. Baggati D, Cantone MC, Giussani A, Veronese I, Roth P, Werner E, Hollriegl, V. Regional dependence of urinary uranium baseline levels in non-exposed subjects with particular reference to volunteers from Northern Italy. J Environ Radioact 2003;65:357-64. doi: 10.1016/S0265-931X(02)00107-8
50. Karpas Z, Lorber A, Elish E, Marcus P, Roiz Y, Marko R, Kol R, Brikner D, Halicz L. Uranium in urine--normalization to creatinine. Health Phys 1998;74:86-90. PMID:9415585 51. Jones AD, Miller BG, Walker S, Anderson J, Colvin AP,
Hutchison PA, Soutar CA. A normative value pilot study: levels of uranium in urine samples from UK civilians. E n v i r o n R e s 2 0 0 7 ; 1 0 4 : 2 1 6 - 2 3 . d o i : 1 0 . 1 0 1 6 / j . envres.2007.02.004
52. McDiarmid MA, Hooper FJ, Squibb K, McPhaul K. The utility of spot collection for urinary uranium determinations in depleted uranium exposed Gulf War veterans. Health Phys 1999;77:261-4. PMID:10456496
53. Jergović M, Miškulin M, Puntarić D, Gmajnić R, Milas J, Sipos L. Cross-sectional Biomonitoring of Metals in Adult Populations in Post-war Eastern Croatia: Differences Between Areas of Moderate and Heavy Combat. Croat Med J 2010;51:451-60.
54. Karpas Z, Paz-Tal O, Lorber A, Salonen L, Komulainen H, Auvinen A, Saha H, Kurttio P. Urine, hair, and nails as indicators for ingestion of uranium in drinking water. Health Phys 2005;88:229-42. PMID:15706143
55. Karpas Z, Lorber A, Sela H, Paz-Tal O, Hagag Y, Kurttio P, Salonen L. Measurement of the 234U/238U ratio by MC-ICPMS in drinking water, hair, nails, and urine as an indicator of uranium exposure source. Health Phys 2005;89:315-21. PMID:16155452
56. Seldén AI, Lundholm C, Edlund B, Högdahl C, Ek BM, Bergström BE, Ohlson CG. Nephrotoxicity of uranium in drinking water from private drilled wells. Environ Res 2009;109:486-94. doi: 10.1016/j.envres.2009.02.002 57. Bass DA, Hickok D, Quig D, Urek K. Trace element analysis
in hair: factors determining accuracy, precision, and r e l i a b i l i t y. A l t e r n M e d R e v 2 0 0 1 ; 6 : 4 7 2 - 8 1 . PMID:11703167
Sažetak
ODREĐIVANJE RAZINA TALIJA I URANA U BUNARSKOJ VODI I BIOLOŠKIM UZORCIMA STANOVNIŠTVA TRIJU ISTOČNOHRVATSKIH SELA
Koristeći masenu spektrometriju induktivno spregnute plazme (ICP-MS), izmjerili smo koncentracije talija i urana u lokalnim izvorima vode triju istočnohrvatskih sela (Ćelije, Draž i Potnjani) radi određivanja jesu li povezane s razinama obaju elemenata u serumu, urinu i kosi stanovnika tih triju sela. Izloženost lokalnog stanovništva taliju i uranu preko pitke vode općenito je bila niska. ICP-MS uspješno je izmjerio razine obaju elemenata u gotovo svim analiziranim uzorcima. Iako je bilo razlika u razinama obaju elemenata u uzorcima vode i biološkim uzorcima stanovnika, nijedan nije prešao maksimalnu dopuštenu granicu. Kosa je prethodno opisana kao izvrstan pokazatelj profesionalne ili okolišne izloženosti različitim elementima, no rezultati našeg ispitivanja nisu potvrdili njenu pouzdanost pri mjerenju talija i urana uslijed vrlo niskih koncentracija obaju elemenata, koje su često bile i ispod razine detekcije. Međutim, pokazali su kako uzorci urina mogu poslužiti kao vrlo dobri indikatori prisutnosti talija i urana u pitkoj vodi.
KLJUČNE RIJEČI:biološki uzorci, lokalni izvori vode, masena spektrometrija induktivno spregnutom plazmom, toksični metali
CORRESPONDING AUTHOR:
Mario Ćurković
Department of Family Medicine
Josip Juraj Strossmayer University of Osijek Medical School Josipa Huttlera 4, Osijek, Croatia