*Corresponding author:Shesh Ram ISSN: 0976-3031
Case Report
FLEXIBLE PAVEMENT ROUGHNESS ASSESSEMENT USING SMARTPHONE
ACCELEROMETER SENSOR APP
Shesh Ram and Suman S.K
Department of Civil Engineering, NIT Patna, Patna, Bihar, India
DOI: http://dx.doi.org/10.24327/ijrsr.2019.1001.3072
ARTICLE INFO ABSTRACT
Efficient road infrastructure maintenance and management depends on many factors, out of which the availability of updated pavement condition data is the most important. The International Roughness Index (IRI) is a standard parameter that is used to identify the condition of existing pavement surfaces with respect to the roughness. The aim of this paper is to focus on building an effective and low cost system for measuring the IRI. A light four wheeler vehicle was used to conduct the survey. Five numbers of smart phones with accelerometer sensor app is placed inside the vehicle at different positions to record vibration. Evaluation was carried out by using Auto Bump Integrator and accelerometer sensors simultaneously. Data was collected on the NH30 Patna, Bihar. Correlation between IRI and SRPSD (Square Root of Power Spectral Density) was established that depends on the transfer function, frequency and uniform speed of vehicle. It was found that a developed model is sufficient to find IRI value. Assessment of pavement roughness using proposed technique can be helpful enough in the context of low cost, easy to operate and can be implemented frequently.
INTRODUCTION
Surface roughness in a pavement is a type of deteriorations, which occurs due to poor quality of pavement layersmaterials, influence of environmental factors and continuous repetition of traffic loads. The roughness of the pavement surface can affect the ride quality and vehicle operating costs. With the accessibility of information on the topic of the road conditions, road users can be vigilant about or shun the bad roads. It is advantageous to have a device for detecting the condition of roads and acquire those roads for repairing as soon as possible. Maintaining and monitoring of road infrastructureis a challenging task for the Government road departments and agencies due to the lack of data. Database of road roughness for road network is very important for the systematic planning, scheduling, maintaining and monitoring of pavement condition. In the developing countries like India, there is a shortage of availability of sufficient funds and low cost technology. Therefore, the absence or shortage of data, appropriate planning and maintenance strategy are not taken into account. Several researchers are showing their interest to develop a low cost model and exploring the use of smart phone to measure the unevenness of existing road. Astarita, et al[1] demonstrated the use of simple application of Smartphone’s sensors to detect the surface unevenness in the form of potholes and bumps. Chugjh
et al[2] proposeda method using Smartphone equipped with sensors like accelerometer, and GPS in a mobile device for taking a detailed survey of an existing road as a cost effective tool and reducing the survey time. Du et al[3] focused on development a model for evaluating the IRI, as well as developed an effective and low-cost system for measuring the IRI. Using the concept of quarter-car model and the vehicle suspension caused by road unevenness, an important correlation between the -axis acceleration (time series data taken by accelerometer) and the IRI was established. Frutos & Castro[4] studied about the use of Smartphone sensors to record the data for maintaining the existing road and proves that the proposed method was very effective and low cost method. Lanjewar[7] used the Smartphone sensors for survey of an existing road to assuage the cost and time instead of road profiler system, based on the concept of VIMS and IRI. An algorithm was developed for detecting the auto bump and road surfaces roughness in every 100 meter section with acceleration time series data. Mahajan & Dange [8] proposed the idea about the estimation of road unevenness and Ghats’s complexity (number of turns) by using Smartphone sensors like accelerometer magnetometer and GPS. Vittorioet al[10]taken data of a road surface using android Smartphone equipped with sensors and developed an algorithm to detect the road bumps and pothole. Amir H. Alavi and William G.Buttlar[11]
Available Online at http://www.recentscientific.com
International Journal of
Recent Scientific
Research
International Journal of Recent Scientific Research
Vol. 10, Issue, 01(E), pp. 30504-30510, January, 2019
Copyright © Shesh Ram and Suman S.K, 2019, this is an open-access article distributed under the terms of the Creative Commons Attribution License, which permits unrestricted use, distribution and reproduction in any medium, provided the original work is properly cited.
DOI: 10.24327/IJRSR
CODEN: IJRSFP (USA)
Article History:
Received 06th October, 2018 Received in revised form 14th November, 2018
Accepted 23rd December, 2018 Published online 28th January, 2019
Key Words:
International Journal of Recent Scientific Research Vol. 10, Issue, 01(E), pp. 30504-30510, January, 2019
presented a comprehensive literature review of smart phone-centric research for the monitoring of civil infrastructure systems. An emphasis is placed on sensing capabilities of smartphones and their crowdsourcing power for monitoring several distinct civil infrastructure systems. ArtisMedniset al[12] described a mobile sensing system for road irregularity detection using Android OS based smart-phones. The performance analysis in context of different road irregularity classes shows true positive rates as high as 90%.Astarita Vittorio et al[13] stated that the use of a simple application for smartphones that employs two main sensors piggybacked on mobile devices. This study is expected to benefit both practitioners and researchers. GunjanChugh et al[14] stated that smartphone sensors are gaining importance in the field of pavement condition monitoring as they are cost effective and also increase scalability. Gurdit Singh et al[15] detected the road surface conditions using a smartphone based sensing and crowd sourcing technique. This technique shows better accuracy and efficiency. Vinicius M.A. Souza et al[16] stated that modern smartphones have a large variety of built-in sensors that can measure different information about users and the environment around them. This is useful for practitioners responsible for urban and highway maintenance, as well for regular drivers in the planning of better routes based on the pavement quality and comfort of the travel.Waleed Aleadelat and Khaled Ksaibati[17] researched new explanatory variables measured by using smartphones’ sensors to estimate PSI. Xiao Li and Daniel W. Goldberg [18] discussed a novel crowd sensing-based system for road surface assessment using smartphones. Field tests of the proposed system demonstrate that the condition of the road surface can be effectively identified and the transient events can be properly detected and located by mining the crowd sensed data.
The International roughness index is being used as a standard parameter for the measurement of road roughness of the existing roads. According to IRC: SP: 16[5], condition of road surface is rated as good when IRI<2.8, average when IRI = 2.8-4.08 and poor when IRI >2.8-4.08. The empirical relationship between BI and IRI is given in Equation 1.Where, BI= Bump Integrator (mm/km) and IRI=International Roughness Index (m/km).
= BI/720 (1) Pavement management system required a lot of pavement evaluation data for proper planning of infrastructure and treatments of road network. There are different types of roughness measuring equipment but they are costly, ineffectiveness and time consuming. The main objectives of this paper are (i) To conduct the roughness survey on the selected road and collect the data of auto bump integrator and accelerometer sensors placed inside the vehicle simultaneously and (iii)To develop a correlation between IRI and accelerometer sensors processed data in the form of root mean square of power spectral density for the road of Bihar in India. Automatic Bump Integrator
The automatic bump integrator is manufactured by Gauge Geotechniques at Roorkee, India. The distance, the Automatic road roughness recorder travel along the road is measured by recording the number of revolutions of the wheel. One revoliution of the wheel corresponds to one meter thus 1000
equals to 1km of road. A cam fitted to the hub of the wheel actuate a contact which closes the circuit. The contact of cluster has been processed and fed to the electronic microprocessor unit for counting purposes of each revolution of the wheel. An additional facility for automatic recording of longitudinal profiles of the road surface on the graphical form is also provided through use of a displacement sensor directly mounted on the vehicle, the movement of sensor feed to the microprocessor unit for directly recording the displacements calibrated in mm.
Figure 1 Automatic Bump Integrator
Quarter car (QC) model
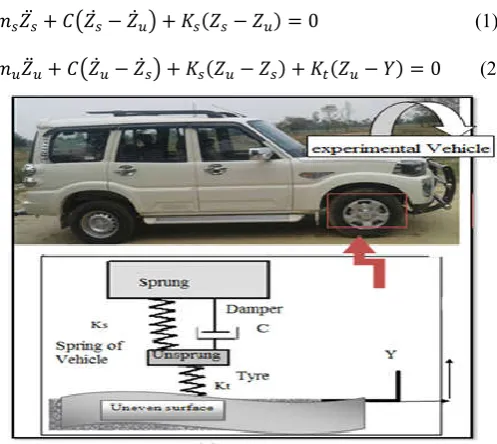
The most often employed and most useful model of a vehicle suspension system for developing a low-level controller for a vehicle suspension is the quarter-car model, in which only one quarter of the vehicle is taken into consideration[2]. The model is one-dimensional because only vertical movement of the vehicle ( direction) is considered. It comprises of a single wheel, which is represented in the form of spring and damper. The representation of a two-degree of freedom quarter-car model is illustrated in figure 1.
In this model, the parameter sprung and unsprung masses are and respectively at one corner of the vehicle. The suspension systems of the vehicle are denoted as by a linear spring stiffness and a linear damper with a damping rate , while the linear spring of stiffness of tire is . is the initial displacement of pavement. According to the Newton’s second law conservation of forces, which is obtained by drawing the free body diagram of quarter car and the following differential equation as indicated in Eqn. 1 and 2.
̈ + ̇ − ̇ + ( − ) = 0 (1)
̈ + ̇ − ̇ + ( − ) + ( − ) = 0 (2)
Shesh Ram and Suman S.K., Flexible Pavement Roughness Assessement Using Smartphone Accelerometer Sensor App
Power Spectral Density
The power spectral density (PSD) is a distribution of t signal's frequency content for the duration of the response. The integral of the PSD over a given frequency band computes the average power in the signal over such frequency band. It is a probabilistic approach, which is used to measure the mean square value of random variable. So, it is used for the analysis of random vibration, which gives the information about the power stored in a signal or time series data, which is distributed over different frequencies. The data taken of road is continuous and in randomso developed IRI obeys a zero mean Gaussian distribution. Define that x(t) as a specified range energy signal so, its energy E is also become in the specified range, which is given by
dt
t
x
E
2The Fourier transformation of above function is given by
x
t
e
i
t
dt
X
2
1
The energy of time domain signal is the same as the energy of Fourier domain signal. It can be demonstrated as:
x
d
dt
t
x
E
2
2
1
2
Where ׀ ( )׀ is called the energy density spectrum which represents the distribution of signal energy with respect to frequency data. And it is denoted by (ɯ
function of finite energy signal is defined as;
t
x
t
x
t
dt
xx
R
Where x(t) is represents the complex conjugate of x(t) now applying the Fourier transform of autocorrelation.
e
i
t
d
x
t
x
t
e
xx
R
(7)Putting
t
t
,
d
t
d
)
(t eitdt x t e it dt X X
x
(8)Where,Rxx
andSxx
are the Fourier transform pairs. Correlation between IRI and PSDTo establish the relationship between the vehicle movements response transmitted on the road surface and physical s the systems. It is clear that a QC model meets the condition of a LTI (linear time invariant) which can be classified into two
Flexible Pavement Roughness Assessement Using Smartphone Accelerometer Sensor App
The power spectral density (PSD) is a distribution of the signal's frequency content for the duration of the response. The integral of the PSD over a given frequency band computes the average power in the signal over such frequency band. It is a probabilistic approach, which is used to measure the mean value of random variable. So, it is used for the analysis of random vibration, which gives the information about the which is distributed over different frequencies. The data taken of road is continuous so developed IRI obeys a zero mean Gaussian distribution. Define that x(t) as a specified range energy signal so, its energy E is also become in the specified range, which is
(3)
formation of above function is given by
(4)
The energy of time domain signal is the same as the energy of Fourier domain signal. It can be demonstrated as:
(5)
is called the energy density spectrum which represents the distribution of signal energy with respect to ɯ) Auto correlation function of finite energy signal is defined as;
(6)
Where x(t) is represents the complex conjugate of x(t) now applying the Fourier transform of autocorrelation.
t
d
d
i
e
X 2
are the Fourier transform pairs.
To establish the relationship between the vehicle movements response transmitted on the road surface and physical state of the systems. It is clear that a QC model meets the condition of a LTI (linear time invariant) which can be classified into two
categories FIR and IIR for filtering process. Where, FIR refers the finite impulse response and IIR refers the infinite
response. Considering Y (t) is input in the form of systematic excitation,Zs
t andZu
tthe transmission property of LTI system to solve the frequency response function by the Laplace transform: From the equation (11) applying the Laplace transform.
s
t
i
e
s
Z
s
t
i
e
i
s
Z
.
s
t
i
e
s
Z
2
..
ei ts Ci ei ts Ks
s
m 2
K
C
i
s
m
s
t
i
e
2
2
s s
s
m
i
c
K
Z
t
K
s
K
u
m
u
Z
C
i
2
Now solving the equation (13) and ofZuand Zs,
u Z t K s K C i u m u
Z
2
K
t
m
u
Y
u
Z
2
Where,2
s
K
C
i
Similarly,t
YK
Ks
C
i
s
Z
)
(
K
t
i
C
K
s
Y
s
Z
t Zs
t Zu
tZ (17)
Kt i C Ks K t Y t Z
1
K
t
m
s
t
Y
t
Z
zy
H
2
After giving the initial excitement in the vehicle system, assume that the surface responses are random stationary variable and the output responses are in sprung and unsprung systems areFlexible Pavement Roughness Assessement Using Smartphone Accelerometer Sensor App
categories FIR and IIR for filtering process. Where, FIR refers the finite impulse response and IIR refers the infinite impulse response. Considering Y (t) is input in the form of systematic as systematic response, by using the transmission property of LTI system to solve the frequency lace transform: From the equation (11) applying the Laplace transform.
(9) (10) (11)
e its Cie itu Ke itu
i
C
K
s
u
t
i
e
s
K
(12)
s
.
u
i
C
K
Z
(13)
i
C
K
s
YK
t
s
Z
t
K
(14)Now solving the equation (13) and (14), calculating the value
t YK s K C i u m s K C i
u
2 ( 2 )
( (14)
i
C
K
s
(15)
2
2
s
K
C
i
t
K
s
K
C
i
u
m
(16)
Y
t
u
Z
t
Y
s
Z
t
Y
t
Z
s K C i s m tK
2
(18)
(19) After giving the initial excitement in the vehicle system,
International Journal of Recent Scientific Research Vol. 10, Issue, 01(E), pp. 30504-30510, January, 2019
t
H
z
s
y
Y
t
s
Z
t
H
z
u
y
Y
t
u
Z
t Zs
t Zu
tZ (20) Where, Z(t) is the output with relative response.
t
H
z
s
y
Y
t
H
z
u
y
Y
t
Z
t
K
t
m
s
Y
t
H
zy
Y
t
Z
2
(21)
LTI (Linear Time Invariant) systems is identifies, systematic response is also a random stationary variable, soS (ω) is a PSD of road surfaces thus evaluating PSD and mean square value of Z(t). Assumeing
H
zy
S
yy
zz
S
2
z
R
zz
H
zy
S
yy
d
2
0
2
(22)
The mean square value of the response represents the maximum response (amplitude).and it represents the size of signal amplitude because they are approximately same in a range and has linear auto correlation. Thus, the relation of IRI are given below
A
z
A
H
zy
S
yy
d
IRI
2
(23)
From the above equation, it is clear the relationship between the IRI and square root of pavement power spectral density. MATLAB used for auto correlating. According to the random process theory, = 2 , = /V and = V , and thus another expression for the Power Spectral Density (PSD) can be written as:
n vS x
xS 2
Where, V= speed of vehicle in km/hr.,Sx
= PSD in (dB/Hz).From the mathematics, it is clear that the Acceleration is the second derivative of the vertical displacement. It can be defined as:
S
a
v
x
S
4
... (24) Where, = frequency of signal (rad/sec), V= speed of vehicle in m/s, Sa
PSD of time series data taken by the Smartphone sensors (dB/Hz).
Sa dv zy
H A
z A IRI
4
2
(25)
Therefore, it can be observed that the relationship between the IRI and the SRPSD (square root of pavement power spectral density function) is linear. After coding in MATLAB, the SRPSD was obtained. Then, the measured acceleration values (time series data in the form of SRPSD) were auto correlated with the known actual road surface roughness values taken through the Auto Bump Integrator. Finally, the conversion formula between the measured acceleration values and correspond the IRI value has been estimated.
Experimental Program Study Area
Experiment was carried out on National Highways having number 30(NH30) from Toll Plaza Patna(25.507N) to Bakhtiyarpur(85.258E) having length 50kms.NH30is dual carriageway four lane road and it was constructed in year 2015. Properties of suspension system
Properties of suspension system of a vehicle is shown in Table 3.
Table 1 Properties of suspension system
Propertie Magnitude Sprung Mass,Ms (N) 2500
Unsprung Mass,Mu (N) 450
Tire Stiffness,Kt (N/m) 135000
Spring Stiffness,Ks (N/m) 2500
Damping Ratio,Cs (N*sec/m) 3000
Source: (Valaskovaa, Melcerb, & Lajcakovac, 2015)
Experimental process
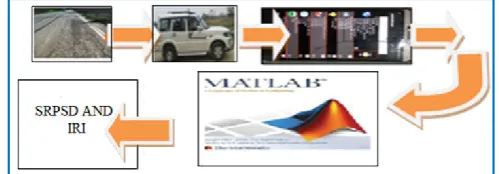
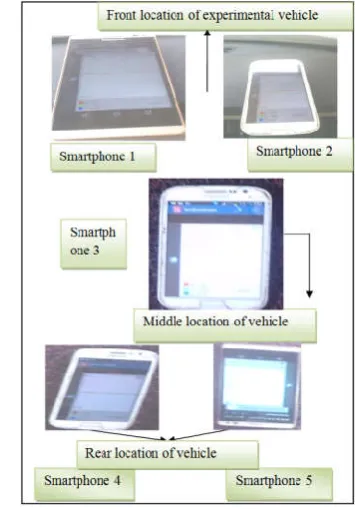
Pavement roughness evaluation was carriedout using auto bump integrator and accelerometer sensor mobile app placed inside the vehicle. Auto bump integrator was toed by the same vehicle in which mobiles are placed for measurement. Five numbers of mobiles were used and its placed position is shown in Figure 4.Measured and observed data are processed and analysed for developing the correlation between IRI and accelerometer data in the form of square root of power spectral density. Figure 3 shows the steps that have been followed during the estimation of IRI value.
Figure 2 Steps involved for development of model
RESULT AND DISCUSSION
Shesh Ram and Suman S.K., Flexible Pavement Roughness Assessement Using Smartphone Accelerometer Sensor App
Smartphone No.4 and Smartphone No.5 and (vii)Smartphone No.1, Smartphone No.2, Smartphone No.3, Smartphone No.4 and Smartphone No.5.
Linear regression analysis had been done in case-1 and inremaining cases multiple regression analysis was applied. In linear regression analysis R2 (Coefficient of determination) value has been adopted for best fit. In case of multiple regression analysis, adjusted R2 has been used. Model developed with different cases are indicated from Eqn, 26 to32. Case1: Model developed for Smartphone No.2.
IRI=0.341*SRPSD2+0.990 (26)
Case 2: Model developed for Smartphone No.1 and Smartphone No.2.
IRI=0.097*SRPSD1+0.264*SRPSD2+0.950 (27)
Case 3: Model developed for Smartphone No.2 and Smartphone No.4.
IRI=0.227*SRPSD2+0.174*SRPSD4+0.824 (28)
Case 4: Model developed for Smartphone No.2 and Smartphone No.5.
IRI=0.256*SRPSD2+0.146*SRPSD5+0.776 (29)
Case 5: Model developed for Smartphone No.2 Smartphone No.3 and Smartphone No.4.
IRI=0.193*SRPSD2+0.060*SRPSD3+0.161*SRPSD4+0.753 (30)
Case 6: Model developed for Smartphone No.1, Smartphone No.2, Smartphone No.4 and Smartphone No.5.
IRI=0.045*SRPSD1+0.157*SRPSD2+0.136*SRPSD4+0.104*S
RPSD5+0.689 (31)
Case 7: Model developed for Smartphone No.1, Smartphone No.2, Smartphone No.3, Smartphone No.4 and Smartphone No.5.
IRI=0.041*SRPSD1+0.153*SRPSD2+0.015*SRPSD3+0.135* SRPSD4+0.099*SRPSD5+0.678 (32) Summary of all cases
Summary of all cases on the basis of placing the smartphone inside the vehicle are shown in table (4). The summarization of this table is consisting of R2, adjusted R2, residual sum of square, residual mean square, percentage significance level, percentage of relative error. These parameters are related to the data fitting and their model. From the Table 4, it is clear that the value of R2 is maximum in case of 6and 7. But in both the cases multiple regressions have been used. So it can be compare on the basis of coefficient correlation (adjusted R2). The coefficient correlation is approximately same in both the cases; mean square for residual is same for both the cases, but the mean square for regression in case of 7 is less as compare to the case 6, but percentage of significance level is less than 95% in case of 7 for Smartphone No. 1 (94.127%) and for Smartphone No. 3 (43.274%). percentage of significance level is much less in the case of Smartphone No. 3. So if the Smartphone No. 3 is removed from the case 7 then it will became case No.6. In the Case No. 6 percentage relative error is less than 20%. So the model No. 6 is adopting. In the case No.6 all the Smartphone placed inside the vehicle above the
wheels. This model have appropriate limit of all parameter in regression analysis. The model is best fit with linear relationship between the observed IRI and Z-axis acceleration data. The percentage of relative error between the predicted IRI and observed IRI is less than 20%. And percentage of significance level for this model (Case No. 6) with each explanatory variable is more than 95%. All the output of all other remaining cases is not satisfactory.
Validation of the Model No.6.
Using the above model the predicted output in the form of IRI is obtained. The values of each independent parameter are putting in equation (31). The corresponding IRI has been also measured by Auto Bump Integrator. The maximum value of relative error is less than 20%. But the relative error for one kilometer is 23.745%. It is visualized that in one kilometer there are several culverts/ bridges. The validated data has been shown in table 4 with the rating condition of road.
Figure 3 Steps involved for development of model
CONCLUSION
An attempt has been made to explore the use of smartphone having acceleration sensor in efficient way to measure the road roughness. The adopted model is very effective and low cost. This technique is very innovative in nature and simple. The surveyor directly measured the Z-axis acceleration data and used the MATLAB coding for finding the SRPSD. And putting the value of SRPSD in the adopted model (Eq.33) and finally achieved the IRI for the corresponding road.
IRI=0.045*SRPSD1+0.157*SRPSD2+0.136*SRPSD4+0.104SR
PSD5+0.689 ... (33)
International Journal of Recent Scientific Research Vol. 10, Issue, 01(E), pp. 30504-30510, January, 2019
Developed model is applicable when vehicle driving speed is 20 to 30 kmph including minimum and maximum value of IRI is 1.643 and 6.090 respectively.
Reference
1. Astarita, V., Caruso, M. V., Danieli, G., Festa, D. C., Giofre, V. P., Iuele, T. (2012) A mobile application for road surface quality control: UNIqaALroad.SciVerse ScienceDirect , 1135-1144.
2. Chugjh, G., Bansal, D., & Sofat, S. (2014) Road Condition Detection Using Smartphone Sensors: A Survey. International journal of Electronics and Electrical Engineering , 595-602.
3. Du, Y., Liu, C., Wu, D., & Jiang, S. (2014) Measurement of International Roughness Index by Using -Axis Accelerometers and GPS. Hindawi Publishing Corporation Mathematical Problems in Engineering , 10.
4. Frutos, S. d., & Castro, M. (2014). Using smartphone as a very low-cost tool for road inventories. Transportation Research Part C , 136-145.
5. IRC: SP: 16:2004 Guidelines for surface evenness of highway Pavements. Indian road congress, New Delhi, First Revision.
6. Kumar, R. S. (2014) Pavement Roughness Measurement System.Pavement Evaluation and Maintenance Management System,Hyderabad,26-29.
7. Lanjewar, B., Khedkar, J., Sagar , R., Pawar, R., & Gosavi, K. (2015) Survey of Road Bump and Intensity Detection algorithum using Smartphones Sensors. International Journal of Computer Science and Information Technologies , 5133-5136.
8. Mahajan, d. V., & dange, T. (2015). Estimation of Road Roughness Condition by using sensors in smartphones. International Journal of Computer Engineering &Technology,41-49.
9. Valaskovaa, V., Melcerb, J., & Lajcakovac, G. (2015) Moving load effect on pavements at random excitation. ScienceDirect , 815-820.
10. Vittorio, A., Rosolino, V., Teresa, I., Vittoria, C. M., P., G. V., & Francesco, D. M. (2014) Automatedsensing systemfor monitering of road surface quality by mobile devices. EWGT2013-16th Meeting of the EURO Working Group on Transportation calabaria: Science Direct,242-251.
11. Amir H. Alavi and William G.Buttlar (2019) An overview of smartphone technology for citizen-centered, real-time and scalable civil infrastructure monitoring, Future Generation Computer Systems,93,651-672. 12. Artis Mednis, Girts Strazdins, Reinholds Zviedris,
Georgijs Kanonirs, Leo Selavo(2011) Real Time Pothole Detection using Android Smartphones with Accelerometers, IEEE, DOI: 10.1109/DCOSS. 2011. 5982206.
13. Astarita Vittorio, Vaiana Rosolino, Iuele Teresa, Caruso Maria Vittoria, Giofrè Vincenzo P., De Masi Francesco(2014) Automated sensing system for monitoring of road surface quality by mobile devices, EWGT 2013 – 16th Meeting of the EURO Working Group on Transportation, Procedia - Social and Behavioural Sciences 111 , 242 – 251.
14. Gunjan Chugh, Divya Bansal, Sanjeev Sofat (2014) Road Condition Detection Using Smartphone Sensors: A Survey, International Journal of Electronic and Electrical Engineering, Volume 7, Number 6, pp. 595-602
15. Gurdit Singh, Divya Bansal, Sanjeev Sofat, Naveen Aggarwal (2017) Smart patrolling: An efficient road surface monitoring using smartphone sensors and crowd sourcing, Pervasive and Mobile Computing,40,71-88. 16. Vinicius M.A. Souza, Rafael Giusti, Antônio J.L. Batista
(2018) Asfault: A low-cost system to evaluate pavement Table 2 Summary of validation data
IRI=0.045*SRPSD1+0.157*SRPSD2+0.136*SRPSD4+0.104SRPSD5+0.689
Smart phone1
Smart phone2
Smartp hone4
Smartp hone5
Observed
IRI Predicted
Residual/ Error
Percentage relative
error
Rating for Observed
IRI
Rating for Predicted
IRI
3.779 5.715 3.640 5.897 2.305 2.251 0.054 2.388 G G 4.149 3.329 4.963 4.490 2.208 2.073 0.135 6.511 G G 6.686 5.528 5.378 5.889 2.860 2.589 0.270 10.445 A G 6.077 5.986 5.471 5.506 2.588 2.646 0.058 2.189 G G 4.695 5.136 3.126 4.383 2.356 2.132 0.224 10.503 G G 4.144 3.377 4.128 4.881 1.631 1.967 0.336 17.062 G G 5.887 5.050 5.346 4.853 2.190 2.474 0.284 11.473 G G 4.771 4.157 4.118 3.545 2.619 2.116 0.503 23.745 G G 3.418 3.677 4.709 3.939 2.393 2.060 0.333 16.147 G G 3.644 3.540 3.536 4.220 1.704 1.890 0.186 9.853 G G 5.796 4.791 3.121 4.919 2.302 2.127 0.175 8.230 G G
Table 3 Summary of all cases
Case R2 Adjusted R2 SS MS significance level Percentage relative error Percentage Regression Residual
Shesh Ram and Suman S.K., Flexible Pavement Roughness Assessement Using Smartphone Accelerometer Sensor App
conditions in real-time using smartphones and machine learning, Pervasive and Mobile Computing,51,121-137. 17. Waleed Aleadelat and Khaled Ksaibati (2017)
Estimation of Pavement Serviceability Index through Android-Based Smartphone Application for Local Roads, Transportation Research Record: Journal of the Transportation Research Board, No. 2639, pp. 129–135.
18. Xiao Li and Daniel W. Goldberg (2018) Toward a mobile crowd sensing system for road surface assessment, Computers, Environment and Urban Systems, 61, 51-62.
How to cite this article:
Shesh Ram and Suman S.K. 2019, Flexible Pavement Roughness Assessement Using Smartphone Accelerometer Sensor App. Int J Recent Sci Res. 10(01), pp.30504-30510. DOI: http://dx.doi.org/10.24327/ijrsr.2019.1001.3072