A b s t r a c t. Thin layer drying characteristics of dill leaves under fixed, semi-fluidized, and fluidized bed conditions were studied at air temperatures of 30, 40, 50, and 60°C. In order to find a suitable drying curve, 12 thin layer-drying models were fitted to the experimental data of the moisture ratio. Among the applied mathematical models, the Midilliet al. model was the best for drying behavior prediction in thin layer drying of dill leaves. To obtain the optimum network for drying of dill leaves, various numbers of multilayer feed-forward neural networks were made and tested with different numbers of hidden layers and neurons. The best neural network feed-forward back-propagation topology for the prediction of drying of dill leaves (moisture ratio and drying rate) was the 3-45-2 structure with the training algorithm trainlm and threshold functions logsig and purelin. The coefficient of determination for this topology for training, validation, and testing patterns was 0.9998, 0.9981, and 0.9990, respectively. Effective moisture diffusivity of dill leaves during the drying process in different bed types was found to be in the range from 7.10 10-12to 1.62 10-10m2s-1. Also, the values of activation energy were de-termined to be between 75.435 and 80.118 kJ mol-1.
K e y w o r d s: drying kinetics, dill leaves, neural networks, mathematical model
INTRODUCTION
Drying is rated as an important post-harvest process for foods and fruits with respect to high consumption of energy and quality concerns. The final and major purpose is to mini-mize water activity and reduce microbial and chemical reactions. Sun drying is still used for drying fruits and vege-tables in spite of considerable drawbacks such as long dry-ing time, pollutions, product deterioration, and unwanted damage. These drawbacks are sufficient enough to substi-tute industrial and technological trends for drying in order to guarantee demands and preserve the quality (Doymaz, 2007).
In the fluidized bed drying method, the drying time is redu-ced rather than in the fixed bed method, due to the high heat and mass transfer between warm air and products (Giner and Calvelo, 1987). The advantages of fluidized bed drying are high heat and mass transfer rates, uniform temperature and bulk moisture content of particles, and excellent tempera-ture control and operation up to the high ratio of mass of air to mass of product (Izadifar and Mowla, 2003). Fluidization is defined as suspending the vegetable bed (dill leaves, Anethum sowaL.) in air flow. With gradually increasing air-flow through a bed of vegetable, fixed bed, minimum fluidized bed (semifluidized bed), bubbling fluidized bed and transpor-tation will be created, respectively (Chayjanet al., 2011).
Several authors had attempted to determine mathema-tical models for estimation of the moisture ratio and drying rate of food and biological materials during the drying pro-cess inegpotato (Bakalet al., 2011),Cuminum cyminum (Zomorodian and Moradi, 2010), carrot (Doymaz, 2004), sweet cherry (Doymaz and Ismail, 2011), and berberies (Gorjianet al., 2011). Some researchers have studied the ef-fective moisture diffusion and energy of activation in a thin layer drying of different agricultural products such as squash seeds (Chayjanet al., 2011), onion slices (Pathare and Sharma, 2006), or milky mushroom (Arumuganathanet al., 2009).
The neural network method has advantages compared to the common statistical and exact methods. This method, unlike linear regression models, does not force the values to be around the average value and therefore maintains the actual data variability. The neural network architecture con-sists of numerous simple and interrelated processors, namely neurons, and its structure is inspired by human brain (Alborzi, 2003). Factors such as temperature, airflow velocity, and Int. Agrophys., 2013, 27, 39-47
doi: 10.2478/v10247-012-0066-y
Drying kinetics of dill leaves in a convective dryer
A. Motevali
1*, S. Younji
2, R. Amiri Chayjan
3, N. Aghilinategh
2, and A. Banakar
41
Department of Engineering, Shahre Rey Branch, Islamic Azad University, Tehran, Iran 2
Department of Mechanical Engineering, Hamedan Branch, Islamic Azad University, Hamedan, Iran 3Department of Agricultural Machinery Engineering, Bu-Ali Sina University, Hamedan, Iran 4
Department of Agricultural Machinery, Agricultural Faculty, Tarbiat Modares University,Tehran, Iran Received December 1, 2011; accepted April 30, 2012
© 2013 Institute of Agrophysics, Polish Academy of Sciences *Corresponding author e-mail: [email protected]
A A
Agggrrroooppphhyhyysssiiicccsss
duration of product exposure to the dryer exert an effect on the thin layer drying process (moisture ratio and drying rate) in different bed-type dryers (fixed, semifluidized, and fluidi-zed). According to the dependent and independent variables in this research, no accurate relationship could be establi-shed, using the common methods, among these variables. Using the neural network models, the relationship between dependent and independent variables could be easily mo-deled for the process of drying dill leaves. Although much information has been reported about the mathematical model, neural networks, effective moisture diffusivity, and activation energy for various agricultural products, very little information is available on the mathematical model, neural networks, effective moisture diffusivity, and activation ener-gy for dill leaves during fixed, semi fluidized, and fluidized convective drying.
The main aim of this research was to determine the acti-vation energy and effective moisture diffusivity of dill leaves with a high moisture content for fixed, semi fluidized, and fluidized bed thin layer drying process.
MATERIAL AND METHODS
The drying experiments were conducted using a labora-tory fluidized bed dryer. A centrifugal fan with an electrical motor (0.375 kW) supplied the required air flow. An electri-cal heating supply unit with 2 kW was designed to heat the inlet air. The drying chamber was drum type with the dia-meter and height of 150 and 320 mm, respectively. Input air temperature control was carried out by a thermostat with
±0.1°C accuracy (Atbin mega, made in Iran). Input air flow
was performed using an inverter with ±0.1 Hz accuracy (Vincker VSD2, made in Taiwan). Relative humidity of input air was measured by a hygrometer with accuracy of ±3% RH (Lutron TM-903, made in Taiwan). Measuring and recording of fluidization characteristics of bed material (air velocity against pressure drop) was performed using Standard ST-8897 (made in China). The accuracy of this device was
±0.1 Pa and ±0.1 m s-1, in measuring differential pressure
and air velocity, respectively. With regard to the thin layer drying condition and the dryer chamber area, about 6 g dill
leaves (Anethum sowaL.) were used in the drying
experi-ments. Fluidization curve has a minimum fluidized bed which its pressure drop against air velocity is maximum value. Fresh dill leaves were purchased from a local market. The leaf samples were stored in a refrigerator at 3±1°C. Air relative humidity and ambient air temperature during drying changed from 25 to 35% and 27 to 33°C, respectively. Input air temperature to the chamber was recorded during the
experiments using a thermometer with accuracy of ±0.1°C
(Lutron TM-903, made in Taiwan). Four air temperature levels of 30, 40, 50, and 60°C were selected to apply in the experiments. Moreover, with respect to three bed conditions, a total of 12 experiments were performed. The sample weight was recorded during the experiments using a digital
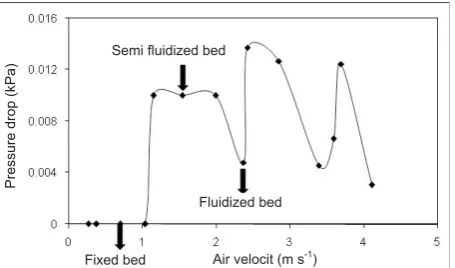
balance (AND GF-6000, made in Japan) with ±0.01 g accu-racy. The weight measuring interval was 2 min. The initial moisture content of dill leaves was determined using a gra-vimetric method at 60°C for 24 h. The initial moisture content of dill leaves was 0.833 (d.b.). The final moisture content of the leaves after the drying process was about 0.06±0.01 (w.b.). In order to determine pressure drops and airflow velocities of the dill leaves at the outlet, simulta-neously, the fan speed was increased gradually using the inverter (Vincker VSD2) and the parameters were recorded. A differential digital manometer (Testo 505-P1) and a vane type digital anemometer were used for measuring static pressure loss and outlet air velocity, respectively. The maxi-mum value of static pressure drop versus the specific air velocity in fluidization systems is defined as the minimum fluidization point or semifluidized bed (Kunii and Levens-piel, 1991). After determining the semi fluidized bed with
air velocity of about 0.7 m s-1, one point before it (in fixed
bed domain) was selected as a fixed bed condition with air
velocity of 1.54 m s-1and one point after that (in fixed bed
domain) was selected as a fluidized bed condition with air
velocity of 2.37 m s-1 and the drying experiments were
conducted (Fig. 1).
Kinetic models are commonly developed based on the
moisture ratio (MR) normally characterized by centering
attribute and better illustration.MRis defined as Eq. (1):
MR M M
M M
t e
o e
=
-- , (1)
where:Mtis the moisture content (kgwaterkg-1dry matter) and
MeandMoare equilibrium and primary moisture contents,
respectively. Considering a negligible value ofMewith
re-spect toMoandMt, the error of eliminatingMefrom Eq. (1)
will be ignorable. Thus, Eq. (1) can be rewritten as Eq (2):
MR M
M
t
o
= . (2)
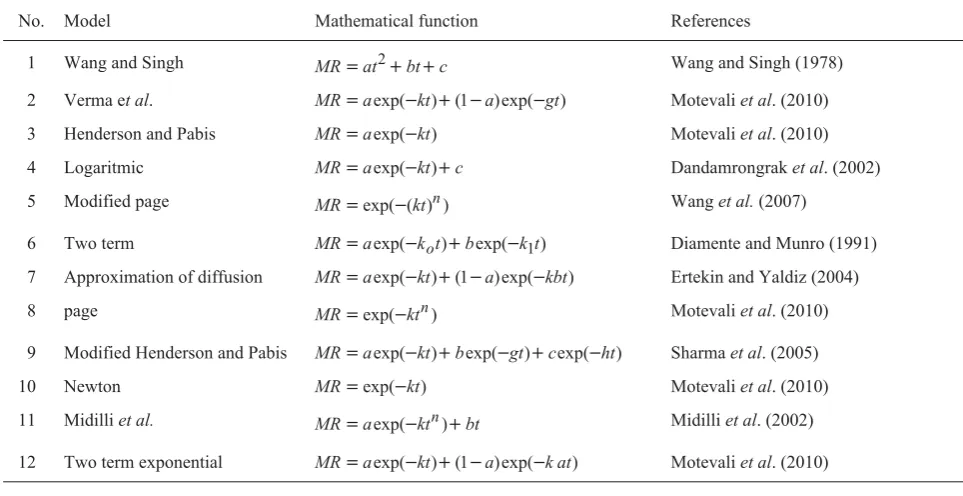
MATLAB 2007, the curve fitting toolbox environment, was employed to run standard drying curve fitting (Table 1) to the experimental data. It lists some of the standard models
Fig. 1.Fluidization curve of dill leaves and selected points for mo-deling: a – fixed bed (0.7 m s-1), b – semi fluidized bed (1.54 m s-1), c – fluidized bed (2.37 m s-1).
Semi fluidized bed
Fluidized bed
Fixed bed Air velocit (m s-1)
Pressure
drop
for thin layer drying of agricultural products. Figure 2 illu-strates the structure of a multi layer feed-forward (MLFF) back-propagation ANN model for predicting the moisture ratio and drying rate of dill leaves during fixed, semi-fluidi-zed and fluidisemi-fluidi-zed bed drying. First, different networks with different amounts of layers were used for this modeling. The dimensions of the input and output matrices were 3×910 and 2×910, respectively. The total amounts of the network input patterns are 910, which first were normalized and then were randomly divided into three groups, namely training (60%), validation (30%), and testing (10%). The dimensions of the matrices for the three input patterns (training, validation, and testing) were 2×637, 2×182, and 2×91, respectively. In this research, the multilayer perceptron (MLP) networks with feed forward back propagation (FFBP) were used. This
network is simple but at the same time highly practical due to its high accuracy. Various threshold functions, such as sig-moid (logsig), logarithmic (tangsig), and linear (purelin), and supervised learning algorithms, such as trainlm algo-rithm (Levenberg-Marquardt (LM)), traincsg, traingdx, trainrp, were used and their results were compared to deter-mine the best structure for predicting the thin layer drying of dill leaves. Effective moisture diffusion was calculated as:
MR D t
L
eff
= æ
-è ç ç
ö
ø ÷ ÷ 8
4
2
2
2
p
p
exp , (3)
where:MR– the moisture ratio (dimensionless),t– drying time,
Deff – effective moisture diffusivity (m2s-1), andL–
thick-ness of dill leaves (m). Equation (3) has been used by many
No. Model Mathematical function References
1 Wang and Singh MR=at2+ +bt c Wang and Singh (1978)
2 Verma et al. MR=aexp(- + -kt) (1 a)exp(-gt) Motevaliet al. (2010) 3 Henderson and Pabis MR=aexp(-kt) Motevaliet al. (2010)
4 Logaritmic MR=aexp(- +kt) c Dandamrongraket al. (2002)
5 Modified page MR=exp( ( ) )-ktn Wanget al.(2007)
6 Two term MR=aexp(-k to )+bexp(-k t1) Diamente and Munro (1991) 7 Approximation of diffusion MR=aexp(- + -kt) (1 a)exp(-kbt) Ertekin and Yaldiz (2004)
8 page MR=exp(-ktn) Motevaliet al. (2010)
9 Modified Henderson and Pabis MR=aexp(- +kt) bexp(- +gt) cexp(-ht) Sharmaet al. (2005)
10 Newton MR=exp(-kt) Motevaliet al. (2010)
11 Midilliet al. MR=aexp(-ktn)+bt Midilliet al. (2002)
12 Two term exponential MR=aexp(- + -kt) (1 a)exp(-k at) Motevaliet al. (2010) T a b l e 1.Standard models reported in the literature used for drying of agricultural products
Time
Temperature
Bed type
MR DR
Input layer Layer
of hidden neurons
Layer of hidden neurons
Output layer
investigators to describe the effective moisture diffusivity coefficient (Doymaz, 2007). In this process, the thickness of dill leaves,L, is assumed to be constant.
Energy of activation was calculated as:
D D E
T
eff o a
abs
= æ
-è ç ç
ö ø ÷ ÷
exp
Rg , (4)
where:Do– indicates Arrhenius coefficient (m2s-1),Ea–
acti-vation energy (kJ mol-1),Tabs– absolute temperature (K),
and Rg – universal gas constant (8.3143 J mol-1K-1). RESULTS AND DISCUSSIONS
The required time for drying of dill leaves in different dryer bed types (fixed, semi-fluidized, and fluidized) is shown in Fig. 3. As shown in the following figures, in each bed type, with increasing temperature, the drying duration decreases since the thermal gradient inside the medium and the crop moisture evaporation rate increase. Also, at a con-stant temperature, increasing airflow velocity and changing
crop bed type during drying, the drying duration decreases. This is because with increasing the airflow velocity, the en-vironmental pressure decreases and consequently the inter-nal moisture content faces little resistance in coming out and comes out at higher rates. Similar results were reported by other researchers (Chayjan et al., 2011; Motevali et al., 2010, 2011a, 2011b).
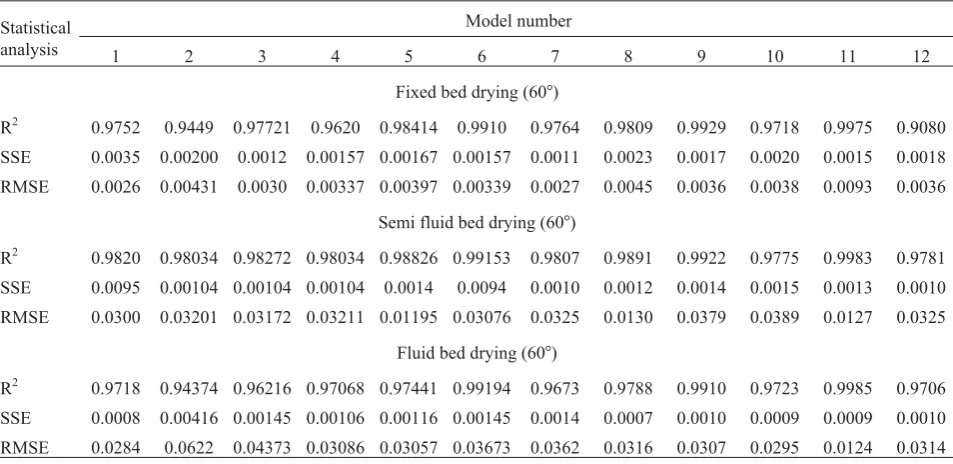
The initial moisture content of dill leaves was 73.1 on wet basis (w.b.). The moisture ratio (MR) values at different temperatures and bed types were obtained using the Eq. (2). TheMRvalues obtained were fitted with the models pre-sented in Table 1. Then the accuracy of different thin layer drying models was evaluated according to R2, SSE, and RMSE values, and the best model with the highest R2and the lowest SSE and RMSE was selected. The results ob-tained from fitting of the laboratory data with the proposed models showed that the Midilliet al. model predicts the drying process of dill leaves more accurately than the other mo-dels. The statistical coefficients and indices at the highest ac-curacy for different models at 60°C are presented in Table 2.
Fig. 3.Thin-layer drying curves of dill leave: A – fixed bed, B – semi fluid bed, C – fluid bed.
A B C
Statistical analysis
Model number
1 2 3 4 5 6 7 8 9 10 11 12
Fixed bed drying (60°)
R2 0.9752 0.9449 0.97721 0.9620 0.98414 0.9910 0.9764 0.9809 0.9929 0.9718 0.9975 0.9080 SSE 0.0035 0.00200 0.0012 0.00157 0.00167 0.00157 0.0011 0.0023 0.0017 0.0020 0.0015 0.0018 RMSE 0.0026 0.00431 0.0030 0.00337 0.00397 0.00339 0.0027 0.0045 0.0036 0.0038 0.0093 0.0036
Semi fluid bed drying (60°)
R2 0.9820 0.98034 0.98272 0.98034 0.98826 0.99153 0.9807 0.9891 0.9922 0.9775 0.9983 0.9781 SSE 0.0095 0.00104 0.00104 0.00104 0.0014 0.0094 0.0010 0.0012 0.0014 0.0015 0.0013 0.0010 RMSE 0.0300 0.03201 0.03172 0.03211 0.01195 0.03076 0.0325 0.0130 0.0379 0.0389 0.0127 0.0325
Fluid bed drying (60°)
R2 0.9718 0.94374 0.96216 0.97068 0.97441 0.99194 0.9673 0.9788 0.9910 0.9723 0.9985 0.9706 SSE 0.0008 0.00416 0.00145 0.00106 0.00116 0.00145 0.0014 0.0007 0.0010 0.0009 0.0009 0.0010 RMSE 0.0284 0.0622 0.04373 0.03086 0.03057 0.03673 0.0362 0.0316 0.0307 0.0295 0.0124 0.0314
T a b l e 2.Optimum statistical criteria obtained from fitting experimental data to the predefined models
1 2 3 4
1 2 3 4 3 4
2
1 3 4
Activation function
Neurons in hidden R2 MSE
Epoch
layer1 layer2 training validation test training validation test
Trainlm
Log/Tan 5 0 0.9906 0.9895 0.9894 0.0085 0.0108 0.0154 62
Log/Tan 20 0 0.9967 0.9977 0.9972 0.0049 0.0062 0.0190 32
Log/Tan 30 0 0.9973 0.9896 0.9956 0.0040 0.0201 0.0077 21
Log/pure 45 0 0.9998 0.9981 0.9990 0.0054 0.0055 0.0067 66
Log/pure 35 0 0.9997 0.9990 0.9979 0.0021 0.0086 0.0133 86
Log/Tan/Tan 10 10 0.9966 0.9974 0.9980 0.0063 0.0047 0.0168 24
Log/Tan/Tan 35 20 0.9982 0.9973 0.9975 0.0031 0.0110 0.0123 27
Log/Tan/Tan 40 10 0.9985 0.9952 0.9978 0.0027 0.0175 0.0051 17
Log/Pure/pure 10 30 0.9994 0.9947 0.9943 0.0025 0.0152 0.0070 110
Log/Pure/pure 40 30 0.9992 0.9989 0.9978 0.0055 0.0072 0.0057 26
Log/Pure/pure 15 15 0.9991 0.9918 0.9976 0.0028 0.0116 0.0121 22
Traingdx
Log/Tan 5 0 0.9431 0.9418 0.9278 0.0314 0.0348 0.0469 62
Log/Tan 25 0 0.8953 0.8832 0.8704 0.0579 0.0686 0.0829 54
Log/Tan 45 0 0.8865 0.8787 0.8389 0.0615 0.067 0.1008 16
Log/pure 35 0 0.9155 0.9206 0.8917 0.0484 0.0416 0.0647 35
Log/pure 15 0 0.8737 0.8679 0.8675 0.0628 0.0744 0.0612 55
Log/Tan/Tan 10 5 0.6990 0.7227 0.6953 0.1487 0.1334 0.1477 39
Log/Tan/Tan 25 15 0.7353 0.7253 0.7366 0.1326 0.1448 0.1424 17
Log/Tan/Tan 40 25 0.7776 0.7272 0.7045 0.1345 0.1848 0.1757 13
Log/Pure/pure 15 10 0.7719 0.7800 0.7575 0.1192 0.1316 0.1137 29
Log/Pure/pure 30 30 0.8772 0.8846 0.8608 0.0691 0.0773 0.0693 31
Log/Pure/pure 45 25 0.9451 0.9122 0.8945 0.0214 0.0676 0.0455 33
Trainrp
Log/Tan 10 0 0.9787 0.9798 0.9779 0.0142 0.0216 0.0164 123
Log/Tan 35 0 0.9862 0.9681 0.9730 0.0098 0.0228 0.0215 151
Log/Tan 50 0 0.9705 0.9634 0.9632 0.0151 0.0265 0.0229 59
Log/pure 45 0 0.9829 0.9907 0.9860 0.0141 0.0073 0.0112 97
Log/pure 25 0 0.9951 0.9963 0.9970 0.0066 0.0060 0.0188 139
Log/Tan/Tan 35 20 0.9725 0.9837 0.9740 0.0210 0.0101 0.0140 66
Log/Tan/Tan 50 25 0.9872 0.9915 0.9620 0.0110 0.0072 0.0234 59
Log/Tan/Tan 20 45 0.9783 0.9861 0.9827 0.0175 0.0085 0.0136 126
Log/Pure/pure 15 10 0.9958 0.9872 0.9850 0.0048 0.0166 0.0139 179
Log/Pure/pure 25 15 0.9834 0.9744 0.9713 0.0120 0.0209 0.0213 154
Log/Pure/pure 40 30 0.9850 0.9781 0.9609 0.0101 0.0195 0.0258 204
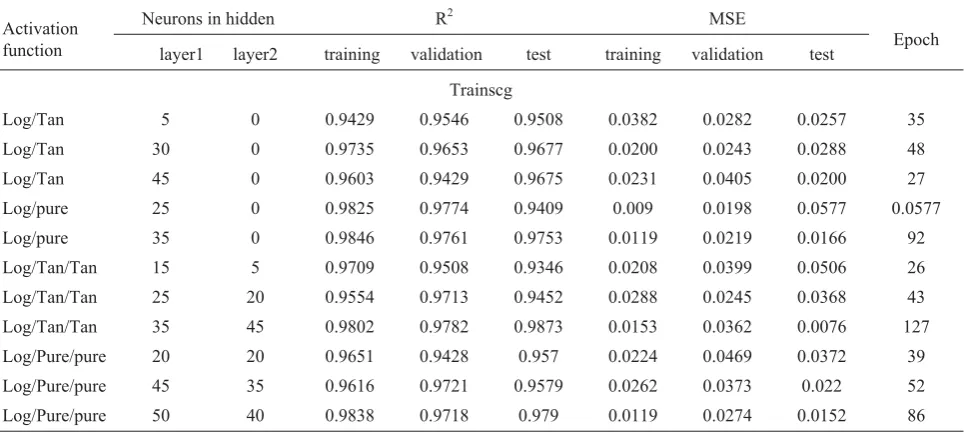
Table 2 summarizes a list of the best neural network topology structure, threshold functions, and different
ap-plied algorithms in predictingMRandDRfor drying of dill
leaves. As shown in the mentioned table, most applied topo-logies and threshold functions have proper training and vali-dation errors. In fact, it could be asserted that the neural net-works are a powerful tool for modeling of drying of dill leaves in different conditions, which have a high accuracy and low cost and time. The main reason of neural networks convergence might be the large amount of the network input patterns.
Among the different topologies presented in Table 3, the neural network with 3-45-0-2 structure, logsig and pu-relin transfer functions, and the Levenberg-Marquardt train-ing algorithm (trainlm) had the lowest error and the highest coefficient of determination. Figure 4 shows the training cur-ve (error) and the network for the training, validation, and
testing stages for the best network. The network errors (MSE) for training, validation, and testing patterns of this topology are 0.0054, 0.0055, and 0.0067, respectively. This network becomes convergent through 66 epochs in 3.383 s with an error of training equals to 0.00229. The regression analysis
showed that R2for training, validation, and testing patterns
was 0.9998, 0.9981, and 0.9990, respectively.
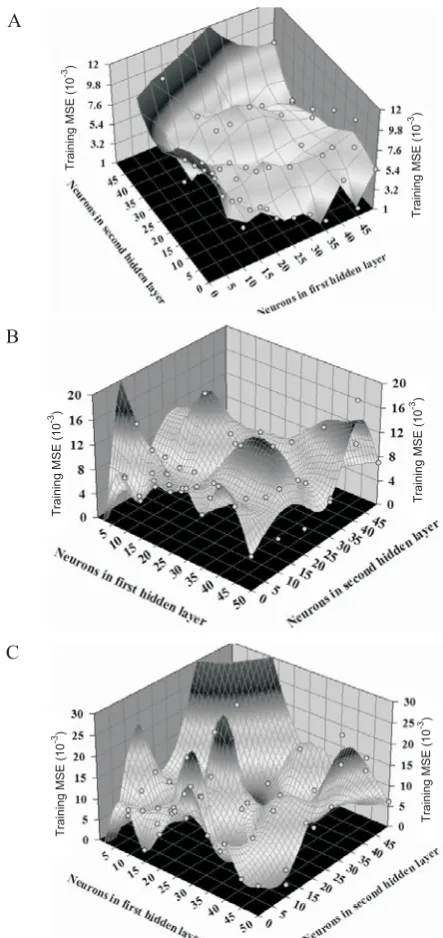
Figure 5 indicates MSE variations in regard to varia-tions in the number of neurons at the middle layer for purelin and logsig transfer functions and the Levenberg-Marquardt training algorithm (trainlm) in training, validation, and test-ing, respectively. Generally, according to Fig. 5, it could be stated that the increasing number of neurons at the middle layer decreases the network error. But the network's con-vergence duration increases. Figure 6 shows the convergen-ce duration with the epoch changes for the best network with 2-45-0-2 topology. Also, the diagram other axis shows the gradient descent changes with epoch. As it is shown, the gradient descent decreases as the epoch increases, so that it reaches its minimum at epoch 66 and the network becomes convergent with the desired topology. In order to compare the output results of the best mathematical model (Midilli
et al. model) with the results from the neural network, a
li-near fitting (regression) was performed on the dependent parameters of drying of dill leaves. The comparison between the moisture ratios obtained from the experiment and the moisture ratios predicted by the model, in different tested ing temperatures and bed types, is presented in Fig. 7 for dry-ing of dill leaves. As shown in the figure, a line at angle of 45 is fitted to data, which shows the accuracy of the Midilliet al. model in predicting dill leaves moisture ratio variation for different dryer bed types (fixed, semi-fluidized, fluidized).
Activation function
Neurons in hidden R2 MSE
Epoch
layer1 layer2 training validation test training validation test
Trainscg
Log/Tan 5 0 0.9429 0.9546 0.9508 0.0382 0.0282 0.0257 35
Log/Tan 30 0 0.9735 0.9653 0.9677 0.0200 0.0243 0.0288 48
Log/Tan 45 0 0.9603 0.9429 0.9675 0.0231 0.0405 0.0200 27
Log/pure 25 0 0.9825 0.9774 0.9409 0.009 0.0198 0.0577 0.0577
Log/pure 35 0 0.9846 0.9761 0.9753 0.0119 0.0219 0.0166 92
Log/Tan/Tan 15 5 0.9709 0.9508 0.9346 0.0208 0.0399 0.0506 26
Log/Tan/Tan 25 20 0.9554 0.9713 0.9452 0.0288 0.0245 0.0368 43
Log/Tan/Tan 35 45 0.9802 0.9782 0.9873 0.0153 0.0362 0.0076 127
Log/Pure/pure 20 20 0.9651 0.9428 0.957 0.0224 0.0469 0.0372 39
Log/Pure/pure 45 35 0.9616 0.9721 0.9579 0.0262 0.0373 0.022 52
Log/Pure/pure 50 40 0.9838 0.9718 0.979 0.0119 0.0274 0.0152 86
T a b l e 3.Continuation
0.001 0.01 0.1 1
0 10 20 30 40 50 60 70
Epoch
M
ea
n
S
q
u
a
re
d
E
rr
o
r(M
S
E
)
Training Validation Test
Fig. 4.Training error curve.
Epoch
Mean
squared
error
(MSE) Training
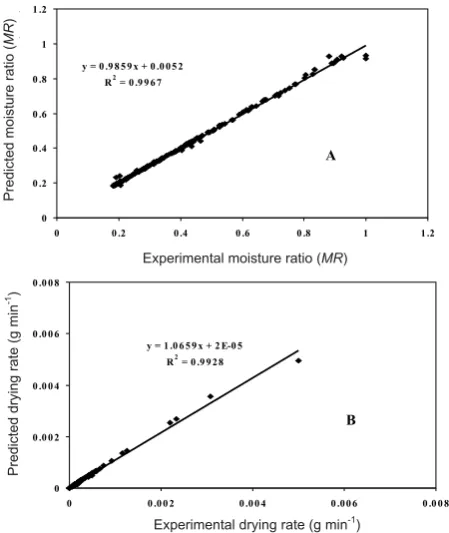
The residuals plot seen in Fig. 8 was also used to eva-luate the Midilliet al. model. Plotting the residuals against the predicted values of the dimensionless moisture ratio, there were no systematic patterns. The proximity of resi-duals around zero line shows the sufficiency of the derived model. Figure 9 indicates the regression analysis for the ve-rification test of theDRandMRparameters in drying of dill leaves in different drying conditions using the neural net-works. The R2value forDRandMRwas 0.9967 and 0.9928, respectively, and MSE for these parameters was minimal.
Comparison of Figs 7 and 9 demonstrates that both ne-ural networks and mathematical models have good accuracy in modeling the process of drying dill leaves. But since the number of variables (inputs and outputs) in the neural net-works is higher than the mathematical models and also since the modeling duration is shorter in neural networks, it could be concluded that the neural networks are a powerful tool in modeling different drying conditions for dill leaves.
Figure 10 displays natural logarithms of the moisture ratio ln(MR) against time (second) at constant airflow veloci-ty and different temperature levels. As shown in every figure, drying of dill leaves occurs only as a course with a de-scending rate, and this means that liquid diffusion is the stimulus controlling the drying process. Therefore, all the curves are in the form of straight lines. Effective moisture diffusivity is calculated using the line slope method and represented in Table 4. With increasing air temperature and velocity (changing the drying bed from the fixed to the fluidized state), the relative moisture content of dill leaves was decreased due to higher mass and heat transfer within Fig. 5.Effect of the number of hidden neurons in the 1st and 2nd
layers on learning: A – performance, B – validation, C – test of ANN models.
Fig. 6.Variation of time and gradient decend with epoch.
C
y = 0.9984x + 0.0006 R2= 0.9985
0 0.2 0.4 0.6 0.8 1
0 0.2 0.4 0.6 0.8 1
Moisture ratio (experimental) A
y = 0.9966x + 0.0016 R2
= 0.9972
0 0.2 0.4 0.6 0.8 1
0 0.2 0.4 0.6 0.8 1
Moisture ratio (experimental)
M
o
is
tu
re
ra
ti
o
(p
red
ict
ed
)
B
y = 0.9985x + 0.0003 R2= 0.9983
0 0.2 0.4 0.6 0.8 1
0 0.2 0.4 0.6 0.8 1
Moisture ratio (experimental)
.
Fig. 7.Comparison between the experimental moisture ratios and those predicted by the Midilliet al.model in the: A – fixed bed, B – semi fluid bed, C – fluid bed.
A
B
C
Training
MSE
(10
-3)
Training
MSE
(10
-3)
Training
MSE
(10
-3)
Training
MSE
(10
-3)
Training
MSE
(10
-3)
Training
MSE
(10
the dryer. Calculations proved that effective moisture diffu-sivity was highly correlated with hot air temperature and bed types (velocity). The trend demonstrated in Fig. 10 shows that at each drying bed type, effective moisture diffusivity increases as the air temperature increases, so that the highest air velocity (fluidized bed) and temperature levels resulted in the highest effective moisture diffusivity. Plot of ln(Deff)
versus 1/T is presented in Fig. 11. The activation energy for dill leaves was calculated by means of linear regression. The maximum and minimum values of activation energy during the drying (fixed, semi-fluidized, and fluidized bed) process
were obtained as 75.435-80.118 kJ mol-1.
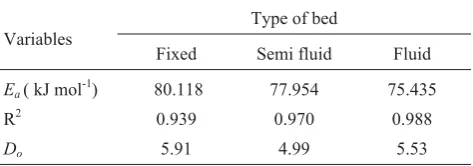
According to Table 5, increasing air velocity and chang-ing the dill bed type durchang-ing drychang-ing increases the activation energy amount. This behavior could be due to the aerodyna-mic effects according to the specific flow pattern as well as changes in the dill bed type during drying from the fixed state to the fluidized state.
CONCLUSIONS
1. The drying process of dill leaves was comprehen-sively investigated in this research. Several pretreatments and types of drying bed were employed to achieve a precise
idea of drying of dill leaves. Furthermore, the Midilliet al.
model fitted best to the experimental data compared to the other standard models reported on drying of agricultural products.
2. The analysis of the experimental data in the three drying bed types by the ANN revealed that there was a good correlation between the ANN-predicted results and the ex-perimental data. Therefore, ANN proved to be a useful tool for correlation and simulation of fixed, semi-fluidized, and fluidized drying bed parameters in the case of dill leaves. Generally, ANN proved to be a reliable alternative for sour cherries thin-layer drying prediction due to its generality and simplicity.
3. Moisture diffusivity increased as air temperature and velocity (changing from the fixed bed to the fluidized drying bed) increased. Also, the activation energy increased with increasing air velocity (changing from the fixed bed to the fluidized drying bed).
Fig. 8.Residuals versus predicted values of the moisture ratio derived by multiple.
A y = 0 .9 8 5 9 x + 0 .0 0 5 2
R2= 0 .9 9 6 7
0 0 .2 0 .4 0 .6 0 .8 1 1 .2
0 0 .2 0 .4 0 .6 0 .8 1 1 .2
Expe rime ntal mois ture ratio (M R )
P
r
e
d
ic
te
d
m
o
is
tu
r
e
r
a
tio
(M
R
)
B y = 1 .0 6 5 9 x + 2 E-0 5
R2= 0 .9 9 2 8
0 0 .0 0 2 0 .0 0 4 0 .0 0 6 0 .0 0 8
0 0 .0 0 2 0 .0 0 4 0 .0 0 6 0 .0 0 8
Expe rime ntal D rying R ate (g min-1)
P
r
e
d
ic
te
d
d
r
y
in
g
r
a
te
(g
m
in
-1)
Fig. 9.Correlation between the experimental data and the predicted values of the ANN model for prediction of: A – moisture ratio, B – dry-ing rate (g min-1).
Fig. 10.Plot of ln(MR) versus time (s) at the: A – fixed bed, B – semi fluid bed, C – fluid bed.
Predicted moisture ratio
Residual
Experimental moisture ratio (MR)
Experimental drying rate (g min-1
)
Predicted
moisture
ratio
(
MR
)
Predicted
drying
rate
(g
min
-1)
A B C
1 2 3 4
1 2
3 4
4 3
2
1 2 3 4
REFERENCES
Alborzi M., 2003. Introduction with Neural Networks. Sharif
University of Technology Press, Tehran, Iran.
Arumuganathan T., Manikantan M.R., Rai R.D., Anandaku-mar S., and Khare V., 2009.Mathematical modeling of drying kinetics of milky mushroom in a fluidized bed dryer. Int. Agrophys., 23, 1-7.
Bakal S.B., Sharma G.P., Sonawane S.P., and Verma R.C.,
2011.Kinetics of potato drying using fluidized bed dryer.
J. Food Sci. Technol., DOI 10.1007/s13197-011-0328-x.
Chayjan R.A., Salari K., Abedi Q., and Sabziparvar A.A., 2011.
Modeling moisture diffusivity, activation energy and speci-fic energy consumption of squash seeds in a semi fluidized and fluidized bed drying. J. Food Sci. Technol., DOI 10.1007/s13197-011-0399-8.
Dandamrongrak R., Young G., and Mason R., 2002.Evaluation of various pre-treatments for the dehydration of banana and selection of suitable drying models. J. Food Eng., 95, 139-146.
Diamente L.M. and Munro P.A., 1991.Mathematical modeling of hot air drying of sweet potato slices. Int. J. Food Sci. Technol., 26, 99-109.
Doymaz I., 2004.Convective air drying characteristics of thin layer carrots. J. Food Eng., 61, 359-364.
Doymaz I., 2007.Influence of pretreatment solution on the drying of sour cherry. J. Food Eng., 78, 591-596.
Doymaz I. and Ismail O., 2011.Drying characteristics of sweet cherry. Food Bioprod. Proces., 89, 31-38.
Ertekin C. and Yaldiz O., 2004.Drying of eggplant and selection of a suitable thin layer drying model. J. Food Eng., 63, 349-359.
Giner S.A. and Calvelo A., 1987.Modeling of wheat drying on fluidized beds. J. Food Sci., 52, 1358-1363.
Izadifar M. and Mowla D., 2003.Simulation of a cross-flow con-tinuous fluidized bed dryer for paddy rice. J. Food Eng., 58, 325-329.
Kunii D. and Levenspiel O., 1991. Fluidisation Engineering. Butterworth-Heinemann, London, UK.
Midilli A., Kucuk H., and Yapar Z., 2002.A new model for single-layer drying. Drying Technol., 20(7), 1503-1513.
Motevali A., Minaei S., Khoshtaghaza M.H., and AmirnejatH.,
2011a. Comparison of energy consumption and specific
energy requirements of different methods for drying mush-room slices. Energy, 36, 6433-6441.
Motevali A., Najafi G.H., Abbasi S., Minaei S., and Ghaderi A., 2011b.Microwave-vacuum drying of sour cherry: compa-rison of mathematical models and artificial neural networks. J. Food Sci. Technol., DOI 10.1007/s13197-011-0393-1.
Motevali A., Minaei S., Khoshtaghaza M.H., Kazemi M., and Nikbakht A.M., 2010.Drying of pomegranate arils: compa-rison of predictions from mathematical models and neural networks. Int. J. Food Eng., 6(3), Article 15, 1-19.
Pathare P.B. and Sharma G.P., 2006.Effective moisture diffu-sivity of onion slices undergoing infrared convective drying. Biosyst. Eng., 93, 285-291.
Wang C.Y. and Singh R.P., 1978.Use of variable equilibrium moisture content in modeling rice drying. Trans. ASAE, 11, 668-672.
Wang Z., Sun J., Liao X., Chen F., Zhao G., Wu J., and Hu X., 2007.Mathematical modeling on hot air drying of thin layer apple pomace. Food Res. Int., 40, 39-46.
Zomorodian A. and Moradi M., 2010.Mathematical modeling of forced convection thin layer solar drying forCuminum
cymi-num. J. Agri Sci. Tech., 12, 401-408. Temperature
(°)
Type of bed
Fixed R2 Semi fluid R2 Fluid R2
30 7.10 10-12 0.988 9.13 10-12 0.984 1.04 10-11 0.996
40 1.01 10-11 0.997 1.51 10-11 0.997 2.07 10-11 0.996
50 5.07 10-11 0.994 5.07 10-11 0.985 6.09 10-11 0.990
60 1.01 10-10 0.981 1.32 10-10 0.925 1.62 10-10 0.994
T a b l e 4.Effective moisture diffusivity and R2values at various air temperature and bed drying
-27 -26 -25 -24 -23 -22
2.9 3 3.1 3.2 3.3 3.4
(1/T)* 1000
ln
(D
ef
f
)
Fix Bed
Semi Fluid Bed
Fluid Bed
Fig. 11.Effect of bed types on the activation energy in thin-layer drying of dill leaves.
Variables
Type of bed
Fixed Semi fluid Fluid
Ea( kJ mol-1) 80.118 77.954 75.435
R2 0.939 0.970 0.988
Do 5.91 4.99 5.53
T a b l e 5.Activation energy and related correlation coefficient at different bed drying for thin-layer drying of dill leaves
1/T 1000
ln
(
Deff
)
Fix bed
Semi fluid bed