NSW PUBLIC HEALTH
BULLETIN
Healthy, just and eco-sensitive cities:
moving forward
GUEST EDITORS
Jane M. Dixon
A,Cand Anthony G. Capon
A,BANational Centre for Epidemiology and Population Health, The Australian National University
BAustralian Health Policy Institute, The University of Sydney
CCorresponding author. Email: [email protected]
…there should be more equality in the use of cities, and in
the distribution of costs and benefits to their people.1
A quarter of a century ago, historian Hugh Stretton1 put
forward an ‘impressionistic’ treatise – Ideas for Australian cities– that foreshadowed a major issue confronting today’s urban planners, health planners, ecologists and social geog-raphers: what values underpin alternative ways of city living? How this question is answered, he said, would illu-minate the practical efforts needed to address the gulf in living conditions between rich and poor.
An important recent academic development has been the systematic incorporation of an equity perspective into urban health analyses.2–5These studies reveal how particular urban
configurations generate not only a substantial burden of disease but an unjust patterning of disease.
Inspired by Stephen Boyden’s ecological approach to under-standing urban settlements,6 the first special issue on this
topic in the NSW Public Health Bulletin (Vol. 18, Issue 3–4) provided a series of frameworks laying out the health chal-lenges posed by postindustrial cities. This issue builds on that perspective, with contributors exploring the systems thinking, urban planning, research and governance approaches that are needed to achieve Stretton and Boyden’s shared vision of a more equitable distribution of the costs and benefits of city living.
The papers in this issue
Beginning from the premise that the obesity epidemic is an effect of a complex ecological system, Newell and
col-leagues first provide an introduction to systems thinking and then apply this to an analysis of obesity in our society. Their examples highlight how policy makers concerned with obesity are required to operate outside their immediate portfolios and to work together on the interplay between the characteristics of human populations and the localities in which they live.
Strazdins and Loughrey make a strong plea to consider time as a system variable that contributes to population health and environmental problems and solutions. As Strazdins
argued at the 2006 Fenner Conference, Urbanism,
Environment & Health, if urban designs increase time demands, they are likely to have unanticipated health costs, disadvantaging those in the community who are busiest.7
Berry argues for more research on the urban system’s unforseen impacts on mental health. Like Raphael and Wooding,8 Berry concludes that we do not know which
urban configurations contain greater mental and emotional stresses. She proposes an original schema for examining urban living and mental health relationships, providing a useful template for organising future research.
The three papers that follow offer different examples of urban design approaches that have the potential to improve the physical and mental health of city inhabitants. Carlisle for the National Heart Foundation of Australia (Victorian Division) describes Healthy by Design, the result of collab-oration between the National Heart Foundation and various stakeholders representing the planning, recreation, health,
w w w. p u b l i s h . c s i r o. a u / j o u r n a l s / p h b CONTENTS – See back page
Cities, sustainability and health – part 2
Vol. 18(11–12) • November–December 2007
210 | Vol. 18(11–12) NSW Public Health Bulletin
transport and community building sectors. The tool aims to arrest the ‘activity transition’ (diminished activity levels) underway in modern societies, which is caused in part by car use and sedentary leisure pursuits.9
Cozens addresses an issue raised by Berry and others10
regarding the relationship between poor mental health and physical and social incivilities, which include derelict housing, graffiti, vandalism and fear of crime. Cozens describes Western Australia’s Crime Prevention Through Environmental Design framework. He suggests that Crime Prevention Through Environmental Design has the poten-tial to enhance urban sustainability because it encourages holistic thinking about the likely impacts of the built environment on personal safety and security, and public well-being.
Giles-Corti and colleagues describe an ambitious, prospective evaluation for another planning tool adopted by the Western Australian government. Like Healthy by Design, the Liveable Neighbourhood Community Design Codefocuses on physical activity. The evaluation’s multi-level, multi-variable and longitudinal nature is entirely sympathetic with the systems perspective advocated by other contributors.
Urban design and urban nutrition
In his keynote address at the 2006 Fenner Conference, Larry Frank provided evidence that the built environment is an important predictor of physical activity.11 Much
of the discussion at the conference was focussed on urban design interventions to address the physical activity transition.
We would commend urban design approaches that also address the urban ‘nutrition transition’ (diets high in meat and fats, as well as sugar and refined carbohydrates, and low in vegetables and legumes). There are numerous reasons for this dietary transition,12–14including the
sym-biotic relationship between an industrialised food supply and the way urban living is associated with occupational patterns less compatible with home food production and consumption.
Not only is population health compromised by an indus-trial food system, so is the biophysical environment. Traditionally, cities have been the launching pad for the nutrition transition because they contain large numbers of affluent consumers. Cities that are highly dependent on food from outside their region or country are imposing a greater ecological footprint than those that are relatively self-sufficient in food. In part, this is due to the high water and feed input requirements of, and greenhouse emissions incurred by, the staples of urban diets: red meat and dairy food.15In addition, the dominant model of food
distribu-tion based on air and road transport systems generates
carbon emissions which increase in volume with the dis-tance that foods travel, or their ‘food miles’.16
It is important to remember that local food systems existed until quite recently. Less than 50 years ago in Australia, large numbers of suburban residents produced vegetables, fruit and eggs in their backyards: the most accessible and affordable food source we know. Delivery vans plied sub-urban streets with milk, fish and bread, augmenting what was not being home produced. This convenient provision-ing strategy was supplemented by walks to the local, sub-urban strip of shops, which supplied mainly fresh foods sourced from city wholesale markets and local bakeries. As in other countries, Australia’s strip shops have mostly disappeared due to the dominance of the supermarket oli-gopoly,17 and urban design that has made cars, and not
pedestrians, the primary consideration.
Ethnographic evidence suggests that what can be called ‘car-centred diets’ are becoming more pervasive. They range across a continuum from fast-food snacks to the several-times-a-week consumption of heat-and-serve meals, through to the festive meal based on imported and local ingredients sourced from across-town specialist provi-dores.18Moreover, commercial food deliveries are skewed
in favour of fast food, with auto-delivered pizza being an easier option than deliveries of fruit and vegetables.19
However, a small renaissance is underway in local food production, distribution and shopping possibilities. Most Australian capital cities now have community food gardens attached to public high-rise buildings, schools or local government run allotments. These are readily acces-sible to nearby residents and offer cheap produce in return for the labour and other inputs from participants. They are the logical replacement to the backyard garden given that many inner and outer suburban dwellings now have little space for cultivation. In addition, farmers’ markets and community-supported agriculture schemes allow city people to engage directly with the food producer. As Whitelegg,20who recently designed a sustainable food
dis-tribution hub for the City of London, has argued, feeding cities in a sustainable and equitable fashion requires the relocalisation of production and distribution.
The human health benefits of a more sustainable food system were recently highlighted in an article on livestock production, climate change and health. If consumers in industrialised countries halved their dietary intakes of red meat, then not only would agriculture’s share of green-house emissions decline but consumer health would improve through reductions in risk of ischaemic heart disease, obesity and colorectal cancer.21There are
Healthy, just and eco-sensitive cities
While there is little research linking psycho-social condi-tions (stress and depression) and the nature of the food supply, the idea of gastro-anomie has dominated food sociology for 20 years now.22According to Fischler, the
concept’s progenitor, this condition afflicts societies which lose connection to their agricultural and culinary systems through embracing corporatist food systems.23Discontent
and anxiety arise when eating is reduced to individual health and nutrients rather than being about shared enjoy-ment and social cohesion.24
Some years ago, Susan Parham argued that town planners could ameliorate conditions like gastro-anomie by design-ing-in opportunities for conviviality, rather than leaving people’s eating experiences to the market and their socio-economic status. She recommended the use of gastronomic maps to plot the relationship of people to their food environ -ment,25and for local governments to work with residents to
improve access to pleasurable food experiences. More recent studies support her conjecture that access to cafes and fresh food markets are unequally distributed.26,27The
popu-larity of farmers’ markets and community-supported agri-culture schemes, and the demand for organic food growing at 15% annually,28reflect a desire by middle classes at least
to reclaim some mastery over the food supply.
Sustainable urban agriculture with a health equity focus is high on the agenda for the Western Sydney consortium pursuing the application of Health Impact Assessment as part of the Sydney Metropolitan Strategy. Their inspiration is drawn from initiatives like the Hawkesbury Harvest in Sydney’s northwest, which is beginning to demonstrate how sustainable agriculture has the potential to contribute to long-term triple bottom line outcomes.29,30 See also
www.hawkesburyharvest.com.au.
Conclusion
The emerging evidence about relationships between our urban environments and contemporary health problems presented in these two special issues could usefully inform supplementary decision support tools with a focus on pop-ulation health. What has been largely neglected are design considerations that support urban agriculture and edible landscapes,19locally and regionally centred food
distribu-tion systems, ecologically sustainable supply chains for rural products, and enhanced opportunities for consumers to access enjoyable food experiences. A paddock-to-plate refashioning of the urban and agri-food interface would benefit from the National Heart Foundation’s Healthy by Designapproach to physical activity.
We would be well on our way to achieving Stretton and Boyden’s ideas for just, healthy and sustainable Australian cities if the suggestions described in this issue for urban research, planning tools and design approaches were adopted.
Acknowledgements
The authors acknowledge financial support from the Australian Academy of Science for the 2006 Fenner Conference on the Environment. Additional financial support for the Conference was received from The Australian National University, Sydney West Area Health Service, Commonwealth Scientific and Industrial Research Organisation, the Australian Government’s Department of Environment and Heritage, Australian Ethical Investment Ltd and Public Health Association of Australia Inc.
References
1. Stretton H. Ideas for Australian cities. 2nd ed. Melbourne: Georgian House, 1975.
2. Frumkin H, Frank L, Jackson R. Urban sprawl and public health. Designing, planning and building for healthy communi-ties. Washington: Island Press, 2004.
3. Valery P, Williams G, McWhirter W, Sleigh A, Scott D. Electronic telephone directory listings: preferred sampling frame for a population-based study of childhood cancer in Australia.Ann Epidemiol2000; 10: 504–8. doi:10.1016/ S1047-2797(00)00070-3
4. Vlahov D, Gibble E, Freudenberg N, Galea S. Cities and health: history, approaches, and key questions.Acad Med
2004; 79: 1133–8. doi:10.1097/00001888-200412000-00003
5. Freudenberg N, Galea S, Vlahov D. Cities and the health of the public. Nashville: Vanderbilt University Press, 2006.
6. Boyden S, Millar S, Newcombe K, O’Neill B. The ecology of a city and its people. Canberra: Australian National University Press, 1981.
7. Strazdins L. Designs of the time: work, families and sustain-able cities. In: Urbanism, Environment and Health, Australian Academy of Science Fenner Conference on the Environment. Canberra, 2006. At http://nceph.anu.edu.au/Fenner2006/ presentation_pdfs/Friday/Strazdins_Fenner%202006.pdf, accessed 19 October 2007.
8. Raphael B, Wooding S. Mental health and the built environ-ment. In Johnson C, editor. Healthy Environments. Sydney: Government Architect’s Publication, 2004. pp. 78–87.
9. Pretty J, Griffin M, Sellens M, Pretty C. Green exercise: complementary roles of nature, exercise and diet in physical and emotional well-being and implications for public health policy. Colchester: University of Essex, 2003.
10. Doran B, Lees B. Investigating the spatiotemporal links between disorder, crime, and the fear of crime.Prof Geogr
2005; 57: 1–12.
11. Frank L. Within the urbanism framework, what significance is accorded to health? In: Urbanism, Environment and Health, Australian Academy of Science Fenner Conference on the Environment. Canberra, 2006.
12. Mendez M, Popkin B. Globalization, urbanization and nutritional change in the developing world.JADE2004; 1: 220–41.
13. Dixon J, Friel S, Omwega A, Donati K, Burns C, Carlisle R.
Theme Paper: The health equity dimensions of urban food systems. Kobe, Japan: Knowledge Network on Urban Settings, WHO Kobe Centre, 2006.
212 | Vol. 18(11–12) NSW Public Health Bulletin
15. McMichael T, Bambrick H. Meat consumption trends and health: casting a wider risk assessment net.Public Health Nutr
2005; 8: 341–3. doi:10.1079/PHN2005742
16. Kjellstrom T, Friel S, Dixon J, Corvalan C, Rehfuss E, Campbell-Lendrum D et al. Urban environmental health hazards and health equity.J Urban Health2007; 84(Suppl. 1): 86–97.
17. Burch D, Lawrence G, editors. Supermarkets and Agri-food Supply Chains: Transformations in the Production and Consumption of Foods. Cheltenham: Edward Elgar, 2007.
18. Banwell C, Dixon J, Hinde S, McIntyre H. Fast and slow food in the fast lane: automobility and the Australian diet. In: Wilk R, editor. Fast food/slow food. The economic anthropology of the global food system. Berkeley: AltaMira Press, 2006.
19. Webb K, King L. Food, nutrition and the built environment. In: Johnson C, editor. Healthy environments. Sydney: Government Architect’s Publication, 2004. pp. 48–55.
20. Whitelegg J. London sustainable food hub: opportunities for a sustainable food logistics centre in London. London: Sustain, 2005.
21. McMichael A, Powles J, Butler C, Uauy R. Food, livestock production, energy, climate change, and health. Lancet 2007; 370: 1253–63.
22. Mennell S, Murcott A, van Otterloo A. The sociology of food, eating, diet and culture. London: Sage, 1992.
23. Fischler C. A nutritional cacophany or the crisis of food selection in affluent societies. In: Leatherwood P, Horisberger M, James W, editors. For a better nutrition in the 21st century. New York: Vevey/Raven Press, 1993. pp. 57–65.
24. Scrinis G. Engineering the food chain.Arena Magazine2005; 77: 37–9.
25. Parham S. The table in space. A planning perspective.Meanjin
1990; 49: 213–9.
26. Burns C, Inglis A. The relationship between the availability of healthy and fast food and neighbourhood level socio-economic deprivation: A case study from Melbourne, Australia.Obes Rev
2006; 7: 39.
27. O’Dwyer L, Coveney J. Space, place and access to food. Adelaide: Health Promotion South Australia, 2005.
28. Apted S, Mazur K. Potential impacts from the introduction of GM canola on organic farming in Australia. ABARE research report 07.11. Canberra: ABARE, 2007.
29. Mason D, Docking A. Agriculture in urbanising landscapes. A creative planning opportunity. Agri-Food ’05. Yeppoon, Queensland, 2005. At http://www.agfoodgroup.gov.au/ publications/NSW%20Department%20of%20Primary %20Industries.pdf, accessed 19 October 2007.
Further information and useful resources
NSW Premier’s Council for Active Living
The NSW Premier’s Council for Active Living (PCAL) aims to strengthen physical and social environments to enable active living. The PCAL comprises representatives from government agencies, business and the community sector. It was established in 2004, building on the work of the NSW Physical Activity Taskforce from 1996 and reports to the Premier through the Minister for Health. PCAL’s priorities include healthy urban planning, community inclusion and the liveability of NSW cities and towns. It provides advice to government and promotes guidelines, policy, and legislation to increase the level of physical activity of all people in NSW.
Designing Places for Active Livingis a free PCAL web-resource which provides design considerations for walking and cycling routes, public transport, streets, open spaces and shopping centres as well as links to references and other resources for more detailed guidelines and specifications. The resource is directly applicable for strategic planning, transport planning, road and traffic design, open space recreation planning and health planning. Further information is available at
www.pcal.nsw.gov.au.
World Health Organization’s Healthy Cities program
The World Health Organization’s Healthy Cities program engages local governments in health development through a process of political commitment, institutional change, capacity building, partnership-based planning and innovative projects. It has a special emphasis on health inequalities and urban poverty, the needs of vulnerable groups, participatory governance and the social, economic and environmental determinants of health. Healthy Cities is a global movement, with networks in all six WHO regions. Further information and resources are available from www.euro.who.int/healthy-cities.
World Health Organisation Centre for Health Development, Kobe Japan
Over the next ten years, the research programme of the WHO Kobe Centre is focussed on urbanization and health equity. Through its project on “Healthy Urbanization: Optimizing the impact of social determinants of health on exposed populations in urban settings”, the Centre will contribute to the generation of new knowledge and stimulate action to confront the issue of health inequity in urban settings in both developing and developed countries. For further details of the field research sites see http://www.who.or.jp/sites/sites.html.
US Centers for Disease Control and Prevention’s Healthy Places initiative
The Centers for Disease Control Healthy Places initiative supports the design and development of healthy environments. The Centers for Disease Control facilitates a Listserv that addresses issues related to health and the built environment. A regular e-newsletter that includes relevant news articles, latest research, other publications, and updates on conferences and events related to liveability is sent to all subscribers. Further information and resources, including details of how to join the Listserv, are available from www.cdc.gov/healthyplaces.
Active Living by Design
Active Living by Design is a program of the Robert Wood Johnson Foundation, based at the School of Public Health, University of North Carolina at Chapel Hill. The program establishes innovative approaches to increase physical activity through community design, public policies and communications strategies. Further information and resources are available from www.activelivingbydesign.org.
Sustain
Based in London, Sustain advocates food and agriculture policies and practices that: enhance the health and welfare of people and animals; improve the working and living environment; promote equity; and enrich society and culture. It represents around 100 public interest organisations working at international, national, regional and local level. Among other roles, Sustain advises and negotiates with governments and other regulatory agencies to ensure that legislation and policies on food and agriculture are publicly accountable and socially and environmentally responsible. Its website contains research reports, popular publications and details of community campaigns: http://www.sustainweb.org/.
The Slow Cities movement
This movement consists of cities that are committed to improving the quality of life of their citizens, especially with regard to food issues. Slow Cities are cities which implement an environmental policy designed to maintain and develop the characteristics of their surrounding area and urban fabric, placing the onus on recovery and reuse techniques. They encourage the production and use of foodstuffs produced using natural, eco-compatible techniques, excluding transgenic products, and setting up, where necessary, presidia to safeguard and develop typical products under threat of extinction. Further information is available from www.matogmer.no/slow_cities__citta_slow.htm.
David Mason’s blog
The blog began as a diary of an eight week international study tour of urban agriculture undertaken as a Winston Churchill Fellow. The website is being developed as an international point of reference for those interested in agriculture in urban and urbanising environments. It is structured to provide a systemic appreciation of urban agriculture. See the useful linkages and resources at http://www.urbanagricultureworldwide.com/.
214 | Vol. 18(11–12) NSW Public Health Bulletin
It is likely that the obesity epidemic is a ‘systems effect’. That is, there are good reasons to believe that it has emerged from interactions between the variables that char-acterise human physiology and psychology, and those that characterise urban environments.1,2 Interactions of this
kind are dominant in such human–urban systems and can give rise to unexpected and unwanted policy outcomes.3In
these circumstances it is not useful to look for the main cause of a management problem. Instead it is necessary to develop hypotheses about significant causal links between key system variables. In particular, it is necessary to move beyond thinking in terms of ‘causal chains’ to develop an ability to see ‘causal loops’.
Causal loops are prevalent in complex systems and give rise to ‘feedback’ behaviour, where the effects of a change act to amplify or oppose the original change. Feedback can generate stubborn management problems. To attack such problems, managers and policy makers must have ways to (a) investigate the causal structure of complex systems, (b) identify possible feedback mechanisms and the behav-iours they drive, and (c) identify ‘leverage points’ where
Seeing obesity as a systems problem
Abstract: Obesity has reached epidemic
propor-tions in many countries and persists despite con-tinuing efforts to find solutions. Such ‘stubborn problems’ often signal the influence of ‘feedback systems’. In the case of the obesity epidemic, this possibility can be investigated using available system analysis tools. The investigation must begin with a study of the interplay between the full range of human and environmental factors. This paper outlines the nature of feedback and briefly dis-cusses some of its management implications. A practical way to initiate a ‘systems approach’ to the obesity problem is suggested and four princi-ples to guide the management of complex human– environment systems are presented.
Barry Newell
A,C, Katrina Proust
A,
Robert Dyball
Aand Phil McManus
BAFenner School of Environment and Society,
The Australian National University
BSchool of Geosciences, University of Sydney
CCorresponding author. Email: [email protected]
pressure on selected system variables (or the severing of selected causal links) will produce the desired outcomes. These are the elements of a ‘systems approach’.
Feedback and its effects
The ‘behaviour’ of a human–urban system, the way that its variables change over time, emerges from interactions between these variables.4–6When a change in the value of
a system variable is amplifiedby the system, the effect is called ‘positive feedback’. The term ‘positive’ indicates only that changes are reinforced – it does not mean that the effects are necessarily good. Positive feedback effects are sometimes called runaway effects, bandwagon effects or vicious circles. They can lead to exponential growth or collapse.
When a change is opposed by the system the effect is called ‘negative feedback’. Negative feedback effects work to hold system variables at established levels, thus stabilising the system. Note that the term ‘negative’ indi-cates only that changes are resisted – it does not mean that the effects are necessarily bad. The various homeostasis mechanisms that maintain stable conditions inside the human body are all examples of ‘good’ negative feedback.
These effects can be illustrated using ‘causal loop dia-grams’ (the commentary associated with each of the fol-lowing three figures explains how to approach a causal diagram). Figure 1 provides an example of a systems effect that is commonly called ‘policy resistance’ – a major cause of stubborn problems. The diagram can be read as follows: a desire for a high level of outdoor activity leads to an increase in the amount of open space preserved in the neighbourhood. Open space increases the popularity of the area. Increased popularity leads to a demand for addi-tional housing. Finally, the demand for new housing leads to development pressures that can result in a reductionin the availability of open space. In this case, a possible lever-age point involves breaking one of the links in the feed-back loop – for example, the policy resistance can be removed if the pressure to develop open space is resisted.
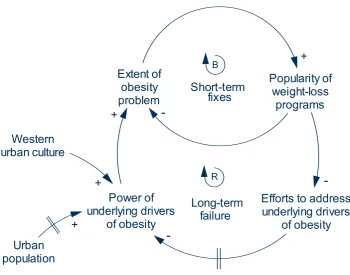
The example shown in Figure 2 illustrates the amplifying effect of positive feedback. There is a negative feedback loop that operates to maintain the extent of the obesity problem. In this loop an increase in the number of obese individuals causes an increase in the popularity of weight-loss programs. Then, the increase in the popularity of weight-loss programs reduces the extent of the obesity problem. But the tendency to see weight-loss programs as ‘the solution’ reduces efforts to identify and address the
Seeing obesity as a systems problem
underlying drivers of obesity. This reduced focus allows urban population and lifestyle factors to increase the power of the drivers, which further increase the number of obese people. Over time the positive feedback loop shifts the balance point maintained by the negative feedback loop. Thus, the overall extent of the obesity problem increases slowly in response to the steady growth of urban populations and the excesses of Western urban cultures.
Complex systems have a large number of ‘parts’ that inter-act, via a network of feedback loops, to influence and con-strain one another’s behaviour. A human–urban system comprises the city’s inhabitants plus the ecological, cul-tural, social and economic entities that make up their environment. Figure 3 shows a portion of the complex human–urban structure that might be expected to drive the obesity epidemic. Even though the diagram illustrates only a part of the possible structure, it is complex enough to show why a systems approach must be adopted when looking for leverage points that can help the community to tackle the epidemic. Note that, if commuting time increases, then the reinforcing loops R1 and R2 have the potential to amplify unhealthy behaviours (decreased time spent cooking and exercising). Such ‘lock-in effects’ are another major source of stubborn problems.
Taking a systems approach
There are well-developed system analysis tools that can be used to investigate the causal structure of human–environment systems. These range from influence
diagrams to sophisticated modelling techniques that allow the construction of working simulations.4,8–10It is possible,
however, for an interdisciplinary group to make significant progress working with no more than influence diagrams. Influence diagrams can be thought of as causal loop dia-grams (as presented here) without polarities assigned to the arrows. They are easier to produce than causal loop dia-grams and so support an unconstrained approach that helps participants to capture their current understanding and intuitions. This freedom also helps to weaken the influence of conceptual barriers between disciplines.11
As a first step toward the construction of an influence diagram it is valuable to generate lists of the variables that might be relevant to the target problem. The initial ver-sions of such lists should be compiled in ‘brain-storming’ sessions involving people from a wide range of disciplines and sectors. See Table 1 for a starting list of variables that are likely to be relevant to the obesity problem. The vari-ables listed include (a) cultural and social factors, (b) the beliefs that constitute community and individual world-views (mental models), and (c) individual actions that might affect system behaviour.
The lists should be merged and the variables sorted into groups according to their status as (a) system variables, (b) external drivers of the system, and (c) irrelevant to the problem.4Diagrams can then be constructed showing the
influence links that are likely to exist between the
Extent of open
space in
community
Pressure to
develop open
space
Popularity of
neighbourhood
+
Demand for
new housing
+
-+
BDesire for
outdoor activities
+
Competition
for space
Figure 1. A causal loop diagram illustrating policy resistance.
216 | Vol. 18(11–12) NSW Public Health Bulletin
variables. On this basis the team can then go on to identify possible feedback loops within the system (as was done in Figure 3).
Influence diagrams can provide the starting point for more extensive studies of the dynamics of human–urban systems. Our experience has shown, however, that the process of con-structing and discussing influence diagrams can itself help a group to develop a greatly enhanced understanding of the behaviour of their system of interest. Such an endeavour, carried out collaboratively by public-health researchers, policy makers, and providers could provide valuable new insights into the drivers of the obesity epidemic.
Principles for managing complex human–environment systems
Recent work by Newell and Proust has led to a focus on four principles that can help guide attempts to manage in complex human–environment systems.9,10 These
princi-ples, expressed in a form appropriate to the obesity problem, can be used to summarise the above discussion:
Principle 1: Feedback effects are important drivers of
behaviour in human–urban systems.
Principle 2: Any action taken in a human–urban system
will have multiple outcomes, some wanted and some unwanted. The unwanted outcomes will usually be delayed and therefore may go unrecognised.
Principle 3: The behaviour of a human–urban system
cannot be optimised by optimising the behaviour of its parts taken in isolation from one another.
Principle 4: The design of effective policies for the
man-agement of human–urban systems requires an integrative approach that crosses existing professional and institu-tional boundaries.
Principles 1 and 2 capture generic aspects of system behaviour as observed in a wide range of situations. The phenomenon of policy resistance, as discussed above, is typical. Principles 3 and 4 capture two characteristics of systems that must be taken in to account in any manage-ment intervention. They are intended to counter the natural tendency of managers and policy-makers to focus on sub-problems and to institute policies intended to solve each sub-problem separately.
Conclusion
Feedback system concepts are a natural and necessary component of an integrative approach to the obesity epi-demic. Public health policies that are informed by these concepts, and the above system principles, have a good chance of proving effective in the face of this highly stub-born problem.
Extent of
obesity
problem
Popularity of
weight-loss
programs
Power of
underlying drivers
of obesity
+
-+
B
R
Efforts to address
underlying drivers
of obesity
-Short-term
fixes
Long-term
failure
Urban
population
+
Western
urban culture
+
Figure 2. A causal loop diagram illustrating fixes that fail.
Seeing obesity as a systems problem
Commuting distance
Time spent commuting
Levels of stress
Extent of obesity problem
+
Desire for wholesome food cooked at home
Time spent cooking at
home
+ Benefits of home-cooked
food
Time spent exercising
Desire for exercise Number of
motor vehicles per family
-Extent of urban sprawl
+
+
+
Level of individual
fitness
-City noise levels
+ +
+
Number of families with
dogs
+
R1
B1 Time spent
in reflection Desire for
relaxation
+
+
+
R2
Community affluence
+
Ability to handle stress
-Hours at work
+
+
-+
+ +
Figure 3. Causal structure proposed for a part of the human–urban system that produces obesity.
This diagram summarises possible systemic effects. To keep the diagram simple a number of influence links have been omitted. For example, the three driving variables shown at the top of the diagram (extent of urban sprawl, community affluence, number of families with dogs) are themselves parts of more extensive feedback loops. There are three feedback loops related to eating (R1), relaxation (B1) and exercise regimes (R2). The variable ‘number of families with dogs’ is included to stress the need for initial system analyses to include as wide a range of variables as possible.
Table 1. Variables that can affect an individual’s body weight
A. Variables conducive to healthy body weight
Cultural and social Worldviews Individual actions
Availability of information about Belief in the importance of a healthy lifestyle Building in time to achieve a balanced
healthy living lifestyle
Access to healthy food Understanding of healthy eating regimes Consuming healthy foods Opportunities for physical activity Understanding of the benefits of time Participation in physical activities
spent exercising
Neighbourhood design to support Belief that outdoor activities are essential Walking and cycling rather than driving walking and cycling
Local employment opportunities Belief in the value of local employment Acceptance of lower-paid work with reduced travel overheads
B. Variables detrimental to healthy body weight
Cultural and social Worldviews Individual actions
Time pressure; availability of Belief in competing demands on time; Buying and using labour-saving devices labour-saving devices inclination to save time
Population growth; urban sprawl Belief that growth is essential and has Dependence on motor vehicles;
work-no limits places beyond the local community
Consumerism Belief in market-based commodities and Succumbing to unhealthy, unnecessary services, seen as preferable to purchases
self-sufficiency
Inducements to unhealthy Belief in eating as reward and pastime; Acceptance of diets high in fat, sugar, salt eating traditions acceptance of fast-food culture and alcohol; consumption of excessive
portions
Characteristics of The Entertained Desire to be entertained; lack of belief in Excessive TV watching; lack of
218 | Vol. 18(11–12) NSW Public Health Bulletin
Acknowledgements
We thank Jane Dixon, Debra Summer and a referee for valuable comments.
References
1. Kearns A, Beaty M, Barnett G. A social-ecological perspective on health in urban environments.N S W Public Health Bull
2007; 18(3-4): 48–50.
2. National Obesity Taskforce. Healthy Weight 2008 – Australia’s future. Canberra: National Obesity Taskforce, 2003.
3. Tenner E. Why things bite back. London: Fourth Estate, 1997.
4. Sterman JD. Business dynamics: systems thinking and modeling for a complex world. Boston: Irwin McGraw-Hill, 2000.
5. Richardson GP. Feedback thought in social science and systems theory. Philadelphia: University of Pennsylvania Press, 1991.
6. Jervis R. System effects: complexity in political and social life. Princeton: Princeton University Press, 1997.
7. Senge PM. The fifth discipline: the art and practice of the learning organization. Sydney: Random House, 1992.
8. Newell B, Proust K. The Darwin Harbour Modelling Project: A Report to the Ecological Research Group of the Darwin Harbour Advisory Committee. Darwin: Darwin Harbour Advisory Committee, 2004. At
http://www.nt.gov.au/nreta/water/dhac/publications/pdf/finalre port20050307.pdf, accessed 19 October 2007.
9. Proust K, Newell B. Catchment and community: Towards a management-focused dynamical study of the ACT water system. Canberra: ACTEW Corporation, 2006. At
http://www.water.anu.edu.au/pdf/publications/Catchment%20a nd%20Community.pdf, accessed 19 October 2007.
10. Proust K, Dovers S, Foran B, Newell B, Steffen W, Troy P.
Climate, energy and water: accounting for the links. Canberra: Land & Water Australia, 2007. At
http://www.lwa.gov.au/downloads/publications_pdf/ER071256. pdf, accessed 19 October 2007.
Daily exercise and good nutrition could reduce the modern epidemics of obesity, Type 2 diabetes, and heart disease. At the same time, urban environmental problems such as heatwaves and air pollution are related to carbon dioxide emissions and hence car use, which public transport, cycling and walking would help to alleviate. Yet despite the twin benefits for health and the environment less than 5% of people walk to work each day and only 1% cycle. Instead, four out of five Australian commuters travel by car.1
Why hasn’t behaviour change occurred on anything like the scale required? How can policy respond to these public health and environmental threats? We argue that current solutions often have an unacknowledged time dimension, one vital factor constraining their uptake. The availability of free time has declined, and if interventions are to succeed they must avoid adding to time burdens. Like income, time is a resource. It is limited and has become more precious because of changes in the nature of work,
Too busy: why time is a health and
environmental problem
Abstract:Time pressure is emerging as a modern
malaise. It is linked to changes in working life, with longer work hours and faster work pace, and it is compounded in families; nowadays both parents must combine working with caring. Time pressure also challenges urban, health and environ-mental policy because many interventions have an unacknowledged time dimension. People need time to keep healthy, to exercise and to maintain strong social and family bonds. If urban designs or environmental solutions can reduce time demands they may directly improve health and social out-comes. However, where they increase time demands they may have unanticipated health costs, create disincentives for the uptake of interventions and disadvantage those who are most time poor.
Lyndall Strazdins
A,Band Bernadette Loughrey
AANational Centre for Epidemiology and Population Health,
The Australian National University
BCorresponding author. Email: [email protected]
how long people are working, who is working and the time costs of care. This paper briefly reviews why time pressure has become so widespread, who is most affected and the likely time consequences of the ageing population.
Work intensification
One hundred and fifty years ago, long work hours were a feature of the Australian economy. It was not until 1856 that an eight hour day became a right, at least for a few. Work hours did not reduce immediately (in 1890 they still averaged over 50 hours a week),2nor did they change for
all employees, but average hours gradually declined until the early 1980s, when Australian full-time workers aver-aged less than 40 hours per week.3The decade of the 1970s
marked a turning point. Global competition accelerated because of widespread financial deregulation, the strengthening of global economic institutions (e.g. the World Trade Organization and the International Monetary Fund), the growth in multinational corporations and inter-national movement of capital. Some public sector services were downsized or privatised and businesses began com-peting much more in global markets. As a result, flexible and insecure employment increased in many developed economies.4In Australia, employees began to work longer
and harder and average full-time work hours rose.5
Currently, one third of the Australian labour force puts in unpaid overtime,6one-third of men in full-time jobs work
more than 50 hours a week7 and the average Australian
full-time employee works nearly 42 hours per week.8But
it is not only the number of hours spent at work that gen-erates time pressure. The pace and intensity of work adds to the experience of busyness. Across European nations work intensity has increased for the past 20 years, with more people working harder, at very high speed and under a great deal of tension.9Data for Australia does not cover
that whole time span, but what evidence there is indicates similar trends here.9,10 Technological advances such as
laptop computers, email and mobile phones further com-plicate the boundary between work and free time, adding to the experience of overload.
The reconfiguration of work and family life
Women are now nearly half of the Australian labour force, and much of this increase has been driven by the work-force participation of mothers. In 2001, over 72% of Australian mothers with dependent children worked for pay, compared to 46% of mothers in the 1980s.11 Even
220 | Vol. 18(11–12) NSW Public Health Bulletin
2000, 45% of Australian women with children aged under four were in the paid workforce compared to 29% in 1985.12
A less visible consequence is the transformation of free time. For families, the combined work times of both parents reveals how much time use has changed. Three decades ago, most couple families in the United States (US) had mothers at home, and in these households the time devoted to paid work (by fathers) averaged 45 hours per week. Now, dual-earner families are the most common family type and in the US the time devoted to paid work (from both parents combined) averages 82 hours per week.13In Australia the figure is lower, closer to 70 hours
per week.14
Families with employed parents may have more income, but they are now ‘time poor’, and the pressures of time poverty are especially acute for mothers. Adding together paid and unpaid work, the total time demands on full-time employed parents is 14 hours per day for mothers and 12 hours per day for fathers.15Child care helps but does not
solve the problem because parents still strive to preserve time with their children.16What is lost is leisure time. Men
and women without children average 35 and 31 hours of leisure time per week respectively, but fathers and mothers of infants (when care demands are high) only average eight hours and two hours per week.15Now, a significant
proportion of adults struggle to find time free from working and caring.
Time for health
Yet, people need time to keep healthy. In an Australian survey on obesity, one in five experts ranked time pressure as the single most important social trend underlying the rising rates of obesity.17Both sedentary and active
indi-viduals cited lack of time, ahead of either income or knowledge, as the barrier to regularly exercising.18
Similarly, a quarter of Australian women said that exercis-ing five or more times per week was definitely not feasi-ble19and finding time for exercise is especially a problem
for mothers.18Preparing nutritious meals also takes time,
and in a European survey of 14 000 people one third of respondents listed lack of time as a major barrier to healthy eating.20One reason why people eat ‘fast food’ is
to save time.
Travel time
Time costs also shape travel choices. Two thirds of drivers in Sydney said that they would use public transport if it were as quick as car travel. Time spent waiting for public transport is viewed as particularly wasteful, so both the actual journey time and the waiting time act as disincen-tives.21 Initiatives to increase the use of public transport
may not consider the potential compounding time impacts for adults who both work and care. In these time-poor
families, daily travel must fit in children’s activities along-side parents’ work, so walking, cycling or public transport are almost never time-feasible.
The ageing population
The ageing population could exacerbate time shortages. In 2004, 13% of Australia’s population was aged 65 years and over. In 2051, this is projected to increase to between 26 and 28%.22The consequences are threefold: there will be
pro-portionally fewer working age adults and they will face more pressures to work; the need for elder care will increase; and more people will be combining work with family care. For some households paid work will need to be combined with caring for both children and ageing parents.8
Saving time
The solutions to urgent public health and environmental problems are competing in what is a time-scarce market. Work has intensified and work hours are rising, while demographic trends create acute pressures for adults com-bining working with caring. Meanwhile the modern epi-demics of obesity, diabetes and heart disease are putting pressure on health service costs. The challenge is to design interventions that will succeed.
What are the opportunities for policy makers and urban planners? First, time impact assessments should be part of any design brief, with particular attention given to different demographic groups. Second, time savings should be a goal of each proposed health and environmental interven-tion and should inform the decision whether to implement the intervention or not. Workplaces, schools, childcare and community centres for elders could be located along a single bus or train route, and there must be more investment in high speed public transport. Where time savings are not possible, creative solutions and cross-sector collaborations will be required. Time trading schemes (like carbon trading) could be considered, underwritten by estimated savings to health services. For example, the US civil rights lawyer, Edgar Cahn, pioneered the notion of time banks in the early 1980s. Under these schemes, time currency is earned for caring or community work. Credit can be used to call on other members’ time or on goods and services like public transport and refurbished computers.23Perhaps
tax incentives could be offered to businesses that curb long working hours similar to the tax deductions provided for research and development expenditure. Policy makers, planners and corporate leaders should also advocate for a culture of time awareness, and cost–benefit analyses ought to include time as well as money. Meanwhile awards and publicity could be given to businesses that make time and workload allowances so their employees can use public transport or exercise during the work day.
Time pressure: a health and environmental problem
and public health policy. It is not certain, for example, if time savings in one domain (such as travel) would result in spending more time on exercise or preparing healthy food. Indeed some travel researchers argue that time allocations are quite fixed so that increasing transport speed simply leads to more trips or traveling greater distances (see Schaefer and Victor,24and for a counter view Mokhtarian
and Chen25). Perhaps, because the problem of time has not
yet been solved, people assume it can never be solved. On the other hand, there is a market for anything that can save time; holidays, services, technologies and even medication advertisements are already tapping it. Solutions to health and environmental problems, if they are to be feasible and widely embraced, need to capture this market too. Otherwise simply adding to time burdens could inadver-tently penalise the nation’s productive, caring and regener-ative base, making it even harder to achieve public health and environmental goals.
Acknowledgements
We thank Dorothy Broom, Tony Capon and Jane Dixon for their comments and help with earlier drafts, and Tessa McDonald for her input on policy strategies.
References
1. Flood M, Barbato C. Off to work: commuting in Australia. Canberra: The Australia Institute, 2005.
2. Australian Bureau of Statistics. Australian Social Trends 1995. Canberra: ABS, 1995.
3. Australian Bureau of Statistics. Labour Force Historical Summary: 1966–1984. Canberra: ABS, 1985.
4. Organisation for Economic Co-operation and Development (OECD). OECD employment outlook 2007. Paris: OECD, 2007.
5. Quiggin J. Globalisation, neoliberalism and inequality in Australia.ELRRev1999; 10(2): 240–59.
6. Watson I, Buchanan J, Campbell I, Briggs C. Fragmented futures: new challenges in working life. Sydney: Federation Press, 2003.
7. Australian Centre for Industrial Relations Research and Training. Australia at work. Sydney: Prentice Hall, 1999.
8. Australian Bureau of Statistics. Australian Social Trends 2006. Canberra: ABS, 2006.
9. Green F. Demanding work. Princeton, NJ: Princeton University Press, 2006.
10. Houtman I. Work-related stress. European Foundation for Improvement of Living and Working Conditions, 2005.
11. Cass B. Employment time and family time: the intersections of labour market transformations and family responsibilities in Australia. In: Callus R, Lansbury R, editors. Working futures: the changing nature of work and employment relations in Australia. Leichhardt: Federation Press, 2002.
12. Organisation for Economic Co-operation and Development.
Babies and bosses: reconciling work and family life: Paris: OECD, 2002.
13. Jacobs J, Gerson K. The time divide. Cambridge, MA: Harvard University Press, 2004.
14. Brownson RC, Boehmer TK, Luke DA. Declining rates of physical activity in the United States: what are the contributors?Annu Rev Public Health2005; 26: 421–43. doi:10.1146/annurev.publhealth.26.021304.144437
15. Bittman M, Craig L. The effect of children on adults’ time-use: an analysis of incremental time costs of children in Australia. SPRC Discussion Paper No.143. Sydney: Social Policy Research Centre, UNSW, 2005.
16. Sayer L, Bianchi S, Robinson J. Are Parents Investing Less in Children? Trends in Mothers’ and Fathers’ Time with Children.
Am J Sociol2004; 110(1): 1–43. doi:10.1086/386270
17. Banwell C, Hinde S, Dixon J, Sibthorpe B. Reflections on expert consensus: a case study of the social trends contributing to obesity.Eur J Public Health2005; 15(6): 564–8.
doi:10.1093/eurpub/cki034
18. Sherwood NE, Jeffery RW. The behavioral determinants of exercise: implications for physical activity interventions.Annu Rev Nutr2000; 20: 21–44. doi:10.1146/annurev.nutr.20.1.21
19. Ball K, Crawford D, Warren N. How feasible are healthy eating and physical activity for young women?Public Health Nutr
2004; 7(3): 433–41. doi:10.1079/PHN2003541
20. Lappalainen R, Saba A, Holm L, Mykkanen H, Gibney MJ, Moles A. Difficulties in trying to eat healthier: descriptive analysis of perceived barriers for healthy eating.Eur J Clin Nutr1997; 51(Suppl 2): S36–40.
21. Wardman M. Public transport values of time.Transp Policy
2004; 11(4): 363–77. doi:10.1016/j.tranpol.2004.05.001
22. Australian Bureau of Statistics.Population Projections, Australia 2004 to 2101. Canberra: ABS, 2006.
23. Boyle D. Sustainability and social assets: the potential of time banks and co-production. Time Banks UK, 2005. At
http://www.timebanks.org/documents/GrassrootsFoundation.pdf, accessed 23 January, 2007
24. Schafer A, Victor DG. The future mobility of the world population.Transport Res A-Pol2000; 34: 171–205.
222 | Vol. 18(11–12) NSW Public Health Bulletin
Half of the world’s people now live in cities;1by 2030 this
proportion will increase to nearly two thirds.2In Australia,
75% of people already live in cities with a population of more than 80 000 and 90% live in urban settlements of 10 000 or more.3There is growing concern expressed in
the media over the possible health-damaging effects of city life, including commentary on the dangers of ‘crowded suburbs’,4 a facet of modern ‘killer cities’.5
Cities are a ‘potentially powerful force’6in shaping
popu-lation health, particularly that of disadvantaged people.7
The aims of this paper are to review briefly studies linking disadvantaged urban environments with poor mental
‘Crowded suburbs’ and ‘killer cities’: a brief
review of the relationship between urban
environments and mental health
Abstract: Most of the world’s population now
lives in cities, with 90% of Australians living in urban settlements of more than 10 000 people. Urban environments help shape population health, particularly among disadvantaged people, where poor health is concentrated. A growing body of research has focussed on the association between cities and mental health. Three hypotheses have been proposed to explain this association: psycho -social stressors; concentrated disadvantage; and social drift. It remains unclear, however, how the characteristics of urban environments are related to each other and to mental health, and what might be the pathways underpinning the experience of different individuals. With one in five Australian adults meeting the diagnostic criteria for a mental disorder each year, investigation of the relationship between urban environments and mental health is urgently needed. This paper briefly reviews recent studies linking disadvantaged urban environments with mental health and proposes a hypothetical model to help guide future research.
Helen L. Berry
National Centre for Epidemiology & Population Health, The Australian National University
Email: [email protected]
health and to propose an explanatory model to guide future research.
Cities differ substantially from one another, as do neigh-bourhoods within cities.8–10 Poor health is often ‘highly
concentrated’ in a small proportion of neighbourhoods11
that share health-damaging characteristics:12 inadequate
or ‘substandard’ housing12,13that limits access to shelter,
connectedness, and a sense of ‘home’,14including pride in
one’s home and home as a refuge;15poor access to
trans-port, co-location with ‘undesirable land uses’, such as bus depots and busy roads;12lack of access to healthy food and
overexposure to unhealthy food, alcohol and tobacco;7
limited access to and poor design of recreational and green spaces; and exposure to the clearly visible symbols of poverty and degradation16 that send ‘powerful messages’
that nobody cares about the neighbourhood or its resi-dents.12These characteristics generate direct health risks,
for example, by facilitating the spread of disease and dis-couraging physical activity,8 while encouraging negative
health behaviours, such as reduced health care-seeking.16
While most studies have examined cities and their effects on physical health, some have investigated mental health. Mental health problems have been associated with social disorganisation and living in deprived neighbourhoods.6
Increasing population density has also been linked to mental health problems, including elevated rates of psychosis and depression.17–19 However, density alone
does not necessarily determine disadvantage: for example, Potts Point in Sydney and Southbank in Melbourne are densely populated areas associated with advantage rather than disadvantage. More likely, population density is health damaging when it occurs in conjunction with other risk factors in the physical and social environment. These include lack of access to the natural environment and, especially, high levels of socio-economic deprivation,20
including overcrowding.21 Prospective studies have
con-cluded that improvements in the built environment are associated with decreasing psychiatric morbidity. In a follow-up of 503 people in Oslo, Norway, mental health problems declined among participants living in an initially poorly functioning neighbourhood that improved over a decade.22 Relocation can achieve similar results. In the
American ‘Moving to Opportunity’ study, families selected at random moved from deprived to non-deprived
Urban environments and mental health
neighbourhoods.23In 550 such families, three years later,
parents were less distressed and sons less anxious and depressed than were their peers who remained in public housing.
Qualitative studies of urban renewal and mental well-being have corroborated epidemiological findings. In-depth interviews with 16 Londoners indicated that enhanced safety and community facilities were associated with improved daily coping.24
Health-damaging characteristics of urban environments
Built environments may be conceptualised in terms of eco-logical (neighbourhood) characteristics, such as type of housing, roads and public places,25 and of individual
dwellings. Disadvantaged neighbourhoods exhibit substan-dard housing,12 which has been directly linked to poor
mental health,26,27and ‘physical incivilities’.25These
phys-ical incivilities include derelict buildings, extensive graf-fiti, litter, vandalism, excessive traffic, urine, dog faeces, a small proportion of private gardens (and a correspondingly higher proportion of shared recreational spaces),25visibly
deteriorating buildings, external walls, windows, stairs or lifts, structural fires and dirty streets or pavements.6
Substandard housing is most prevalent in poor neighbour-hoods25and among dwellings built since 1970, with deck
access (a means of access to flats above ground level via stairs or lifts that lead to long corridors onto which resi-dents’ front doors open directly) or floor-level access. This type of housing features one or more structural problems: damp,13leaking roofs, rot, pests,25toilet breakdown,
non-functioning kitchens, inadequate heating, repeated heating breakdown during winter, peeling plaster or paint, internal leaks,6 overheating in summer13 and lack of
affordabil-ity.11,15 People’s perceptions about their housing may be
influenced by their neighbourhood, and negative percep-tions about both incline people to relocate, increasing res-idential instability.28This breaks social ties that promote
mental health.29
Disadvantaged social environments exhibit social incivili-ties, such as the presence of crime, teen gangs,25noise (for
example, from trucks and aeroplanes30), foul air,27
neigh-bourhood poverty6 and diminished social capital.
Socio-demographic disadvantages also prevail, including overcrowding, unemployment, poor education, single par-enting, ethnicity, rpar-enting, no car or van access,25poverty6
and being an immigrant or refugee.17
The built and social environments and mental health are entwined.6,25In a study of 1887 residents of two London
wards, people living with socio-demographic disadvan-tages, substandard housing and physical incivilities were more likely to report depression than were their less
dis-advantaged peers.25Even after adjusting for
socio-demo-graphic characteristics and attributes of individual dwellings, significant associations remained between depression and deck access, post 1970s housing and few private gardens. Similar findings emerged from a study of depression and the built environment in 59 neighbour-hoods in New York City.6 Controlling for
socio-demo-graphic factors, substandard housing and physical incivilities were significantly associated with elevated rates of depression.
How do cities influence mental health?
Three explanations for the direct and indirect2associations
between urban environments and mental health have been proposed:6psychosocial stressors, concentrated
disadvan-tage and social drift.
Psychosocial stressors
Pearlin and colleagues31 described ‘the stress process’ as
negative life events creating strain in people’s lives, with this strain eroding positive self-concepts such as confi-dence and sense of worth, leaving people psychologically vulnerable, especially to depression. Exposure to physical and social incivilities in cities generates psychosocial stress; both are associated with diminished feelings of safety and security in one’s home, which is related to mental health.15
Concentrated disadvantage
The concentrated disadvantage explanation suggests that the density of city populations concentrates physical and social problems, intensifying their effects and inflating pressures on mental health. Consistent with this explana-tion, physical incivilities, substandard housing, social inci-vilities and socio-demographic disadvantage are significantly positively correlated, as are their constituent components.6,25The mental health effects of concentrated
disadvantage may be mediated by psychosocial factors, such as collective efficacy32 and loss of control, social
support, and recreation.27
Social drift
The social drift explanation proposes that the economic circumstances of people with severe and endur-ing mental health problems gradually deteriorate, necessitating relocating into progressively disadvantaged neighbourhoods and lower quality accommodation.33This
explanation does not preclude the possibility that disad-vantaged urban environments might also contribute to mental health problems. Indeed, while social drift con-tributes to the concentration of psychosis in disadvantaged neighbourhoods, urban environment causation seems more important than selection;19controlling for individual
224 | Vol. 18(11–12) NSW Public Health Bulletin D isadvant ages in t h e soci al envi ronm ent D isadvant ages in th e p h y s ic a l envi ronm ent P s ychosoci al st re ssor s M e nt al heal th pr obl em s T e en ga ngs , cr im e & vi o le n ce , noi s e , nei ghbour hood depr iv a ti on, l o w l e v e ls o f so ci a l ca p it a l P h ysi ca l in ci vi lit ie s S u bs ta nda rd hous ing D e re lict o r d e te ri o ra ti n g buildings, p ro b le m s w ith wa lls, st a ir s o r l if ts, "b ro ke n w in d o w s ", g ra ff iti , l itte r, v a n d a lis m , s tr u c tu ra l f ir e s , e xce ssi v e t ra ff ic, f e w p ri v a te g a rd e n s, d ir ty st re e ts o r p a ve m e n ts, f o u l a ir , ur in e, dog f a ec es , a b a n doned c a rs A ff o rd a b ili ty , dw el ling t y pe, f lo o r l e ve l & a cce ss, s tr u c tur a l pr obl em s ( la c k of hea ti ng or c ool ing, da m p , le a k ing r o of , r o t, pes ts ), pr obl em s w it h k it c hen, t o ilet , hea ti n g, pl a s te r or pa in tw or k C o m m on m e nt a l hea lt h pr obl e m s (d e p re s s io n , a n xi e ty, d ist re ss) so m a ti sa ti o n , p sych o s is A g e , se x, i n co m e , educ a ti on, et hni c it y , r e la ti ons h ip s ta tus , em pl oy m ent s ta tus , hous ing t enur e & ov er c row di ng, a cce ss t o a ca r o r va n So c ia l in ci vi lit ie s S o c io-dem o gr a p hi c di s a dv a n ta ges S oc ia ld rif t C o nc ent rat ed di s a dv ant age F igur e 1.
Hypothetical model of the r
e
la
tionship betw
een disadv
antages in the built en
vir
o
nment and mental health,
illustr
a
tin
g the c
o nc entr a ted disadv antage , psy chosocial str e
ssors and social drif
t e
x
plana
tions
Urban environments and mental health
Cities and mental health: a conceptual model
While there is evidence that built environments may influ-ence mental health and that mental health problems pre-dispose people to live in disadvantaged environments, it is unclear exactly how environmental and social factors are related and how different explanatory hypotheses might be accommodated within a pathways model that allows for different individual experience. Figure 1 is a conceptual model of how disadvantaged city environments might be linked to mental health problems. The Figure includes only factors for which there is direct empirical evidence for a link with mental health, as summarised in the litera-ture review above.
Constructs (in ellipses) have been presented together with lists of factors (in boxes) that have been empirically asso-ciated with the built environment and mental health. Darker arrows denote the direction of relationships among constructs as suggested by the concentrated disadvantage, psychosocial stressors and social drift explanations.6
Lighter arrows indicate relationships for which there is empirical evidence but which do not feature in the three explanations. The explanations are not mutually exclu-sive.6Instead, they describe different aspects of a bigger
picture, which must also take account of the size, density, diversity and complexity of a city’s population and its global, national, political, economic and social contexts.1
Urban environments and mental health: an urgent research priority
One in five Australian adults meets the diagnostic criteria for a mental disorder each year,34with mental health
prob-lems (particularly depression and anxiety35) being the
leading cause of non-fatal disease burden.36 The
preva-lence of mental health problems is increasing.37–39This
trend is likely to continue,40 involving massive costs to
healthcare41–45 and Australian society,42,46–52 with
pro-found implications for the intergenerational transmission of mental health problems53–55and disadvantage.56Though
we live predominantly in cities,30,57we do not fully
under-stand how cities influence mental health;58 the social
environment’s contribution to this relationship remains ‘neglected’ in research as a ‘possible [explanatory] mech-anism’.18The fields of social ecology and community
psy-chology, together with social capital theory, could usefully contribute to filling this gap.
It is essential59to begin systematic investigation of
path-ways models that describe how features of the social and built environments of Australian cities may be related to mental health. Urban environments are amenable to mod-ification and, with the potential to affect vast proportions of the world’s population,2 this is urgently needed.11,13
Insufficient investment has been made27in the challenging
task60of developing sophisticated conceptual frameworks
(pathways models) of how the built environment may
affect mental health. Frameworks must (i) be theory-based, empirically tested and continuously refined,60 (ii)
be constructed within a population health approach, with prevention in mind, and with interventions evaluated via ‘report card[s]’ that are not reliant on primary data collec-tion and are ‘grounded’ in local realities,10and (iii) include
health-promoting features of built environments, such as contact with nature61,62 and easy access to parks and
walking.58,60,63
References
1. Galea S, Freudenberg N, Vlahov D. Cities and population health.Soc Sci Med2005; 60(5): 1017–33.
doi:10.1016/j.socscimed.2004.06.036
2. Vlahov D, Galea S. Urban health: A new discipline.Lancet
2003; 362(9390): 1091–2. doi:10.1016/S0140-6736(03)14499-6
3. Newton PW, Baum S, Bhatia K, Brown SK, Cameron AS, Foran B. et al. Human settlements. In: Australia State of the Environment Report 2001 (Theme Report). Canberra: Department of the Environment and Heritage, 2001.
4. Dick T. Crowded suburbs make you depressed, but urban sprawl makes you fat. In: The Sydney Morning Herald. 9 December 2004.
5. Robotham J, Nixon S. Killer cities. In: The Sydney Morning Herald. 12 August 2006.
6. Galea S, Ahern J, Rudenstine S, Wallace Z, Vlahov D. Urban built environment and depression: A multilevel analysis.
J Epidemiol Community Health2005; 59(10): 822–7. doi:10.1136/jech.2005.033084
7. Bashir SA. Home is where the harm is: Inadequate housing as a public health crisis.Am J Public Health2002; 92(5): 733–8.
8. Galea S, Vlahov D. Urban health: Evidence, challenges, and directions.Annu Rev Public Health2005; 26(1): 341–65. doi:10.1146/annurev.publhealth.26.021304.144708
9. Grimm NB, Grove JM, Pickett STA, Redman CL. Integrated approaches to long-term studies of urban ecological systems.
Bioscience2000; 50(7): 571. doi:10.1641/0006-3568(2000)050[0571:IATLTO]2.0.CO;2
10. Strike C, Goering P, Wasylenki D. A population health framework for inner-city mental health.J Urban Health2002; 79(4)(Suppl. 1): S13–20.
11. Kingsley GT. Housing, health, and the neighborhood context.
Am J Prev Med2003; 24(3)(Suppl. 1): 6–7. doi:10.1016/S0749-3797(02)00651-7
12. Frumkin H. Health, equity, and the build environment.Environ Health Perspect2005; 113(5): 290–1.
13. Krieger J, Higgins DL. Housing and health: Time again for public health action.Am J Public Health2002; 92(5): 758–68.
14. Fullilove MT. What’s housing got to do with it?Am J Public Health2000; 90(2): 183.
226 | Vol. 18(11–12) NSW Public Health Bulletin
16. Cohen D, Spear S, Scribner R, Kissinger P, Mason K, Wildgen J. ‘Broken windows’ and the risk of gonorrhea.Am J Public Health2000; 90(2): 230.
17. Sundquist K, Frank G, Sundquist JAN. Urbanisation and incidence of psychosis and depression: Follow-up study of 4.4 million women and men in Sweden.Br J Psyc