A b s t r a c t. The EU 5th Framework project ‘SEQUID’ aims, by measuring and analysing different seafoods during different storage conditions, to develop an instrument which will allow the determination of quality or freshness of fish and fish products. This is achieved by first measuring the time domain response of the samples to an input step pulse (rise time 60 ps) delivered to the surface of the samples by an open ended coaxial probe. The time domain data are then transformed, along with any other relevant variables such as temperature or artificial nose responses, using multivariate analysis, for example principal component analysis (PCA). The PC scores can then be used in regression equations or discriminant analysis. Results are presented which show how different quality aspects such as time of storage (chilled or frozen), temperature of storage, or sensory attributes can be predicted. It is also shown how the data can be used to categorise samples into different quality groups (egonce or twice frozen).
K e y w o r d s: TDR, microwave, multivariate, fish quality
INTRODUCTION
There exists no entirely satisfactory rapid physical method to determine the quality or freshness of fish and fish products. As an example, blocks of both single and double frozen fish fillets can be the raw material for the production of frozen battered and breaded products. The problems arising from this are; how the quality of frozen fish is influenced by re-freezing; whether there is a significant influence on the quality of the final product; whether any existing methods can differentiate the refrozen raw material from that which is frozen only once. Further problems relate to the time and temperature of frozen storage and to the
changes that occur during storage on ice of freshly caught or slaughtered fish.
A concerted action on the evaluation of fish freshness in the AIR programme of the 3rd Framework of the European Community (AIR3 CT94 2283) reported much work in this general area. That project not only concerned itself with defining 'quality' as opposed to 'freshness' but also examined in detail various methods available for its estimation. Amongst the methods considered were physical methods involving measurement of physical properties (Olafsdottir et al., 1998)) and aggregate scores of sensory tests such as the Quality Index Method (QIM) (Luten and Martinsdottir, 1997). This latter method has been adopted to some extent in the EU but the drawbacks with it are that it is rather time consuming, only skilled persons can use it and it is still a sub-jective method. It was concluded, amongst other things, that more effort had to be put into making reliable instrumen-tation for measuring freshness. The new method being developed in SEQUID is such a physical method.
Recently a preliminary test of a broadband microwave approach was published (Kent et al., 2000) in an entirely new approach to electrical measurement of quality. This work was in fact a spin-off from a FAIR project in the 4th Framework programme (CT97 3020). Although that project was principally concerned with the measurement of added water in foods, for which it was eminently successful, the methodology used was able to distinguish different aspects of quality in seafood products, notably whether raw materials had been frozen and how well they had been
Time domain reflectometry as a tool for the estimation of quality in foods
M. Kent
1*, R. Knöchel
1, F. Daschner
1, O. Schimmer
1, J. Oehlenschläger
2, S. Mierke-Klemeyer
2U-K. Barr
3P. Floberg
1,3, M. Tejada
4, A. Huidobro
4, L. Nunes
5, I. Batista
5, and A. Martins
51
Lehrstuhl für Hochfrequenztechnik, Christian Albrechts Universität zu Kiel, Kaiserstrasse 2, 24143 Kiel, Germany
2Bundesforschungsanstallt für Ehrnährung und Lebensmitteln, Palmaille 9, 22767 Hamburg, Germany 3
The Swedish Institute for Food and Biotechnology, Box 5401, Göteborg, S402 29, Sweden
4
Instituto del Frio, CSIC, Ciudad Universitaria, E-28040 Madrid, Spain
5
Instituto de Investigação das Pescas e do Mar, Av. Brasilia, 1449-006 Lisbon, Portugal
Received February 4, 2004; accepted February 18, 2004
© 2004 Institute of Agrophysics, Polish Academy of Sciences *Corresponding author’s e-mail: [email protected]
A
A
Agggrrroooppphhyhyysssiiicccsss
w w
stored. These results were unique. It is therefore probable that the method might be capable of distinguishing between single and multiple frozen raw materials and other quality factors.
The new approach relied on measurement of the micro-wave dielectric properties of food materials as a function of frequency. Applying a multivariate analysis approach (principal component analysis (PCA)) common in other fields (egIR spectroscopy, pattern recognition) (Chatfield and Collins, 1980) to the analysis of the microwave dielectric spectra, enabled the determination of the condition of food substances. This was based on the observation that many of the characteristic properties of materials influence the frequency behaviour of the complex dielectric spectrum in subtle ways. For the work described here it was decided to investigate measurements in the time domain because a time domain instrument will be cheaper, and easier to make as a hand-held device than a broadband frequency instrument.
The reverse Fourier transform of the frequency domain spectrum F(w) to the time domain function f(t) may be written in its most general form as:
( )
f t( )= ò F e-i d-¥ ¥
1
2p w w
wt . (1)
The most important feature of this in respect to these measurements is that at any instanttthere are contributions from every frequencywin the spectrum. The implication is that the variance of any frequency components will be transformed to some variance in the time domain and the significant aspect of PCA is that it reconstructs the data on which it operates in terms of variances.
Provided we do not attempt to reconstruct the frequency spectrum from the time domain data by performing a for-ward Fourier transform, then, since only the variation of the data is of importance, we can use any part of the pulse that shows significant variation. Thus it is unnecessary to include the temporal extremes of the pulse and maximal signal to noise can be achieved by using only a small section of it in the region where the changes are most rapid.
In normal time domain spectroscopy, the reflected pulse is compared with that from a perfectly reflecting reference impedance (short circuit). This comparison requires extremely accurate time referencing in order to calculate the dielectric properties in the microwave region from the data. In the approach adopted here, the dielectric properties are not calculated. Instead, the sources of variation in the signal are isolated by PCA and the principal components are used as inputs for further analysis such as regression or discriminant analysis. Variations due to timing ‘jitter’ or other systematic errors are eliminated in effect because they have no correlation with any of the dielectric properties of the samples.
MATERIAL AND METHODS
The time domain response of the samples to an input step pulse (rise time 60 ps) delivered to the surface of the samples by an open ended coaxial probe is measured. The products to be discussed here are chilled and frozen Baltic cod (Gadus morhua), frozen Atlantic and Pacific hake (Merluccius capensisandMerluccius australis), and chilled farmed Atlantic salmon (Salmo salar).
Several strategies of data analysis have been tried, but the procedures generally adopted were:
1. Principal component analysis and regression of the first n PCs against variables of interestegtime of storage, temperature, QIM, the number 'n' being chosen by considering overfitting problems (Chatfield and Collins, 1980; Martens and Naes, 1989).
2. Principal component analysis and linear discriminant analysis using PC’s chosen as in 1 above.
3. Artificial neural networks (ANN) (Daschneret al., 2001).
In strategies 1 and 2 the collected time domain reflectometry (TDR) data are transformed along with any other relevant variable, such as temperature of mea-surement, using PCA. This applies a linear transformation to a set of correlated variables to produce a new set of uncorrelated and standardised variables called ‘Principal Components’ or scores (Chatfield and Collins, 1980; Martens and Naes, 1989). These PC scores can then be used in regression equations to predict other variables which may influence the properties of the samples, or in discriminant functions to allocate samples to particular groups. The original variables, which are usually the sampled reflected pulse data and the temperature, can also include any other variable believed to have an effect on the spectra or to be dependent on quality. Thus it allows the addition of variables from other methodologies, physical or otherwise, and has the potential to be independent of prior treatmenteg mechanical handling or other interfering factors.
RESULTS AND DISCUSSION
As an example of the quality related results being obtained, the age (days kept on ice) of fresh, whole, gutted cod could be estimated to within ± 11
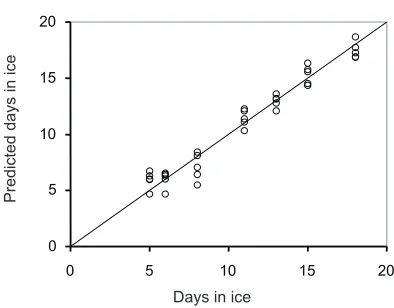
2days. Similar results have been obtained on salmon (Fig. 1), herring and sea bass. A further development of this was to add to the analysis the data from an electronic ‘nose’ sensor, incorporating 12 separate gas sensors (Gardner and Bartlett, 1999). This caused the precision to increase to better than ± 1 day (Fig. 2).
period. The results obtained with ANN are marginally better, but as yet there are insufficient data to use this method effectively. All these results can be compared in Table 1. For the ANN results the errors are expressed as root mean squares of the residuals, which for large numbers of data is roughly equivalent to the standard errors quoted for the regression equations.
Although the time of storage could be predicted without considering either the form of the fish sample (fillet vs. whole, oncevs. twice frozen), the prediction of both time of storage and temperature was greatly improved by considering only one type of sample. This suggested that a means of discriminating between the samples (one of the objectives of the project) would be highly desirable prior to any such prediction. Therefore, the principal components were also used as ‘descriptors’ of the pulse shape in discriminant analysis. In this part of the work, the method successfully discriminated between groups of once or twice
0 5 10 15 20 25
0 5 10 15 20 25
Days on ice
Pr
edict
ed
day
s
o
n
ice
Fig. 1.Predicted days on ice for salmon using time domain data collected directly on the skin.
0 5 10 15 20
0 5 10 15 20
Days-in-ice
Fig. 2.Predicted days in ice for cod mince using a combination of ANN and TDR: R2adj= 96.4, SEC = 0.9 and SEP = 0.9.
-50 0 50 100 150 200 250 300
0 50 100 150 200 250 300
Time of storage (days)
Pr
ed
ic
ted
tim
e
o
f
s
to
rage
(day
s
)
Fig. 3.Predicted time of storage for once frozen cod.
PCA ANN
Sample No. of PCs R2adj SEC SEP R2adj RMSEc RMSEv
All whole All Atlantic whole Atlantic winter whole Atlantic summer whole Pacific whole hake All Atlantic fillets Atlantic winter hake fillets Atlantic summer hake fillets All cod
Single frozen cod
6 12 10 9 11 8 8 10 10 10
30.8 73.6 99.3 93.4 95.0 66.5 91.2 89.7 89.8 93.0
79.1 55.2 10.8 12.8 16.4 43.4 24.6 16.7 32.3 26.9
80.7 58.6 11.8 14.8 19.0 45.5 26.3 20.0 34.9 30.2
99.5
99.4
97.0
8.1
5.1
14.4
11.8
15.3
25.7 T a b l e 1.Frozen hake: prediction of time of storage (days)
Predicted
days
in
ice
Days on ice
Predicted
days
on
ice
frozen cod, and frozen whole gutted hake of different provenance and season (Table 2).
It was also possible to separate the fish into 4 coarsely defined quality grades based on the levels of variables known to change with temperature and time of storage. Using linear discriminant models, success rates of up to 95% were obtained. The results are shown in Table 3. The variation in the individual components shown in the table can be quite large and this makes the results seem confusing. When all such variables are used to give an overall quality grading then the results are clearly better.
The last phase of the project has now begun with the construction of 5 portable instruments. They will be tested in full trials in storage of chilled and frozen fish.
CONCLUSIONS
1. The combination of TDR and multivariate analysis reveals its versatility in the prediction of different variables associated with loss of quality of stored fish.
2. It is clear, however, from some of the results that homogeneity of the samples is important and care must be taken to ensure that wherever possible the fish to be measured are graded into the appropriate category, be that species, season of harvest, or even whether whole or filleted. The method itself can be used, when calibrated appropriately, to carry out this categorisation.
3. In respect of the calibration method, ANNs have produced interesting but equivocal results so far because the data sets are still too small. It is hoped that the final phase of full trials will rectify this paucity.
4. For the other variables measured in this project and briefly discussed here it can be said that generally they show dependence on temperature and/or time of storage. The inability of the dielectric method to predict or correlate with some of them is not in itself an important issue. In the main this is due to the large variability of some of those variables, especially compositional ones. The variables that show the best relationship with the dielectric method are usually the
Group
No. in group No. of PCs used
Percent correct
Training Validation
1 Atlantic winter hake 2 Atlantic summer hake 3 Pacific winter hake
1 Atlantic hake 2 Pacific hake 1 Atlantic winter hake 2 Atlantic summer hake
1 Once frozen Baltic cod 2 Twice frozen Baltic cod
60 45 55 105 55 60 45 85 25 15 13 13 13 85.6 88.1 92.4 97.3 83.1 85.6 92.4 96.4
T a b l e 2.Frozen fish: discrimination between different types and treatments of frozen fish using an optimum number of PC's and linear discriminant models
Variable used to classify No. of PCs
Training Validation
All Atlantic whole
Sensory succulence Sensory flavour QIM
Shear strength cooked Shear strength raw Water holding capacity raw Apparent viscosity Soluble protein Winter/summer 13 12 13 13 17 15 13 12 13 81.9 78.1 76.2 71.4 95.2 87.6 81.9 70.4 92.4 71.4 70.5 71.4 63.8 89.5 86.7 71.4 62.9 92.4 Winter Atlantic whole
Sensory succulence Sensory flavour QIM
Shear strength cooked Shear strength raw Water holding capacity raw Apparent viscosity Soluble protein 11 11 10 11 12 11 12 10 90 83.3 86.7 88.3 98.3 90 96.7 85 80 73.3 83.3 85 85 86.7 85 80 Summer Atlantic whole
8 7 10 12 86.7 95.6 97.8 84.4 77.8 93.3 91.1 71.1
no change at -10 or -20°C “
-Sensory succulence Sensory flavour QIM
Shear strength cooked
Shear strength raw Water holding capacity raw
Apparent viscosity Soluble protein 5 4 77.8 77.8 71.1 71.1 Winter Pacific whole
Overall quality 12 98.2 98.2 Summer Atlantic fillets
Overall quality 6 95 95
sensory ones such as for example QIM scores, texture, and succulence. This is very encouraging since it relates the instrument’s performance directly to what the consumer perceives.
5. The fact that when the compositional and other variables are used to grade the fish into some broad quality bands, the time domain method can successfully discriminate those grades shows that this approach is valid. It may have applications far outside the field of fish quality or even foods.
6. The desire to have a non-destructive method can be met, with some reservations concerning the nature of the surface to be measured. The method will have potential to be instantaneous and with a capability of being implemented on-line. It should go a long way towards satisfying the demands expressed in the above conclusions of the AIR project.
REFERENCES
Chatfield C. and Collins A.J., 1980.Introduction to Multivariate Analysis. Chapman and Hall, London, UK, 57-81.
Daschner F., Knöchel R., and Kent M., 2001.Determination of the composition of foodstuffs using microwave dielectric spectra and artificial neural networks. Proc. 4th Int. Conf. Electromagnetic Wave Interaction with Moist Substances, Weimar, Germany, 217-223.
Gardner J.W. and Bartlett P.N., 1999.Electronic Noses. Prin-ciples and Applications. Oxford University Press, New York, USA.
Kent M., Mackenzie K., Berger U-K., Knochel R., and Daschner F., 2000.Determination of prior treatment of fish and fish products using microwave dielectric spectra. European Food Res. Technol., 210, 427-433.
Luten J.B. and Martinsdottir E., 1997.QIM: A European Tool for Fish Freshness Evaluation in the Fishery Chain. In: Methods to Determine the Freshness of Fish in Research and Industry. Proc. Final Meeting of the Concerted Action ‘Evaluation of Fish Freshness’, Nantes, November, 287-296.
Martens H. and Nas T., 1989.Multivariate Calibration. John Wiley and Sons. Chichester, UK 254-258.