International Journal of Engineering
J o u r n a l H o m e p a g e : w w w . i j e . i rLEACH Routing Algorithm Optimization through Imperialist Approach
S. M. Hosseinirad*a, M. Ali Mohammadib, S. K. Basua, A. A. Pouyanb
a Department of Computer Science, Banaras Hindu University 221005, Varanasi, India b School of Computer Engineering, Shahrood University of Technology 36147, Shahrood, Iran
P A P E R I N F O
Paper history:
Received 01 June 2013
Received in revised form 18 August 2013 Accepted 14 September2013
Keywords:
WSN Routing ICA Cluster Head Active Sensor
A B S T R A C T
Routing is an important challenge in WSN due to the presence of hundreds or thousands of sensor nodes. Low Energy Adaptive Clustering Hierarchy (LEACH) is a hierarchical routing and data dissemination protocol. LEACH divides a network domain into several sub-domains that are called clusters. Non-uniformity of cluster distribution and cluster heads (CHs) selection without considering the positions of other sensors may reduce the quality of cluster selection. Sensor nodes send data packets over long distances. Imperialist Competitive Algorithm (ICA) is an optimization algorithm inspired by social phenomenon. It considers colonization process as a stage of socio-political evolution. We improve performance of the LEACH algorithm using imperialist approach and study its efficacy in terms of energy consumption, coverage and cluster uniformity and compare with those of the LEACH algorithm. Selection of suitable value for radio communication radius over the network lifetime is a trade-off between connectivity and sensors energy consumption. Empowering LEACH with ICA helps to find the best location of a CH in every cluster, conserve energy significantly, increase network lifetime, and maintain network connectivity. It can significantly reduce the number of active sensors going out of range over the lifetime of a network.
doi:10.5829/idosi.ije.2014.27.01a.06
1. INTRODUCTION1
Wireless sensor networks (WSNs) are networks of hundreds or even thousands of sensors small in size, low-cost, low-power with limited processing, storage, and wireless communication capabilities, compared with computer networks [1]. WSNs are becoming an essential part of many applications in industrial, military and civilian applications [2]. A few or many sensors are deployed for monitoring, tracking, or surveillance activities, etc. [3].
The main goal of a WSN is to collect data from an environment and send it to a reporting site where the data can be analyzed. They are densely deployed either inside or very close to a phenomenon being monitored in the field which may be harsh or hostile [4]. WSNs are highly distributed self-organized and infrastructureless wireless networks [5]. Sensors are usually intended to last for a long period of time, such as months or even years. However, a network operates as long as power is
*Corresponding Author Email: [email protected] (S. M.
Hosseinirad)
available. Sensors can remain active continuously; their energy gets depleted quickly leading to their death [6].
WSNs have evolved in many different aspects; they continue to be networks with constrained resources in terms of energy [7], computing power, memory, and communications capabilities. Energy limitation is an important constraint in WSNs. The energy consumption is of paramount importance, which is demonstrated by the large number of algorithms, techniques, and protocols that have been developed to save energy, and thereby extend the lifetime of a network [8].
In the recent years, WSNs have attracted a lot of research attentions [9]. It offers a rich area of research in which a variety of multi-disciplinary tools and concepts are employed [10]. Due to economic and technological reasons, most available wireless sensor devices are very constrained in terms of computational, memory, power, and communication capabilities. Therefore, it has been the focus of considerable research in the areas of communications (protocols, routing, coding, error correction, etc.), electronics (energy efficiency, miniaturization), and control (networked control system, theory and applications) [11].
Routing in WSNs with hundreds or thousands of sensor nodes sensing over wide geographical domains, having ability to communicate among directly or via other sensors to the base station (BS) is of paramount importance [12]. There is a need for sending sensed data from multiple sources to a particular BS. Allocating a global addressing scheme is very difficult in WSNs. Traditional approach based on internet protocol (IP) may not be suitable for WSNs.
To find minimum path and maintain the data-hop route in a WSN is inevitable because of energy constrains and changes in dynamic topology due to unwanted and sudden nodes failures. To reduce and minimize energy consumption of a network, some routing protocols and techniques were proposed in terms of clustering, data fusion, data aggregation and pre-processing, data-centric, and assignment of different function modes to sensors [13].
To solve and optimize a complex problem in the real world, different methods such as genetic algorithm [14, 15], ant colony optimization [16], imperialist competition algorithm [17, 18],and so on, have been proposed.
This paper aims to provide an optimal distribution of cluster heads (CHs). We change clustering method in the LEACH algorithm to reduce communication energy. We apply Imperialist Competitive Algorithm (ICA) for improvement in clustering and use a heuristic optimization algorithm for the clustering step. Concomitant optimization of a large number of parameters toward an optimal goal is desirable; suitable clustering of sensors in a large search space is achieved with heuristic methods. In this regard, ICA method fulfills our objective. In this algorithm each distribution of CHs is a country. Number of these countries is defined with the initial population.
The paper is organized as follows: Section 2 deals with routing algorithms, Section 3 discusses WSN model, in Section 4 ICA is discussed, Section 5 deals with the LEACH algorithm, Section 6 presents results and discussions, and Section 7 concludes the paper.
2. ROUTING ALGORITHMS
Flat, hierarchical, or location-based protocols are different classifications of routing protocol based on the structure of a network [19]. In flat protocols, similar functions or roles are assigned to each sensor node. In hierarchical-based protocols, sensor nodes play different functions or roles in the network. In location-based routing, data is routed due to positions of sensors in the network. From the operational approach, the routing protocols are classified into multipath-, query-, negotiation-, quality of service-(QoS), and coherent-based. The routing protocols may be categorized into
proactive, reactive, and hybrid protocols based on the status of data route paths between a source and a destination. In proactive routing protocols, all data route paths are computed before they are really needed, while in reactive protocols, data route paths are computed on demand. Hybrid protocols use a combination of the two aforementioned ideas [20]. In stationary sensor nodes, table-driven protocols are preferred over reactive protocols. In retrieval protocols, in order to discover and setup paths, a large amount of energy is consumed [21]. In cooperative routing protocols, central nodes receive the collected data from ordinary nodes and aggregate it and further preprocess it. This lowers energy consumption of data routing. Many other protocols rely on timing and position information [22].
In WSNs, sensor node deployment depends on application of WSNs. It affects the performance of a routing protocol. Deterministic and randomized deployments are two different types of sensor node deployments. In random deployment, if sensor nodes are not distributed uniformly, cluster optimization would be necessary to improve network connectivity and reduce operation energy [23].
Event-, time- (continuous), query-driven and hybrid are different classifications of data reporting in WSNs [24]. Applications that need periodic data monitoring favor time-driven delivery model [25]. In query- and event-driven models, sensor nodes show immediate reactions to extreme changes in case of certain events or queries made by the BS. The data reporting model highly influences the routing protocol regarding energy consumption and route stability [26].
3. WSN MODEL
coverage areas of the sensors are in circular shape. Every sensor has a sensing coverage radius (Rsen) and radio
communication radius (Rrx) associated with it. The
overlapping of sensing areas/intersection of clusters/ overlapping of radio coverage of two sensors can be obtained by Equation (1).
2 1 1 2 2
2 cos ( ) 4 2 2
-= d -
-A R d R d
R (1)
where R represents the clusters/sensing/radio communication radii and d is the Euclidean distance between two sensors. Sensors nodes consume energy for sensing, processing, and radio transmission. A major part of energy is used for radio communication. In the first radio model [27], ACS communicates over short radio distances. Data transmission energy consists of transmission (ETx) and receiving (ERx) energy. Thus, to
transmit a k-bit message over a distance d using the first radio model may be given by Equation (2) [27].
-2 0 4 0 ( , ) ( ) ( , ) -= +
ì ´ + ´ ´ <
ï = í
´ + ´ ´ ³
ïî
Tx Tx elec Tx amp
elec fs
elec mp
E k d E k E k d
k E k d d d
k E k d d d
e e
(2)
where d0 is the threshold distance defined as
0= fs mp
d e e , εfs the energy loss to send 1-bit
message by transmitter amplifying circuit in elemental area in free space model, and εmp the energy to send
1-bit message by transmitter amplifying circuit in multi-path fading model, ETx-elec the energy spent by the
transmit circuit, ETx-amp the energy-cost of the
transmission amplifying circuit. ERx-elec signifies the
energy-cost of the receiving circuit, and Eelec is the
energy expense to transmit or receive 1-bit message by the transmitting or the receiving circuit. The energy spent in receiving data can be given by Equation (3).
(
( , ) = + )´
Rx Rx BF
E k d E E k (3)
where EBF is the beam forming energy. One has to
minimize not only the transmit distances but also the number of transmit and receive operations for each message. The energy consumption for data fusion
(Eda-fus) is represented by Equation (4).
( , )
- = ´
da fus k d da
E k E (4)
Total communication energy (ETC) for a sensor node
may be represented by Equation (5).
( , ) ( , ) ( , ) ( , )
- = + +
-CE Sen k d Tx k d Rx k da fus
E E E d E k d (5)
Therefore, total communication energy for the whole network communication can be represented by Equation (6).
1
( , )
-=
=
å
n CE Seni i iCE E k d (6)
where n is total number of sensors. To calculate the network coverage, we select random positions based on the total number of sensors and try to find alive sensors based on sensing radius and obtain an estimate of coverage percentage of the network. The network coverage changes along the network lifetime. When the network coverage becomes lower than 50%, the network is terminated.
4. ICA ALGORITHM
A new evolutionary global heuristic search called Imperialist Competition Algorithm (ICA) is used to simulate socio-political process. It is based on the theory of imperialism and imperialistic competition [17, 18]. In ICA every individual is a country that is represented by a vector of n parameters as [p1, p2, p3,…, pn], where pi (1 ≤ i ≤n) represents the ith attribute of
the country. Each variable of a country represents the socio-political characteristics.
The cost function, cost t = f (country) = f (p1, p2, p3,…, pn), is used to determine the cost of countries in
every decade. After initial costs of the countries are calculated based on the primary cost, the empires are selected. One colony at least is assigned to every empire, and 50% of the countries can be selected as empires in the population. The remaining countries are distributed among the empires after the countries are normalized by Cn = cn– max [1], where cn is the cost of
the nth empire and C
nis its normalized cost. An empire
with lower cost will have higher value of normalization. The total power of every empire is calculated by Equation (7). 1 = =
å
imp n n N i i C p c (7)where Cn is the cost of an empire, ci the cost of colony i,
and Nimp the total number of empires. The power of each
empire is normalized by the total cost of its colonies. The initial number of colonies of the nth empire
isN C´ n= pn ´Ncol , where N×Cn is the initial number
of colonies of the nth empire and N
col is the number of
colonies. N×Cn of the colonies are randomly chosen and
given to the nth empire. These colonies along with the
nth imperialist form the nth empire. Initial empires and
Figure 1. Imperialist and colonists
Figure 2. Colony moving toward Imperialist
Parameter d represents the distance of a colony from its empire. The distance between new and old assimilation positions of a colony is represented by x
which is a uniform random variable x, where x ~ U (0,
β×d). The parameter β should be greater than one. If the value of β is much greater than one, a colony reaches the position of its empire rapidly (Figure 2). The total power of each empire is the sum of its power of and average powers of its colonies (Equation 8).
Cost(imperialist )
mean{Cost(colonies of empire )} +
´
=
nn
n
TC
x (8)
where TCn is the total cost of the nth empire and the
parameter x a positive number less than one.
After a number of decades, countries are likely to converge to the global minimum of the cost function. Different criteria can be used to stop the algorithm. One idea is to use maximum number of iterations of the algorithm, called maximum decades. The end of
imperialistic competition, when there is only one empire, can be considered as the stopping criterion of ICA. On the other hand, the algorithm can be stopped when its best solution in different decades cannot be improved for some consecutive decades. The main steps of ICA are:
§ Generate some random points and
initialize the empires.
§ Move the colonies toward their
relevant imperialist (Assimilation).
§ Randomly change the position of some
colonies (Revolution).
§ If there is a colony in an empire
which has lower cost than the
imperialist, exchange the positions of
that colony with the imperialist.
§ Unite similar empires.
§ Compute the total cost of all empires.
§ Pick the weakest colony (colonies)
from the weakest empires and hand it
over to one of the empires
(Imperialistic competition).
§ Eliminate the powerless empires.
§ Exit if stop conditions are satisfied,
otherwise do further assimilation and
continue.
5. COST FUNCTION
Some parameters of WSN should be taken into account in the cost function of ICA. The cost function is represented by Equation (9).
8
1 Country Cost
=
=
å
i ´ ii
W P (9)
where W1=10-5, W2=10-1, W3=101, W4=10-1, W5=10-3, W6=100, W7=101, W8=101, A cluster with the maximum number of members, lower variance of deployment density, and average distance of its CH to its members minimum is desirable. High deployment density increases data redundancy (variance of deployment density controlled through P3). Increasing the number of cluster members increases the total amount of cluster energy consumption (controlled through P1 and P8) and can be represented by Equations (10) and (16). Furthermore, uniform sensors distribution among clusters, balances network energy, traffic. It conserves other network resources (P8).
P1 is sum of total number of member for every cluster over the average energy of each cluster.
1 1
Number of members in Cluster =
=
å
nci
i i
P
where, Ei is the remaining energy in cluster i, and nc
number of clusters. P2, sum of the distances between each member and its cluster head may be given by Equation (11).
2 1
=
=å
n i iP d (11)
where, n is total number of sensors. P3 represents the variance of sensors distribution in a cluster, which is represented by Equation (12). A cluster with less dense deployment of sensors (minimum overlapping of coverage) or a cluster with more number of members (maximum overlapping of coverage) but with average distance to its CH less, conserves energy better.
3 1
σ(all members of cluster ) Number of members in cluster
=
=å
nci
i P
i (12)
P4 is sum of the distances of CHs to the BS. It may be given by Equation (13).
4 1
Distance( CH BS) ,
=
=å
nci i
P (13)
P5 is sum of consumed energy of every cluster which can be represented by Equation (14).
5 1
1
= =
å
nci i
P
E (14)
where, Eiis the remaining energy in cluster i, and nc the
number of clusters. P6 is the average total overlapping of cluster heads that may be given by Equation (15).
6 j 1 1
Overlap(CH , CH ) / =
=
=åå
nc nci j c
i
n
P (15)
P7 is the total number of active sensors out of range. P8 is sum of total member of every cluster, which can be represented by Equation (16).
8
1
1
(Number of members in cluster ) =
=
å
nci
P
i (16)
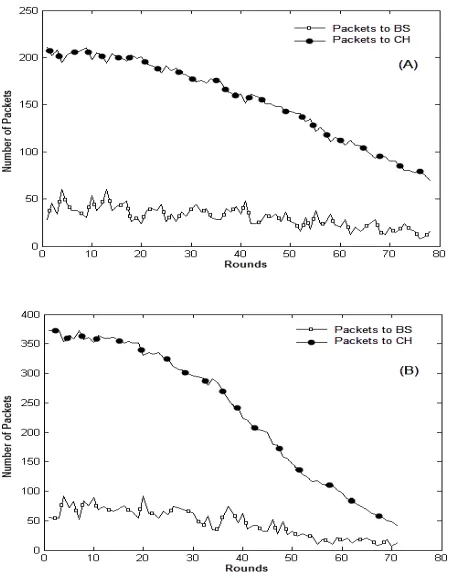
Three types of packets are used in LEACH-ICA combination algorithm (data, control, and broadcast packets) while in LEACH two types of packets (data and control) are used. CHs send data collected from the field to the BS using data packets. Data packet has sufficient size to carry data from the active sensors to the CHs. Control packet is sent to control active sensors notifying operation modes for the next round. Broadcast packet contains information about the remaining energy
of sensors. Figure 9 shows total data-packets versus rounds for a WSN with 225 (left) and 400 (right) sensors.
6. LEACH PROTOCOL
Low Energy Adaptive Clustering Hierarchy (LEACH) is a hierarchical (clustering-based) routing and data dissemination protocol [27]. LEACH divides a network domain into several sub-domains that are called clusters. Robust and scalable data flooding and routing are the two advantages of clustering in a network. In every round, a sensor is randomly selected to act as a cluster head (CH) and rest of the sensor nodes act as active sensor nodes. Non-rotation of CH drains out batteries quickly.
Sensed data is collected periodically from the cluster members through TDMA/CDMA MAC method. Cluster members transmit sensed data to the BS using the CHs. A CH gathers data from its cluster members, and reduces the amount of collected data (data fusion) and sends the pre-processed data to the BS. How much communication energy of the sensors is consumed depends on the amount of data and the transmission distance. By reducing the size of sensed data that must be transmitted using short distance transmission, LEACH reduces energy dissipation for data communication. It can improve the network lifetime. LEACH is divided into a number of rounds.
In this study a round is defined as transmission of 512 bytes from every sensor node to its CH. Every round has two phases: (i) setup phase, and (ii) steady-state phase. In the setup phase, the network domain is divided into a number of clusters and some sensors are randomly selected as CHs. Any sensor node can become a CH. A uniformly random number (r) is chosen between 0 and 1. If the random number is less than a threshold value T (i), the sensor node (i) acts as a CH for the current round; otherwise, it acts as an active sensor. The threshold function is given by Equation (17) [28].
in 1 1 ( mod ) ( )
0 otherwise
ì Î
ïï - ´ = í
ï ïî
P i G
P r T i
P (17)
After a CH receives all the messages from the cluster members, it creates a TDMA (time division multiple access) schedule for the cluster members and assigns a time slot to every member and broadcasts it to them for data transmission. The active sensor nodes start to sense and transfer data to their respective CHs. CHs forward all the received data to the BS after data aggregation. New CHs are selected in the next round. Every CH communicates to its members through different CDMA codes to reduce interference in the communication of cluster members.
7. LEACH ISSUES
The LEACH algorithm uses hierarchical architecture (clustering topology) based on single-hop transfer of data-packets. One of disadvantages of LEACH is flooding of data-packets in the network, which affect routing. In each round, some live sensor nodes are selected as CHs dynamically. The number of CHs is not based on the number of alive sensors of the network. It creates five major issues:
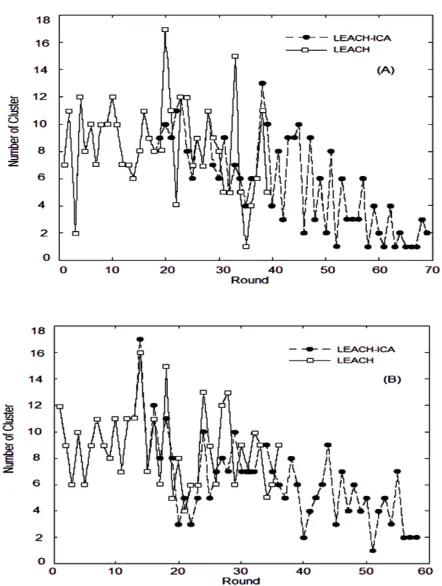
i) Every cluster can only have limited number of members, because every CH can service a limited number of alive sensors. The number of clusters in a network’s lifetime is dynamic. With insufficient number of created clusters in a network, some of the clusters become overloaded with sensors. In addition to increase of wasted resources and traffic, members of some of the clusters will not have any chance to deliver the collected data-packets (no data-hop) on the right time. Parameters: P1, P3, and P8 in the cost function are defined to optimize the number of clusters’ members. Figure 3 shows different number of clusters per round for a network with 100 sensors with grid deployment (left side) and random deployment (right side).
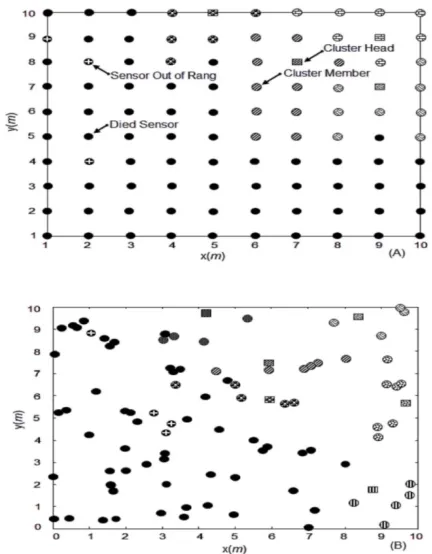
ii) Selected CHs are distributed non-uniformly across an application field. It causes cluster aggregation in some parts of the network. Some of the alive sensors in the network may not be able to access any CH for creating new data-hops to transfer their sensed data. Some data-packets are lost in some parts of the network for lack of network connectivity and impossibility of creating any new data-hop. Also, it can cause network traffic imbalance across the clusters. Some clusters may be overloaded. Parameters: P3, P6, and P7 in the cost function are used to distribute clusters uniformity and maximize network connectivity. Figure 4 shows CHs initialization for a network of 100 sensors with grid (left) and random (right) deployments in an area of 100 m2.
iii) In addition to non-uniformity, CHs are selected without consideration of remaining available energy
of the sensors. During a round, a CH may die and become disconnected from the network for lack of energy. Data-packets from those cluster members are lost till the next round. To control and optimize energy, P1 and P5 are defined in the cost function. Figures 5 and 6 show the percentage of lost data-packets per round for WSNs (100 and 225 sensors) with grid (left) and random (right) deployments. iv) Position of every cluster head in a cluster is
important. Efficient positioning of a CH can help the members to consume minimum amount of energy to transfer their data-packs and conserve energy. In the LEACH algorithm, CHs are selected without considering the positions of other sensors. It increases the total energy cost of the clusters. Parameters: P2 and P4 are used to select the most efficient sensor in a cluster to act as a CH
v) Over the network rounds, some sensors are located far away from the BS, and so die faster (they have to spend more energy for data-packets transmission). The remaining sensors may not be able to find any chance to act as a CH and transfer the gathered data-packets to the BS. P1, P2, P4, and P7 are defined in the cost function to prevent of unsuitable CH sensor in a cluster. Figure 7 shows the status of WSN (225 sensors) with grid (left) and random (right) deployments after 50 rounds.
Figure 4. Cluster Head initialization through LEACH for a WSN (100 sensors) with grid (left) and random (right) deployments
Figure 5. Percentage of lost data-packets per round for a WSN (100 sensors) with grid (left) and random (right) deployments
Figure 6. Percentage of lost data-packets per round for a WSN (225 sensors) with grid (left) and random (right) deployments
8. RESULTS AND DISCUSSION
We use three different initial populations (countries) having sizes 100, 225 and 400 in ICA. These sensors are deployed in two ways: grid, and random. Some of the sensors are selected as CH initially with the LEACH algorithm. Assimilation and revolution coefficients are defined dynamically depending on the iteration number. We assume the β (assimilation rate) = 2 × Exp (-Iteration No. / (.5×Maximum No. of Iterations)), that is guaranteed to be more than 1; and PR (Probability of Revolution) = 0.1×Exp (-Iteration No. / (1.2×Maximum Iterations)), and ζ (a scalar less than 1) = 0.1. We study our model on three different sizes of the monitoring area: 10m×10m, 15m×15m and 20m×20m.
The ICA is coded in MATLAB version 7 on IntelÒ
core i5 CPU 650 3.2 GHz running Windows 7 professional. We assume the initial values for the network nodes as: transmission energy (ETx) = 50nJ/bit,
receiving energy (ERx) = 50nJ/bit, beam forming energy
(EBF) = 5nJ/bit, energy consumption for data fusion
(Eda) = 5pJ/bit, transmitter amplifier energy (ɛamp) =
100pJ/bit, transmitting amplifying energy in free space model (ɛfs) = 10pJ/bit/m2, multi-path fading model (ɛ
mp)
= 0.0013pJ/bit/m2. We assume that every sensor’s
battery contains 0.001J energy in fully charged situation.
8. 1. Removing Anomalies in Leach Algorithm through ICA To remove the anomalies of the LEACH algorithm, we use ICA and some heuristics to find optimum solution for the above mentioned routing problems. After creation of clusters using the LEACH algorithm, insufficient number of clusters creates routing problems with flooding of data-packets in a network. To solve this problem we propose two approaches: (a) modification of the number of clusters, (b) using dynamic radio communication radius based on the number of clusters.
The first solution leads to change the basis of LEACH algorithm and it is not recommended. Using
dynamic radio communication radius is a trade-off between energy consumption and network connectivity. We prefer to keep connectivity in the network at the cost of some alive sensors not being able to send their data-packets (out of range). It has the possibility of load balancing with symmetric distribution of sensors across the clusters to increase the network routing efficiency. For example, if there is 4 CHs and 16 ACSs, we prefer to distribute as (4, 4, 4, 4) than (3, 5, 4, 4) ACSs per cluster.
We used ICA to find optimum radio communication radius value (Rrx) for different number of clusters. The
maximumRrx value of every ACS for communication
with its CH is 7m. The number of network clusters changes with rounds. The value of communication
radius is dynamic and it changes according to the number of clusters. Dynamic radius improves network connectivity, radio interference, cluster overlapping, number of CHs without any member, and number of ACS out of range and data-packet loss. Figure 8 shows radio communication radius versus no. of clusters in a WSN with 225 (left) and 400 (right) sensors.
After all sensors send their location information to the BS, transmission of data-packets is started over the network. BS finds the optimal value of radius for different clusters number in a network regarding the sensors deployed. For the rest of network lifetime, these radius values are used. To calculate the radius value, the following algorithm is used.
For number of CH = 1 up to (0.2×number of
sensors):
For Radius=1 up to MAX Radius
Run ICA with CH and Radius parameters.
Calculate overlap and store the number
of out sensors and overlap between
clusters. End for
Normalize sensors and overlap parameters
between (0, 1).
Calculate cost for each Radius by
(1/3×Overlap+2/3×Number of out Sensors).
Pick up first Radius with minimum cost
and store it for current number of CH. End for
Table 1 shows different values of radio communication radii for different number of clusters. Considering the limited radius of each cluster in each round, it may be that some sensors do not send data to the CHs as they are out sensors. We use a trade-off between decreasing radio interference and decreasing out sensors for different sizes of network with different values of sensors density.
To remove non-uniform and highly packed clusters, we apply ICA for any cluster to find a sensor best to act as a CH. It increases the clustering performance. Members of a cluster send the data-packets to their selected CH through short distance communication by using the assigned radio communication radius (Rrx) for
that round.
Therefore, it decreases the amount of communication energy, overlapping of CHs coverage areas, and radio interference of sensor nodes and increases the network coverage and data-packet transmission accuracy.
Figure 8. Radio communication radius versus no. of clusters in a WSN with 225 (left) and 400 (right) sensors
Figure 9. Total data-packets versus rounds for a WSN with 225 (left) and 400 (right) sensors
Figure 10. Cluster-overlapping for a WSN (grid and random deployments) with 225 sensors (left) and 400 sensors (right)
TABLE 1. Radio communication radius per cluster
Area Size 10×10 15×15 20×20
R(m) 50 Sensors 100 Sensors 400 Sensors 113 Sensors 225 Sensors 450 Sensors 400 Sensors
2 16-20 19-21 17-80 32-34 36-45 36-72 72-80
3 4-14 6-18 5-16 11-32 9-35 9-35 20-71
4 3 4 3 6-10 6-8 5-8 10-19
5 - 3 2 4-5 4-5 4 6-9
6 2 2 - 2-3 2-3 2-3 3-5
7 1 1 1 1 1 1 1-2
Since, the value of cluster-overlapping increases over the rounds after a network is initialized and optimized with ICA (LEACH-ICA combination), the combination can optimize cluster-overlapping. Cluster-overlapping is inevitable in both grid and random deployments as in the last rounds a low number of CHs aggregate in a small part of the domain.
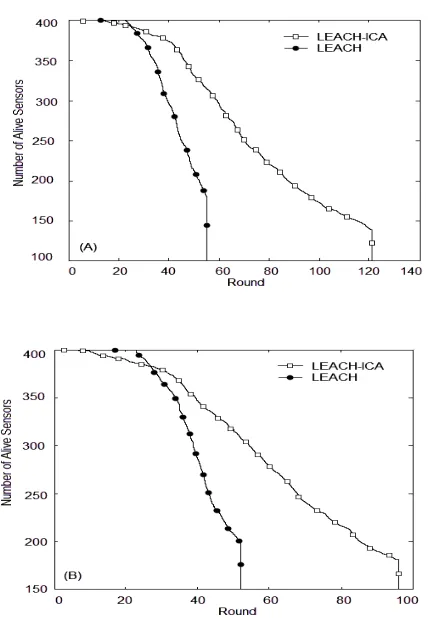
Figure 10 shows cluster overlapping for 225 (left) and 400 (right) sizes WSN with grid and random deployments. LEACH-ICA combination can improve the sensors lifetimes, thereby increasing the network lifetime compared with the LEACH algorithm. Compared with LEACH algorithm , LEACH-ICA combination selects the best sensor node in every cluster to act as a CH. It conserves WSN energy. With optimizing the WSN consumption energy, sensor nodes lifetime may increase double.
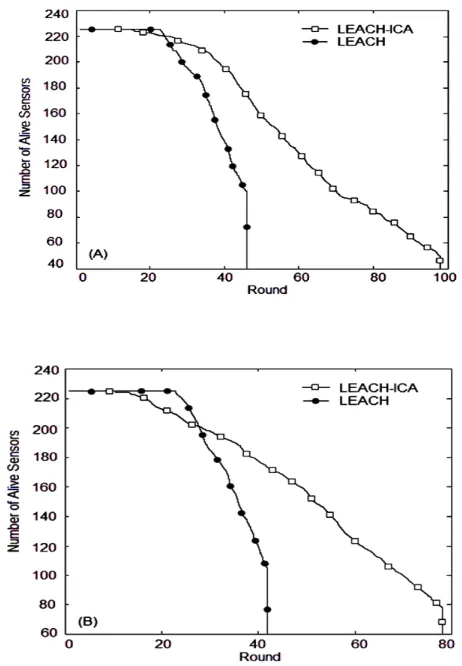
Figure 11 shows the number of sensors alive per round for a WSN with 100 sensor nodes with grid (left) and random (right) deployments. The LEACH-ICA combination algorithm increases lifetime of a network significantly compared with the LEACH algorithm. Sensors nodes with grid deployment survive for more number of rounds compared with random deployment in LEACH-ICA combination. Type of deployment does not have any effect on lifetime of the network in the LEACH algorithm. Thereby, type of deployment does not have any effect on WSN routing with LEACH and LEACH-ICA combination algorithms. The number of alive sensors per round for a WSN with 225 sensor nodes in grid (left) and random (right) is shown in Figure 12. Figure 13 shows a WSN with 400 sensor nodes in grid (left) and random (right) deployments. In the LEACH algorithm, some data-packets are lost in every round, because some alive sensors are disconnected from the network as they cannot access any CH (Figures 5 and 6). LEACH-ICA combination provides more robust routing for a network. Figures 5 and 6 show that the LEACH-ICA combination can significantly reduce data-packet loss for a WSN containing 100 and 225 sensors, respectively with grid (left) and random (right) deployments.
In large-sized networks with increasing number of rounds, the percentage of data-packets lost increases inspite of increasing the value of Rrx, because the
number of alive sensors is very low and these sensors are located across the field. Keeping the network connectivity in large-sized network over its lifetime is very difficult.
Figure 13. Network lifetime per round for a WSN (400 sensors) with grid (left) and random (right) deployments
9. CONCLUSION
We propose an improvement of LEACH algorithm through ICA and study efficacy of LEACH-ICA combination in terms of energy consumption, radio communication radius, data-packet loss, coverage and clusters uniformity. Dynamic Rrx can reduce network
data-packet loss. Selection of suitable value for Rrx over
the network lifetime is a trade-off between connectivity and energy consumed by the sensors.
The LEACH-ICA combination algorithm increases lifetime of a network significantly compared with the LEACH algorithm. LEACH-ICA combination helps to find appropriate location of CH in every cluster, significantly conserving energy, increasing network lifetime (by a factor of two approximately), and maintaining connectivity (decreasing significantly the percentage of lost data-packets). Sensors nodes with grid deployment survive for more number of rounds compared with random deployment by using LEACH-ICA combination while type of deployment does not have any effect on the lifetime of a network using the LEACH algorithm. In LEACH-ICA combination, type of deployment does not affect data-packet loss of a network. Studying the effects of a few parameters like
sensor-density, type of deployment, and so on under LEACH-ICA combination is our future plan.
10. REFERENCES
1. Akyildiz, I. F., Su, W., Sankarasubramaniam, Y. and Cayirci, E., "Wireless sensor networks: A survey", Computer Networks, Vol. 38, No. 4, (2002), 393-422.
2. Anastasi, G., Conti, M., Di Francesco, M. and Passarella, A., "Energy conservation in wireless sensor networks: A survey", Ad Hoc Networks, Vol. 7, No. 3, (2009), 537-568.
3. Arampatzis, T., Lygeros, J. and Manesis, S., "A survey of applications of wireless sensors and wireless sensor networks", in Intelligent Control, Proceedings of the 2005 IEEE International Symposium on, Mediterrean Conference on Control and Automation, IEEE. (2005), 719-724.
4. Akyildiz, I. F. and Kasimoglu, I. H., "Wireless sensor and actor networks: Research challenges", Ad Hoc Networks, Vol. 2, No. 4, (2004), 351-367.
5. Zheng, J. and Jamalipour, A., "Wireless sensor networks: A networking perspective", Wiley. com, (2009).
6. Pal, A., "Localization algorithms in wireless sensor networks: Current approaches and future challenges", Network Protocols and Algorithms, Vol. 2, No. 1, (2010), 45-73.
7. Hofmann-Wellenhof, B., Lichtenegger, H. and Collins, J., "Global positioning system. Theory and practice", Springer, Wien, Austria, (1993).
8. Yan, T., He, T. and Stankovic, J. A., "Differentiated surveillance for sensor networks", in Proceedings of the 1st international conference on Embedded networked sensor systems, ACM. (2003), 51-62.
9. De Couto David, R. K. and Morris, R., "A scalable location service for geographic ad hoc routing", (2000).
10. Li, X., Mao, Y. and Liang, Y., "A survey on topology control in wireless sensor networks", in Control, Automation, Robotics and ICARCV 2008. 10th International Conference on, IEEE, (2008), 251-255.
11. Ko, Y. B. and Vaidya, N. H., "Location‐aided routing (LAR) in mobile ad hoc networks", Wireless Networks, Vol. 6, No. 4, (2000), 307-321.
12. Shah, R. C. and Rabaey, J. M., "Energy aware routing for low energy ad hoc sensor networks", in Wireless Communications and Networking Conference, 2002. WCNC, IEEE, Vol. 1, (2002), 350-355.
13. Akkaya, K. and Younis, M., "A survey on routing protocols for wireless sensor networks", Ad Hoc Networks, Vol. 3, No. 3, (2005), 325-349.
14. Haupt, R. L. and Haupt, S. E., "Practical genetic algorithms", John Wiley & Sons, (2004).
15. Dorigo, M. and Blum, C., "Ant colony optimization theory: A survey", Theoretical Computer Science, Vol. 344, No. 2, (2005), 243-278.
16. Atashpaz-Gargari, E. and Lucas, C., "Imperialist competitive algorithm: An algorithm for optimization inspired by imperialistic competition", in Evolutionary Computation, CEC 2007. IEEE Congress (2007), 4661-4667.
17. Hosseinirad, S. and Basu, S., "Imperialist approach to cluster head selection in WSN", Special Issue of International Journal of Computer Applications on Wireless Communication and Mobile Networks, No.1, (2012), 1-5
microsensor networks", in System Sciences, Proceedings of the 33rd Annual Hawaii International Conference on, IEEE. Vol. 2, (2000), 10 -16
19. Bandyopadhyay, S. and Coyle, E. J., "An energy efficient hierarchical clustering algorithm for wireless sensor networks", in INFOCOM 2003. Twenty-Second Annual Joint Conference of the IEEE Computer and Communications. Societies, IEEE. Vol. 3, (2003), 1713-1723.
20. Sann, Z. and Minn, K. T., "Simulation of the rumor routing algorithm in sensor networks", in Computer Research and Development (ICCRD), 3rd International Conference on, IEEE. Vol. 3, (2011), 10-14.
21. Marc, A. K. J., Okada, K., Kanai, K. and Onozato, Y., "Greedy routing for maximum lifetime in wireless sensor networks", in Personal, Indoor and Mobile Radio Communications, 20th International Symposium on, IEEE. (2009), 1888-1892. 22. Al-Karaki, J. N. and Kamal, A. E., "Routing techniques in
wireless sensor networks: A survey", Wireless Communications, IEEE, Vol. 11, No. 6, (2004), 6-28.
23. Yao, Y. and Gehrke, J., "The cougar approach to in-network query processing in sensor networks", ACM Sigmod Record, Vol. 31, No. 3, (2002), 9-18.
24. Guo, J., Fang, J. a. and Chen, X., "Survey on secure data aggregation for wireless sensor networks", in Service Operations, Logistics, and Informatics (SOLI), 2011 IEEE International Conference on, (2011), 138-143.
25. Stojmenovic, I., "Handbook of sensor networks: Algorithms and architectures", Wiley. com, Vol. 49, (2005).
26. Mahmoud, A., Khedr, M. and Shaaban, S., "Hexagonal two tier data dissemination model for large scale wireless sensor networks", in Electronics, Communications and Computers (JEC-ECC), Japan-Egypt Conference on, IEEE. (2012), 138-144.
27. Liang, J., Wang, J., Zhang, X. and Chen, J., "An adaptive probability broadcast-based data preservation protocol in wireless sensor networks", in Communications (ICC), IEEE International Conference on, IEEE. (2011), 1-5. .
LEACH Routing Algorithm Optimization through Imperialist Approach
S. M. Hosseinirada, M. Ali Mohammadib, S. K. Basua, A. A. Pouyanb
a Department of Computer Science, Banaras Hindu University 221005, Varanasi, India b School of Computer Engineering, Shahrood University of Technology 36147, Shahrood, Iran
P A P E R I N F O
Paper history:
Received 01 June 2013
Received in revised form 18 August 2013 Accepted 14 September2013
Keywords:
WSN Routing ICA Cluster Head Active Sensor
هﺪﯿﮑﭼ
ﯽﮑﯾﯽﺑﺎﯾﺮﯿﺴﻣ،ﺮﮕﺴﺣهﺮﮔناراﺰﻫﺎﯾﺎﻫﺪﺻزاهدﺎﻔﺘﺳاﻪﺑﻪﺟﻮﺗﺎﺑ ﺶﻟﺎﭼزا
ﺮﮕﺴﺣيﺎﻫﻪﮑﺒﺷردﻢﻬﻣرﺎﯿﺴﺑيﺎﻫ ﻢﯿﺴﯿﺑ
ﺖﺳا
.
ﻢﺘﯾرﻮﮕﻟا
LEACH
ﺪﺷﺎﺑﯽﻣهدادرﺎﺸﺘﻧاﻞﮑﺗوﺮﭘوﯽﺒﺗاﺮﻣﻪﻠﺴﻠﺳﯽﺑﺎﯾﺮﯿﺴﻣﺮﺑﯽﻨﺘﺒﻣﻢﺘﯾرﻮﮕﻟاﮏﯾ
.
ﻢﺘﯾرﻮﮕﻟا
LEACH
ﻪﯿﺣﺎﻧ
ﯽﻣهﺪﯿﻣﺎﻧﺮﺘﺳﻼﮐﻪﮐﻪﯿﺣﺎﻧﺮﯾزﻦﯾﺪﻨﭼﻪﺑ ارﻪﮑﺒﺷيرﺎﮐ ﯽﻣﻢﯿﺴﻘﺗدﻮﺷ
ﺪﻨﮐ
.
ﺮﺘﺳﻼﮐﺐﺳﺎﻨﻣﺎﻧﻊﯾزﻮﺗ ﺐﺳﺎﻨﻣﺎﻧبﺎﺨﺘﻧا وﺎﻫ
دﻮﺷﺮﺠﻨﻣﺎﻫﺮﺘﺳﻼﮐﺮﺳبﺎﺨﺘﻧاﺖﯿﻔﯿﮐﺶﻫﺎﮐﻪﺑﺖﺳاﻦﮑﻤﻣ،ﺎﻫﺮﮕﺴﺣﺮﯾﺎﺳﯽﻧﺎﮑﻣﺖﯿﻌﻗﻮﻣﯽﺳرﺮﺑنوﺪﺑﺎﻫﺮﺘﺳﻼﮐﺮﺳ
.
هﺮﮔ
-ﻪﺘﺴﺑﺮﮕﺴﺣيﺎﻫ ﯽﻣلﺎﺳرارودﻞﺻاﻮﻓردارهداديﺎﻫ
ﺪﻨﻨﮐ
.
زاﻪﮐﺖﺳايزﺎﺳﻪﻨﯿﻬﺑﻢﺘﯾرﻮﮕﻟاﮏﯾيرﺎﻤﻌﺘﺳاﺖﺑﺎﻗرﻢﺘﯾرﻮﮕﻟا
ﻬﻟاﯽﻋﺎﻤﺘﺟاهﺪﯾﺪﭘﮏﯾ ﺖﺳاﻪﺘﻓﺮﮔمﺎ
.
ﺑاررﺎﻤﻌﺘﺳاﺪﻨﯾآﺮﻓﻢﺘﯾرﻮﮕﻟاﻦﯾا ﻪ
ﯽﻣﯽﺳرﺮﺑﯽﻋﺎﻤﺘﺟاهﺪﯾﺪﭘﮏﯾناﻮﻨﻋ ﺪﻨﮐ
.
ﻪﻟﺎﻘﻣﻦﯾارد
ﻢﺘﯾرﻮﮕﻟانﺎﻣﺪﻧاريرﺎﻤﻌﺘﺳاﺖﺑﺎﻗرﻢﺘﯾرﻮﮕﻟازايﺮﯿﮔهﺮﻬﺑﺎﺑﺎﻣ
LEACH
ﺘﻣارﺎﭘﺮﺑارنآﯽﯾارﺎﮐوهداددﻮﺒﻬﺑار ﺮ
ﺮﯿﻈﻧﯽﯾﺎﻫ
ﺮﺘﺳﻼﮐﺖﺧاﻮﻨﮑﯾﯽﮔﺪﻨﮐاﺮﭘوﺶﺷﻮﭘ،يژﺮﻧافﺮﺼﻣ ﻪﻌﻟﺎﻄﻣﺎﻫ
ﻢﺘﯾرﻮﮕﻟاﺎﺑو
LEACH
هدﺮﮐﻪﺴﯾﺎﻘﻣ ﻢﯾا
.
ﺐﺳﺎﻨﻣراﺪﻘﻣبﺎﺨﺘﻧا
ﺮﮕﺴﺣ يﺎﻫهﺮﮔيژﺮﻧافﺮﺼﻣوﻪﮑﺒﺷردلﺎﺼﺗانﺎﯿﻣيﺮﯿﮔ ﻢﯿﻤﺼﺗﻪﮑﺒﺷﺮﻤﻋلﻮﻃردﯽﯾﻮﯾدارﯽﺗاﺮﺑﺎﺨﻣعﺎﻌﺷ ﺖﺳا
.
ﻢﺘﯾرﻮﮕﻟايزﺎﺳﺪﻨﻤﺗرﺪﻗ
LEACH
،ﺮﺘﺳﻼﮐﮏﯾردﺮﺘﺳﻼﮐﺮﺳنﺎﮑﻣﻦﯾﺮﺘﻬﺑﻦﺘﻓﺎﯾﻪﺑيرﺎﻤﻌﺘﺳاﺖﺑﺎﻗرﻢﺘﯾرﻮﮕﻟاﮏﻤﮐﺎﺑ
ﺖﯾﺎﺿرفﺮﺼﻣ
ﯽﻣﮏﻤﮐﻪﮑﺒﺷﺶﺷﻮﭘيراﺪﻬﮕﻧوﻪﮑﺒﺷﺮﻤﻋلﻮﻃﺶﯾاﺰﻓا،يژﺮﻧاﺶﺨﺑ ﺪﻨﮐ
.
ﯽﻣيزﺎﺳﺪﻨﻤﺗرﺪﻗﻦﯾا ﺪﻧاﻮﺗ
هﺮﮔداﺪﻌﺗ ﺎﻫ ي ﺑارﻪﮑﺒﺷﺶﺷﻮﭘزاجرﺎﺧيﺮﮕﺴﺣ ﻪ
ﺪﻫدﺶﻫﺎﮐلﻮﺒﻗﻞﺑﺎﻗترﻮﺻ
.
.