Open Access
R E S E A R C H A R T I C L E
© 2010 Whegang et al; licensee BioMed Central Ltd. This is an Open Access article distributed under the terms of the Creative Commons Attribution License (http://creativecommons.org/licenses/by/2.0), which permits unrestricted use, distribution, and reproduction in any medium, provided the original work is properly cited.
Research article
Analysis of an ordinal outcome in a multicentric
randomized controlled trial: application to a 3- arm
anti- malarial drug trial in Cameroon
Solange Youdom Whegang*
1,2, Leonardo K Basco
3, Henri Gwét
1and Jean-Christophe Thalabard
2Abstract
Background: Malaria remains a burden in Sub-Saharan Countries. The strategy proposed by the World Health Organization (WHO) is to systematically compare the therapeutic efficacy of antimalarial drugs using as primary outcome for efficacy, a four-category ordered criterion. The objective of the present work was to analyze the treatment effects on this primary outcome taking into account both a center-effect and individual covariates. A arm, three-centre trial of Amodiaquine (AQ), sulfadoxine-pyrimethamine (SP) and their combination (AQ + SP), conducted by OCEAC-IRD in 2003, in 538 children with uncomplicated Plasmodium falciparum malaria, is used as an illustration. Methods: Analyses were based on ordinal regression methods, assuming an underlying continuous latent variable, using either the proportional odds (PO) or the proportional hazards (PH) models. Different algorithms, corresponding to both frequentist- and bayesian-approaches, were implemented using the freely available softwares R and Winbugs, respectively. The performances of the different methods were evaluated on a simulated data set, and then they were applied on the trial data set.
Results: Good coverage probability and type-1 error for the treatment effect were achieved. When the methods were applied on the trial data set, results highlighted a significance decrease of SP efficacy when compared to AQ (PO, odds ratio [OR] 0.14, 95% confidence interval [CI] 0.04-0.57; hazard ratio [HR] 0.605, 95% CI 0.42-0.82), and an equal
effectiveness between AQ + SP and AQ (PO, odds ratio [OR] 1.70, 95% confidence interval [CI] 0.25-11.44; hazard ratio [HR] 1.40, 95% CI 0.88-2.18). The body temperature was significantly related to the responses. The patient weights were marginally associated to the clinical response.
Conclusion: The proposed analyses, based on usual statistical packages, appeared adapted to take into account the full information contained in the four categorical outcome in malaria trials, as defined by WHO, with the possibility of adjusting on individual and global covariates.
Background
Many clinical trials have a primary outcome which is measured on a categorical scale. In these situations, the outcome categories are often ordered, either by a direct relationship to either a continuous measurement or a clinical score through pre-defined cut-points, or by a nat-ural interpretation by the physician of a health condition or body reaction.
An overview and recent developments in the analysis of ordered categorical data have been presented in [1-4]. More specific developments for analyzing ordinal data in the context of meta-analysis of clinical trials have been proposed initially for summary statistics [5,6], second-arily extended to meta-analysis with individual patient's data [7,8].
The main objective of this paper was to adapt and implement the above-proposed methods in the specific context of malaria. A more specific objective was to study the effect of both different treatments and a set of covari-ates on the primary outcome.
* Correspondence: [email protected]
1 Université de Yaoundé I, Ecole Nationale Supérieure Polytechnique, Département de Mathématiques et Sciences Physiques, B. P. 8390, Yaounde, Cameroon
In antimalarial trials, the WHO (World Health Organi-zation) established a clinical study protocol [9,10] to assess the efficacy of antimalarial drugs for uncompli-cated malaria, in which the primary outcome is a four-category outcome, i) ACPR (adequate clinical and para-sitological response); ii) LPF (late parasitological failure); iii) LCF (late clinical failure) and; iv) ETF (early treatment failure). Patient status reflects the ordinal character of the WHO criteria. Danger signs appearing on day 1, 2 or 3 with a persistent parasitaemia correspond to an ETF. The presence of fever and parasitaemia between day 4 and day 14 without an ETF is considered as LCF, whereas the presence of parasitaemia on day 14 without ETF and LCF is a LPF. ACPR corresponds to the absence of parasite regardless the body temperature on day 14 without being classified as either ETF, or LCF or a LPF previously. This suggests that there is an explicit order between the cate-gories. A multi-centre randomized controlled trial of three antimalarial drugs, amodiaquine (AQ), sulfadoxine-pyrimethamine (SP) and their combination (AQ + SP), which was conducted in 2003 by OCEAC-IRD in patients with uncomplicated P. falciparum malaria from 3 health centers in Cameroon, according to the WHO protocol [9,10] will be used to illustrate the statistical approach.
Briefly, the 3 centers were selected as they were known to be associated with different levels of transmission. Affected children, 0-5 years old, were the target popula-tion, according to the WHO recommendations for assessing antimalarial drug efficacy. The primary out-come of efficacy was the four category-variable: C1 = ACPR, C2 = LPF, C3 = LCF, and C4 = ETF, the first cate-gory being the best catecate-gory and the last catecate-gory being the worst, in terms of health condition. Table 1 describes the results for each arm of anti-malarial drug, in the three centers. The majority of patient outcomes were assigned in the first category, with very few treatment outcomes in the other categories, corresponding to various degrees of therapeutic failures. The protocol was approved by both the Ministry of Public Health and the Ethical National Committee. The person legally in charge of the children gave an informed consent before inclusion in the study. Study investigators were OCEAC field workers. A global analysis of the data, based on the rate of ACPR can be found in [11].
Methods
Statistical methods
The proportional odds model
The statistical approach is based on the proportional
odds model [12]. Consider the K = 3 centers. Each patient
had a response into one of the m = 4 categories, (C1, ..,
Cm), with ni patients in center i. Let be the total
number of patients overall.
Denote Z the response and πijc, the probability that the
jth subject in study i had a response in category c; πijc = Pr(Zij = c). Let also Qijc = Pr(Zij ≤ c) be the cumulative probability of a response in category c or better, so that
Qijc = πij1 + ... + πijc and Qijm = 1; c = 1, ..., m-1. Hence c = m
corresponding to the worst outcome (here an ETF) is the baseline level. The proportional odds model is defined by
where αc represents the cth intercept and ηij = γ1 x1ij + ...+ γp xpij, is a linear combination of explanatory vari-ables. The model assumes 1) an increasing order for the
αc: α1 <α2 < ... <αm-1; 2) α0 = -∞ and αm = ∞.
The assumption of proportional odds signifies that the ratio of the odds of the event Zij ≤ c for any pair of sets of explanatory variables is independent of the category c. The cumulative logit model (1) results from the existence of a latent random variable with a logistic distribution, the (αc, c = 0, ..., m) corresponding to the cut-off thresh-olds for categorizing the latent variable into m classes. Alternatives to the proportional odds model can be developed based on different assumptions regarding the latent variable, like a normal- or an extreme value distri-bution associated with the probit or complementary log-log links, respectively.
Fixed effect model The basic model extends the propor-tional odds model (PO) proposed in [7] to a situation with L treatments (L > 2). For the sake of simplicity, the presentation will be restricted to the situation of L = 3 treatments corresponding to the real data set but the extension to more than 3 treatments is straightforward. Assuming that one particular treatment (here, AQ) was selected as the reference treatment, the treatment covari-ate is modeled using L-1 = 2 dummy variables T1 and T2, where Tl (l = 1, L-1) yields 1 if subject received the treat-ment l, and 0 otherwise (here, l = 1 corresponds to SP, l = 2 corresponds to AQ + SP)
where {j = 1, ..., ni,} corresponds to the individuals within each arm, {i = 1, .., K}, corresponds to the centers and {c = 1, ..., m-1} to the categories. The parameter γ1
represents the log-odds ratio of efficacy associated to n = ni
i= K
1
∑
lijc it Qijc Qijc ac hij Qijc
= =
− ⎛
⎝ ⎜ ⎜
⎞
⎠ ⎟ ⎟= +
log ( ) log ,
1 (1)
treatment 1 versus the reference treatment, and γ2 the log-odds ratio of efficacy associated to treatment 2 versus
the reference treatment.
The center effects are modeled by γ0i where γ01 = 0 for identifiability constraint.
Testing the proportional odds assumptions It is worth noting that model (2) assumes that, within each center and for each outcome category c, (c = 1, .., m-1), there is a common log-odds ratio, γ1 for treatment l versus the ref-erence treatment. Similarly, model (2) assumes also that, within each treatment group, and for each outcome cate-gory c there is a common log-odds ratio, γ0i - γ0i, between two centers i and i', independent of the outcome category. Additional models were introduced to test the PO assumption. Model (3) allows for testing a global PO between treatments, without a center effect:
However, each treatment can have a different effect according to the outcome category.
Assuming a global PO for T1, the model (4) allows for testing PO between T2 and the reference treatment
where δhc = 1 if h = c and 0, otherwise.
Similarly, the model (5) assumes a global PO for T2, and allows for testing PO between T1 and the reference treat-ment (here AQ)
lijc=ac+g1T1ij+g2T2ij. (3)
lijc ac g1 ij g ij hcd h=
m = + T1 + 2h 2T
1 1
−
∑
(4)lijc ac g ij hcd g h=
m
2 ij = + 1h 1T + T
1 1
2
−
∑
(5)Table 1: Counts of treatment response by category stratified in all centers and treatments.
C1 C2 C3 C4
Center Treatment ACPR LPF LCF ETF Total
AQ 62 0 0 1 63
[98.4]** [0] [0] [1.6] [100.0]
1 SP 53 2 0 6 61
[86.8] [3.27] [0] [9.8] [100.0]
AQ+SP 59 0 0 0 59
[100.0] [0] [0] [0] [100.0]
AQ 52 2 0 0 54
[96.3] [3.7] [0] [0] [100.0]
2 SP 48 0 2 3 53
[90.56] [0] [3.7] [5.26] [100.0]
AQ+SP 55 1 0 0 56
[98.2] [1.8] [0] [0] [100.0]
AQ 57 0 0 1 58
[98.2] [0] [0] [1.7] [100.0]
3 SP 52 2 0 3 57
[91.2] [3.5] [0] [5.26] [100.0]
AQ+SP 58 0 0 0 58
[100.0] [0] [0] [0] [100.0]
Total 496 7 2 14 519
[95.5] [1.3] [0.38] [2.7] [100.0]
Mixed effects model Discarding a center effect, and still assuming proportional odds between treatments, 2 ran-dom effects were added to the treatment variables.
where: β1i = γ1 + δ1i and β2i = γ2 + δ2i. Both δ1i and δ2i are
normally distributed random effects with expected value
0 and variance , respectively.
By grouping separately the fixed and the random-effects, the model can be rewritten as follows:
where , where G', the transposed
matrix of G, needs to be estimated from the data. Estimation methods
The parameters of the fixed effects models were esti-mated using three different methods, i.e. maximum likeli-hood (ML), iterative generalized least squares (IGLS) and generalized estimating equations (GEE) [7]. In the IGLS and GEE methods, the ordinal response was considered as a set of correlated binary responses. Thus the propor-tional odds model is viewed as a member of the multivar-iate generalized linear models [13].
All these methods were implemented under the free Statistical Software R http://cran.r-project.org/. The vari-ous codes for the ML, GEE and IGLS methods are in the additional file 1. Models (3), (4) and (5) were imple-mented for the test of the proportional odds assumption between centers and treatments. The parameters of the random effects model were estimated using a Bayesian approach for hierarchical models. In the Bayesian para-digm, prior distributions for all unknown parameters θ
need to be specified. The intercept αc were given non-informative N(0,104) priors. Parameters β
1i and β2i were assumed to be from N(γ1, σ12) and N(γ
2, σ22) respectively.
We gave γ1, γ2 non-informative N(0,10-6). The difficulty in
the Bayesian paradigm is the choice of the a priori distri-bution for the inverse of the variances σ12 and σ
22. Several
forms of the a priori are available. We chose an a priori of the form Gamma(0.5η, 0.5ηζ2), where η and ζ2 are either
arbitrary chosen or calibrated from the data. Here we chose η = 2. The initial estimated values of ζ2 (0,007,
0,001) were obtained from our data, by adjusting a gener-alized linear mixed model. So 1/σ12 and 1/σ22 were given Gamma(1,0.007) and Gamma(1,0.001), respectively. All
the Bayesian analyses were performed using 3 chains of 50000 samples, out of which the first 25000 were removed to allow for convergence. Thus, each posterior statistic was based on 75000 samples. Finally the 95% credibility interval was obtained for each statistic. Simulations
To assess the performance of the fixed effect methods, we carried out analyses on simulated data based on model (6). The aim was to compare the methods when the treat-ment covariate was taken into consideration and random effects were introduced to account for center variability. We generated a data set of 3 centers, each containing 100 patients, comparing 3 treatments A, B, C, with equal size. We supposed that the treatment effects were the same in the 3 centers, and were set to be γ1 = -1 for B comparing to A and, γ2 = 1 for C comparing to A, respectively. Initial values for αc were α01 = -2, α02 = -1, α03 = 0. The initial value of the matrix G' was a diagonal matrix with diago-nal elements σ1 = 0.01 and σ1 = 0.02, corresponding to the between center deviation.
The choice of the treatment initial values was guided by preliminary results from real data. The choice for the cut-point values was derived from [14].
Cumulative probabilities Qijc were then obtained using model (6). For a subject j in study i, with vector of cumu-lative probabilities (0, Qij1, Qij2, Qij3, 1), the simulated out-come was generated using the quartile range category, to which an uniformly (0,1) distributed random value belonged. To check that the conclusions were not sensi-tive to the choice of the starting values, we repeated the simulations, for each method, with different initial values. An example of the simulated data set can be found in additional file 2.
For each method, bias and confidence levels were esti-mated through N 1000 = replications. For each estimation method, the treatment effect was assessed using the cal-culated coverage probability and the type I error.
In the Bayesian analysis, model (6) was implemented using the Bayesian Software WinBUGS. A program is provided in the additional file 3, showing how model (6) can be written in BUGS language.
Results
Simulated data set
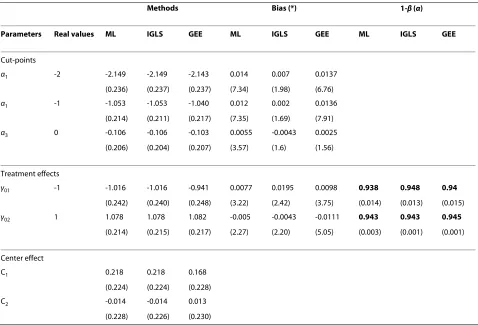
Results are summarized in Table 2. The ML-, IGLS- and GEE- methods yielded similar results. For the detection bias, the ML estimate appeared less biased than the two other methods. Considering their coverage probabilities (CP = 1- β), all the three approaches appeared to be able to detect a significant treatment effect with a given type I error α.
lijc=ac+b1iT1ij+b2iT2ij
s
12 s22
lijc=ac+g1T1ij+g2T2ij+d1iT1ij+s2iT2ij (6)
d d
d i
i
i
N G
=⎡ ⎣
⎢ ⎤
⎦
⎥ ′
1 2
Analysis of the Multi-centre trial
Results based on treatment and center effect only
Among the n = 538 patients from the three centers, 19 patients were lost to follow-up by day 14 and hence could not contribute to the analyses.
Results from the randomized trial are displayed in Table 3 with a general view of the fixed and the Bayesian approach. All the methods showed a significant decrease of the SP effect as compared with AQ. The SP treatment appeared less efficacious than AQ, by all the three fixed methods (ML: OR = e-1.93 = 0.14; 95% CI 0.04-0.50; IGLS:
OR = e-1.77 = 0.17; 95% CI 0.04-0.58; GEE: OR = e-1.80 = 0.16; 95% CI 0.04-0.57). The combination AQ-SP was not significantly different by the three approaches. The addi-tional file 4 shows how practically these fixed estimates can be obtained with an example of the different output given in additional file 5.
The between center variability was = 0.023 (95% credibility interval 0.001-0.107) for the SP/AQ treatment,
and = 0.020 (95% credibility interval 0.0001-0.024) for
the AS+SP/AQ treatment. The assumption of propor-tional odds between treatments and centers was tested using the ML method by comparing the change in devi-ance of the various models (Table 4) to the chi-squared
χ1-α2 (2 df ) which equals 5.99. The results indicate that the
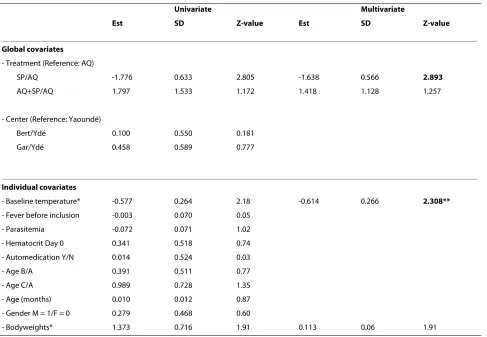
assumption was satisfactory. Results after covariates adjustment
Covariates known at the time of inclusion were the para-sitaemia, the type of treatment, the gender, the patient's age, the bodyweight (kg), a previous treatment before the study enrollment, the haematocrit and the baseline body temperature. The patient's bodyweight was log-trans-formed; the initial parasitaemia counts were transformed to normality using a Box-Cox transformation (estimated power = 0.1028, p-value = 0.0056). The baseline haemat-ocrit was categorized into two classes, below (A) and above (B) 25%. The patient's age was also categorized into 3 categories: i) less than 1 year old (A); ii) between 2 and 4 years old (B); iii) more than 5 years old (C). First, a univariate analysis including each covariate of interest, in addition to the treatment covariates and the
s∧1 2
s∧2 2
Table 2: Simulation results.
Methods Bias (*) 1-β (α)
Parameters Real values ML IGLS GEE ML IGLS GEE ML IGLS GEE
Cut-points
α1 -2 -2.149 -2.149 -2.143 0.014 0.007 0.0137
(0.236) (0.237) (0.237) (7.34) (1.98) (6.76)
α1 -1 -1.053 -1.053 -1.040 0.012 0.002 0.0136
(0.214) (0.211) (0.217) (7.35) (1.69) (7.91)
α3 0 -0.106 -0.106 -0.103 0.0055 -0.0043 0.0025
(0.206) (0.204) (0.207) (3.57) (1.6) (1.56)
Treatment effects
γ01 -1 -1.016 -1.016 -0.941 0.0077 0.0195 0.0098 0.938 0.948 0.94
(0.242) (0.240) (0.248) (3.22) (2.42) (3.75) (0.014) (0.013) (0.015)
γ02 1 1.078 1.078 1.082 -0.005 -0.0043 -0.0111 0.943 0.943 0.945
(0.214) (0.215) (0.217) (2.27) (2.20) (5.05) (0.003) (0.001) (0.001)
Center effect
C1 0.218 0.218 0.168
(0.224) (0.224) (0.228)
C2 -0.014 -0.014 0.013
(0.228) (0.226) (0.230)
Fixed models. Column 2 corresponds to the real values used for simulating data.
centre covariate was performed. Then only covariates with a p-value under 10% were selected for a multivariate analysis. Only the baseline temperature reached a statisti-cal significance (Table 5). Multivariate analysis did not change the magnitude of the treatment effects.
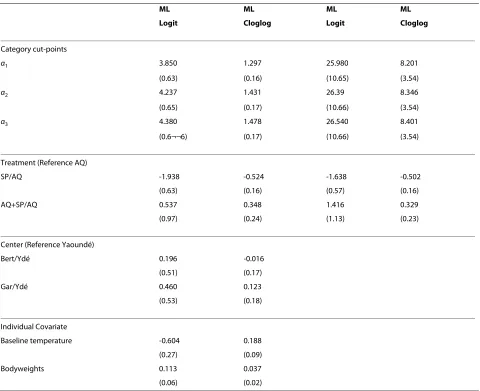
As all the estimated intercept values were strictly posi-tive, the assumption of a logistic distribution for the latent variable could be replaced with an extreme value
distribution, using a model with a complementary log-log (cloglog) link function [2]. In Table 6, the corresponding results show that the intercept value-estimates were reduced as compared to the corresponding ones using the logistic distribution. However, the treatment parameter estimates did not change although the interpretation is not strictly the same. Indeed, as pointed out by Agresti [2], trying a complementary log-log link function is Table 3: summary of parameter estimates using both the fixed effect models and the bayesian approach in the anti-malarial trial.
Fixed Approach Bayesian Approach
ML IGLS GEE WinBUGS
Category associated cut-points
α1 3.850 3.880 3.665 3.915
(0.63) (0.64) (0.63) (0.50)
α2 4.237 3.880 4.060 4.359
(0.65) (0.64) (0.64) (0.51)
α3 4.380 4.237 4.203 4.572
(0.67) (0.66) (0.65) (0.52)
Treatment (Reference: AQ)
SP/AQ -1.938* -1.776* -1.800 * -1.760*
(0.63) (0.64) (0.63) (0.57)
AQ+SP/AQ 0.537 1.797 2.081 1.601
(0.97) (1.53) (1.72) (1.09)
Center (Reference: Yaoundé)
Bertoua/Yaoundé 0.196 0.100 0.242
(0.51) (0.55) (0.55)
Gardoua/Yaoundé 0.460 0.458 0.475
(0.53) (0.59) (0.57)
*Treatment effect estimates in presence of a center effect. For each outcome category, the SP treatment was less efficacious than the AQ treatment.
Table 4: Test of the proportional odds between centers and treatments on the anti-malarial trial data set.
Tests Model comparisons ML results Change in deviance
Proportional odds 5 vs. 3 0.10 (2 d.f.)
between SP and AQ p > 0.95
Proportional odds 4 vs. 3 2.24 (2 d.f.)
between AQ-SP and AQ p > 0.32
Proportional odds 2 vs. 3 0.2 (2 d.f.)
equivalent to fitting a proportional hazards model. Hence regarding the comparison of the SP treatment to the ref-erence treatment AQ, the parameter e-0.502 = 0.605 (95%
CI 0.44-0.82) is interpreted as a hazards ratio which is assumed constant regardless the response category. It suggests that the proportion of patients having positive response was more decreased with SP than with AQ. Between AQSP and AQ, the hazards ratio was 1.40 (95% CI 0.88-2.18), suggesting that there was no difference in efficacy.
Discussion
The present work applied methods, initially presented in the context of a meta-analysis comparing 2 treatment effects with a categorical outcome, to the analysis of multi-center-antimalarial trials, comparing 3 treatments, with a 4-categorical primary outcome, using individual patient data. All the methods were implemented using free available softwares. Their performances were assessed using simulated data sets. Both a frequentist and Bayesian approaches were implemented. In the simula-tion settings, we considered a general case of a mixed
effects model. The ML method was faster than the IGLS and GEE methods. All the methods produced minimal biases. Another R function can be used like lrm (Hmisc
library using the library Design) which is more restricted at present in the choice of the link functions.
Our results from the multi-centre trial showed a signif-icant decrease in efficacy in the sulfadoxine-pyrimethamine-arm as compared with the amodiaquine -arm. This means that there was less ACPR and more fail-ures with SP. No significant difference was observed between amodiaquine and the combination AQ + SP. Similar results hold for both the frequentist and Bayesian approaches. The proportional odds assumption between treatments was not rejected. The proposed model can be a useful way when dealing with a small number of centers with more than 2 treatments.
Regarding the dependence between the outcome and the explanatory variables, a recent study [15] reported patient's age as a significant factor associated with anti-malarial treatment failure, more specifically with artemisinin derivatives and quinine. Indeed, the study showed that children less than 5 years old had a
signifi-Table 5: Effect of individual covariates on the ordinal outcome.
Univariate Multivariate
Est SD Z-value Est SD Z-value
Global covariates
- Treatment (Reference: AQ)
SP/AQ -1.776 0.633 2.805 -1.638 0.566 2.893
AQ+SP/AQ 1.797 1.533 1.172 1.418 1.128 1.257
- Center (Reference: Yaoundé)
Bert/Ydé 0.100 0.550 0.181
Gar/Ydé 0.458 0.589 0.777
Individual covariates
- Baseline temperature* -0.577 0.264 2.18 -0.614 0.266 2.308**
- Fever before inclusion -0.003 0.070 0.05
- Parasitemia -0.072 0.071 1.02
- Hematocrit Day 0 0.341 0.518 0.74
- Automedication Y/N 0.014 0.524 0.03
- Age B/A 0.391 0.511 0.77
- Age C/A 0.989 0.728 1.35
- Age (months) 0.010 0.012 0.87
- Gender M = 1/F = 0 0.279 0.468 0.60
- Bodyweights* 1.373 0.716 1.91 0.113 0.06 1.91
cant risk of treatment failure as compared with children more than 5 years. In our analysis, no significant age effect was found, but our data concerned mostly children less than 5 years. Covariates, like haematocrit, gender, auto-medication before study enrollment, were not sig-nificant. In contrast, the baseline temperature was signifi-cantly associated with the outcome, showing that patients with a low temperature at inclusion were more likely to have a good treatment response. For the SP treatment, the decrease could be related to a gene mutation, respon-sible for a resistance towards SP [16-18]. The SP resis-tance was also confirmed in a recent study in South Africa [19]. The emergence of resistance led to the use of Artemisinin-based Combination Therapies (ACTs) which play an important role in the reduction of malaria transmission [20]. Thus, ACTs are widely used as first-line treatment of malaria in Africa [21-28].
The present work presented some statistical methods to handle the WHO criteria globally. They appear adapted for assessing antimalarial treatment in clinical trials, or in other studies with an ordinal outcome. It con-trasts with previous methods [15], which reduced the outcome into a binary variable, for instance ACPR versus
non ACPR. Only 3.5% were missing data. By eliminating drop-out or excluded patients in the final analysis, we assumed that they were missing completely at random (MCAR). Incorporating these into the analysis would require an imputation of the missing category. For such imputation, wide-range methods have been studied [29], but remain a topic to study in the case of malaria.
Other study designs are presently available in which patients have repeated standardized visits during their follow-up. Thus repeated categorical responses are avail-able for each subject. All methods used in the case of a Table 6: Model fitting with the complementary log-log link function and results comparisons.
ML ML ML ML
Logit Cloglog Logit Cloglog
Category cut-points
α1 3.850 1.297 25.980 8.201
(0.63) (0.16) (10.65) (3.54)
α2 4.237 1.431 26.39 8.346
(0.65) (0.17) (10.66) (3.54)
α3 4.380 1.478 26.540 8.401
(0.6¬¬6) (0.17) (10.66) (3.54)
Treatment (Reference AQ)
SP/AQ -1.938 -0.524 -1.638 -0.502
(0.63) (0.16) (0.57) (0.16)
AQ+SP/AQ 0.537 0.348 1.416 0.329
(0.97) (0.24) (1.13) (0.23)
Center (Reference Yaoundé)
Bert/Ydé 0.196 -0.016
(0.51) (0.17)
Gar/Ydé 0.460 0.123
(0.53) (0.18)
Individual Covariate
Baseline temperature -0.604 0.188
(0.27) (0.09)
Bodyweights 0.113 0.037
(0.06) (0.02)
single categorical response, can however, be extended to repeated categorical responses [30].
Conclusion
The approach of modeling the WHO criterion as an ordi-nal criterion is innovative in the sense that, it gives a gain of information and precision on the estimate of the treat-ment effect using a global analysis of the four-category outcome instead of either comparing the rate of ACPR only, without being able to differentiate treatments when they present an identical percentages in the ACPR cate-gory but, different repartitions in the remaining three other categories, or repeating a similar binary analysis for each category, then exposing to the increase of the type-1 error. This analysis could help in avoiding a conclusion on an equal treatment effect whereas there is not or, vice-versa. In addition, this approach is able to take into account individual's covariates to improve the prediction of efficacy.
Additional material
Abbreviations
OCEAC: organisation de coordination pour la lutte contre les endémies en Afrique Centrale; IRD: institut de recherche pour le développement; SP: sulpha-doxine-pyrimethamine; AQ: amodiaquine.
Competing interests
The authors declare that they have no competing interests.
Authors' contributions
SYW developed the analysis plan and carried out both the statistical analyses and software implementations under the close supervision of HG and JCT. She also drafted the manuscript. LKB was responsible for the overall data collection. All authors read and approved the final manuscript.
Acknowledgements
The authors thank OCEAC and IRD, for the use of the malaria data set. They would also like to thank Jean-Louis Foulley (INRA, Jouy en Josas, France), Chan-tal Guihenneuc (Paris Descartes), and Adeline Samson (Paris Descartes) for their advices in the choice of the prior distribution in the Bayesian analysis. The first author was supported in this work by an IRD (Institut de Recherche pour le Développement) doctoral Grant.
Author Details
1Université de Yaoundé I, Ecole Nationale Supérieure Polytechnique, Département de Mathématiques et Sciences Physiques, B. P. 8390, Yaounde, Cameroon, 2Université Paris Descartes, Laboratoire de Mathématiques Appliquées (MAP5), Unité Mixte de Recherche 8145, Centre National de la Recherche Scientifique, 45 rue des Saints Pères, 75006 Paris, France and 3Université Aix-Marseilles 2, Unité de recherche sur les maladies infectieuses et tropicales émergentes (URMITE). Unité Mixte de Recherche 198-Institut de recherche pour le développement. Faculté de Médecine la Timone, 27 boulevard Jean Moulin, 13385 Marseille Cedex 5, France
References
1. Agresti A: Categorical Data Analysis. 2nd edition. New Jersey, Wiley; 2002.
2. Liu I, Agresti A: The Analysis of Ordered Categorical Data: An Overview and a Survey of Recent Developments. Societas de Estadistica e Investigacion Operativa 2005, 14:1-73.
3. Harrell FE Jr: Regression modeling strategies with applications to linear models, logistic regression, and survival analysis. New York, Springer; 2001.
4. Ryu E, Agresti A: Modeling and inference for an ordinal effect size measure. Statist Med 2008, 27:1703-1717.
5. Whitehead A, Whitehead J: A general parametric approach to the meta-analysis of randomized clinical trials. Statist Med 1991, 10:1665-1677. 6. Whitehead A, Jones NMB: A meta-analysis of clinical trials involving
different classifications of response into ordered categories. Statist Med
1994, 13:2503-2515.
7. Whitehead A, Omar RZ, Higgins JPT, Savaluny E, Turner RM, Thompson SG:
Meta-analysis of ordinal outcomes using individual patient data.
Statist Med 2001, 20:2243-2260.
8. Poon WY: A latent normal distribution model for analysing ordinal responses with applications in meta-analysis. Statist Med 2004,
23:2155-2172.
9. World Health Organization: Assessment and monitoring of antimalarial drug efficacy for the treatment of uncomplicated falciparum malaria. Geneva: World Health Organization; 2003. WHO/HTM/RBM/2003.50 10. World Health Organization: Antimalarial Drug Combination Therapy.
Report of a WHO Technical Consultation. Geneva: World Health Organization; 2001. WHO/CDS/RBM/2001.35
11. Whegang SY, Tahar R, Foumane VN, Soula G, Gwét H, Thalabard JC, Basco LK: Efficacy of non-artemisinin and artemisinin-based combination therapies for uncomplicated falciparum malaria in Cameroon. Malar J
2010, 9:56.
12. McCullagh P: Regression models for ordinal data. J R Statist Soc. Series B
1980, 42:109-142.
13. Fahrmeir L, Tutz G: Multivariate statistical modeling based on generalized linear models. 2nd edition. New York, Springer; 2001. 14. Kim Williamson JM, Lyles CM: Sample-size calculations for studies with
correlated ordinal outcomes. Statist Med 2005, 24:2977-2987. 15. Adama Ishag, Elmardib Khalid A, Malikb Elfatih M: Predictors of
antimalarial treatment failure in an area of unstable malaria transmission in eastern Sudan. Trans R Soc Trop Med Hyg 2009,
103:21-24.
16. Basco LK: Molecular epidemiology of malaria in Cameroon. XIX. Quality of antimalarial drugs used for self-medication. Am J Trop Med Hyg 2004,
70:245-250.
17. Basco LK, Ngane VF, Ndounga M, Same-Ekobo A, Youmba JC, Abodo RT, Soula G: Molecular epidemiology of malaria in Cameroon. XXI. Baseline therapeutic efficacy of chloroquine, amodiaquine, and sulfadoxine-pyrimethamine monotherapies in children before national drug policy change. Am J Trop Med Hyg 2006, 75:388-395.
18. Basco LK: Molecular epidemiology of malaria in Cameroon. XXIII. Experimental studies on serum substitutes and alternative culture media for in vitro drug sensitivity assays using clinical isolates of Plasmodium falciparum. Am J Trop Med Hyg 2006, 75:777-782. 19. Karen Barnes I, Little Francesca, Mabuza Aaron, Mngomezulu Nicros,
Govere John, Durrheim David, Roper Cally, Watkins Bill, Nicholas White J:
Increased gametocytemia after treatment: an early parasitological
Additional file 1 RUtilities. Some utility functions for the fixed effect model using R codes.
Additional file 2 Data. The simulated data set on which we illustrated the different fixed effects methods. It contains 14 columns whose descriptions are detailed in the additional file 5.
Additional file 3 MixedModelWinBUGSCode. WinBUGS code for the mixed effects model. To be run after having installed the WinBUGS 1.4 free software downloadable at http://www.mrc-bsu.cam.ac.uk/bugs/winbugs/ contents.shtml.
Additional file 4 FixedModelRCode. This file contains a code to estimate the different mixed effect models. They were run under the software R ver-sion 2.5. The order of execution is given in the corresponding file.
Additional file 5 ExampleOutputFile. This file contains the description of the simulated data set. It provides some outputs of the programs written in the additional file 4.
Received: 27 September 2009 Accepted: 18 June 2010 Published: 18 June 2010
This article is available from: http://www.biomedcentral.com/1471-2288/10/58 © 2010 Whegang et al; licensee BioMed Central Ltd.
This is an Open Access article distributed under the terms of the Creative Commons Attribution License (http://creativecommons.org/licenses/by/2.0), which permits unrestricted use, distribution, and reproduction in any medium, provided the original work is properly cited.
indicator of emerging sulfadoxine-pyrimethamine resistance in falciparum malaria. J Infect Dis 2008, 197:1605-1613.
20. Okell LC, Drakeley CJ, Ghani AC, Bousema T, Sutherland CJ: Reduction of transmission from malaria patients by artemisinin combination therapies: a pooled analysis of six randomized trials. Malar J 2008,
7:125.
21. Kayentao K, Maiga H, Newman RD, McMorrow ML, Hoppe A, Yattara O, Traore H, Kone Y, Guirou EA, Saye R, Traore B, Djimde A, Doumbo OK:
Artemisinin-based combinations versus amodiaquine plus sulphadoxine-pyrimethamine for the treatment of uncomplicated malaria in Faladje, Mali. Malar J 2009, 8:5.
22. Yeka A, Dorsey G, Kamya MR, Talisuna A, Lugemwa M, Rwakimari JB, Staedke SG, Rosenthal PJ, Wabwire-Mangen F, Bukirwa H: Artemether-lumefantrine versus dihydroartemisinin-piperaquine for treating uncomplicated malaria: a randomized trial to guide policy in Uganda.
PLoS One 2008, 3:e2390.
23. Kabanywanyi AM, Mwita A, Sumari D, Mandike R, Mugittu K, Abdulla S:
Efficacy and safety of artemisinin-based antimalarial in the treatment of uncomplicated malaria in children in southern Tanzania. Malar J
2007, 6:146.
24. Van den Broek I, Kitz C, Al Attas S, Libama F, Balasegaram M, Guthmann JP:
Efficacy of three artemisinin combination therapies for the treatment of uncomplicated Plasmodium falciparum malaria in the Republic of Congo. Malar J 2006, 5:113.
25. Guthmann JP, Cohuet S, Rigutto C, Fortes F, Saraiva N, Kiguli J, Kyomuhendo J, Francis M, Noėl F, Mulemba M, Balkan S: High efficacy of two artemisinin-based combinations (artesunate + amodiaquine and artemether + lumefantrine) in Caala, Central Angola. Am J Trop Med Hyg
2006, 75:143-145.
26. Guthmann JP, Ampuero J, Fortes F, van Overmeir C, Gaboulaud V, Tobback S, Dunand J, Saraiva N, Gillet P, Franco J, Denoncin A, van Herp M, Balkan S, Dujardin JC, D'Alessandro U, Legros D: Antimalarial efficacy of chloroquine, amodiaquine, sulfadoxine-pyrimethamine, and the combinations of amodiaquine + artesunate and sulfadoxine-pyrimethamine + artesunate in Huambo and Bie provinces, central Angola. Trans R Soc Trop Med Hyg 2005, 99:485-492.
27. Priotto G, Kabakyenga J, Pinoges L, Ruiz A, Eriksson T, Coussement F, Ngambe T, Taylor WR, Perea W, Guthmann JP, Olliaro P, Legros D:
Artesunate and sulfadoxine-pyrimethamine combinations for the treatment of uncomplicated Plasmodium falciparum malaria in Uganda: a randomized, double-blind, placebo-controlled trial. Trans R Soc Trop Med Hyg 2003, 97:325-330.
28. Adjuik M, Babiker A, Garner P, Olliaro P, Taylor W, White N: International Artemisinin Study Group. Artesunate combinations for treatment of malaria: meta-analysis. Lancet 2004, 363:9-17.
29. Philipson PM, Ho WK, Henderson R: Comparative methods for handling drop-out in longitudinal studies. Statist Med 2008, 27:6276-6298. 30. Parsons NR, Costa ML, Achten J, Stallard N: Repeated measures
proportional odds logistic regression analysis of ordinal score data in the statistical software package R. Comput Stat Data Anal 2009,
53:632-641.
Pre-publication history
The pre-publication history for this paper can be accessed here: http://www.biomedcentral.com/1471-2288/10/58/prepub
doi: 10.1186/1471-2288-10-58