R
EGULARA
RTICLEARIADNE
–
a program estimating covariances in detail
for neutron experiments
Denise Neudecker*
Los Alamos National Laboratory, Los Alamos, NM, USA
Received: 16 November 2017 / Received infinal form: 5 February 2018 / Accepted: 4 May 2018
Abstract.The python program ARIADNE is a tool developed for evaluators to estimate detailed uncertainties and covariances for experimental data in a consistent and efficient manner. Currently, it is designed to aid in the uncertainty quantification of prompt fission neutron spectra, and was employed to estimate experimental covariances for CIELO and ENDF/B-VIII.0 evaluations. It provides a streamlined way to estimate detailed covariances by (1) implementing uncertainty quantification algorithms specific to the observables, (2) defining input quantities for typically encountered uncertainty sources and correlation shapes, and (3) automatically generating plots of data, uncertainties and correlations, GND formatted XML and plain text outputfiles. Covariances of the same and between different datasets can be estimated, and tools are provided to assemble a database of experimental data and covariances for an evaluation based on ARIADNE outputs. The underlying IPython notebook files can be easily stored, including all assumptions on uncertainties, leading to more reproducible inputs for nuclear data evaluations. Here, the key inputs and outputs are shown along with a representative example for the current version of ARIADNE to illustrate its usability and to open a discussion on how it could address further needs of the nuclear data evaluation community.
1 Introduction
At the “CW2017” workshop, progress on covariance estimation for and evaluation of prompt fission neutron spectra (PFNS) was shown. One key point was that estimating experimental covariances in detail versus extracting total uncertainties from EXFOR [1,2] and using simplifying assumptions for the total correlations may results in significantly different evaluated PFNS, bench-mark calculations and associated uncertainties. For instance, the effective multiplication factor, keff, of the
Jezebel critical assembly changes by nearly 200 pcm if a detailed versus a simplified experimental covariance matrix is used as input for an evaluation of the 239Pu PFNS induced by neutrons of 500 keV [3]. This change is significant, given that a difference of 270 pcm inkeff of a
Plutonium system can lead from a controlled to an uncontrolled reaction.
Given that a detailed uncertainty estimate for experi-mental data may significantly impact evaluations and application calculations, the python program ARIADNE was developed to estimate experimental covariances for evaluation purposes in detail in a consistent and streamlined manner. This program was developed concurrently and
partially in support of work for the IAEA coordinated research project on PFNS [4], and was subsequently used to provide input for CIELO [5] and ENDF/B-VIII.0 [6]
235U PFNS evaluations [7]. ARIADNE was designed such
that documenting the experimental covariances is straight-forward. All assumptions in the estimation process are explicitly stored in ARIADNE input decks and the output is given in GND format [8] (As an example, the documenta-tion for experimental 235U PFNS covariances is given in Ref. [9]). This feature should support guaranteeing the reproducibility of (evaluated) data–a fundamental principle of science which is often violated as rarely all input used to generate evaluated data is readily available for the whole community. Therefore, ARIADNE could provide input for the WPEC Subgroup 44 on “Investigation of Covariance Data in General Purpose Nuclear Data Libraries” [10] on guidelines how evaluators can document their evaluations. ARIADNE can be currently used to estimate experi-mental covariances for PFNS. An extension to estimate covariances for measured neutron-induced fission cross-sections is in progress.Section 2shows the input necessary for estimating the total covariances of PFNS with ARIADNE, the automatically generated output files and how it can be used to estimate covariances between different experimental datasets and assemble databases from multiple experimental datasets for evaluation purposes. The example in Section 3 will illustrates how
* e-mail:[email protected]
©D. Neudecker, published byEDP Sciences, 2018
https://doi.org/10.1051/epjn/2018012 & Technologies
Available online at:
https://www.epj-n.org
ARIADNE can be used to estimate a total covariance matrix for one particular dataset. Section 4 summarizes and provides an outlook to future developments.
2 General Description of ARIADNE
2.1 Input
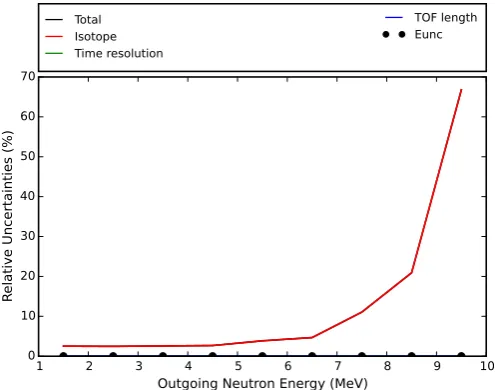
The ARIADNE input parameters, assumptions and data can be transparently stored in an IPython or Jupyter notebook. From this notebook, ARIADNE will be run and the output plots and data files will be automatically generated. These notebooks can be easily exchanged between evaluators and can be converted to LaTeX or pdf format and thus facilitate the documentation of the input assumptions for estimating experimental covariances. For estimating total covariances for measured PFNS with ARIADNE, it needs to be specified whether the data are“shape”,“shape ratio”or“shape ratio calibration”data. In a shape measurement, the detector efficiency is determined explicitly, while in a ratio experiment the detector efficiency cancels as the measured ratio data were measured with the same detector. In a ratio calibration measurement, the detector efficiency is obtained by a measurement of the monitor PFNS and using a numerical representation for this measured PFNS. It is important to specify which measurement type PFNS data belong to as different uncertainty sources need to be considered for specific measurement types and the actual algorithms to estimate total covariances differ as outlined in Section III.M of reference [4]. For instance, if a time resolution of 1 ns for a time-of-flight (TOF) length of 1 m is converted to an uncertainty relative to the PFNS using a Maxwellian temperature of 1.33 and 1.42 MeV for the investigated and monitor isotope, the resulting uncertainties are distinctly different inFigure 1depending on what data type is used. The time resolution uncertainty relative to the PFNS substantially reduces for shape ratio data compared to shape data while the time resolutions of the investigated and monitor isotope measurement need to be considered for shape ratio calibration data leading to increased uncer-tainties compared to shape data.
The covariance estimation algorithms presented in Section III.M of reference [4] were implemented in ARIADNE to estimate total covariances for PFNS experimental data. The algorithms are summarized in the Appendix of this paper for the sake of completeness and to link the ARIADNE input quantities defined below with the algorithms in reference [4].
The commands to invoke the total covariance estimation are “PFNS_shape(general_info, data, trsl, tof_length, maxw_t_iso, unc_iso)”,“PFNS_ratio(general_info, data, trsl, tof_length, reference, maxw_t_iso, maxw_t_ref, unc_iso, unc_ref)” and “ PFNS_ratiocalibration(gener-al_info, data, trsl, tof_length, reference, maxw_t_iso, maxw_t_ref, unc_iso, unc_ref)”with the following input quantities:
general_info:This dictionary contains general infor-mation specifying the observable, naming the dataset, the output files/folders and some documentation. For the following keys, values need to be provided:
– name: a string naming the experiment,
– isotope: a string specifying the isotope under investiga-tion,
– quantity: for the current class this is the string“PFNS”,
– reaction: a string, either“n,f”for neutron-induced PFNS, or“sf”for spontaneousfission,
– output_file: a string specifying the XML file name and path,
– output_folder: a string specifying the path to the folder where the output plots should be stored,
– documentation: a string including documenting infor-mation for the measurement, such as the EXFOR-entry number, literature references and general com-ments on the uncertainty estimate and assumptions made in it.
data:This dictionary contains the data of the dataset with the following keys:
– no_einc: integer specifying the number of different incident neutron energies for which data are given,
– einc:float array of the length of the data containing the incident neutron energies,
– einc_unit: string specifying the unit of einc, e.g.,“eV”,
– eout:float array of the length of the data containing the outgoing neutron energies,
– eout_unit: string specifying the unit of eout, e.g.,“MeV”,
– eout_unc:float array of the length of the data containing uncertainties associated with eout,
– eout_unc_unit: string specifying the unit of eout_unc, e.g.,“%”,
– eout_unc_type: string containing the type of correla-tions between eout_unc with opcorrela-tions described below,
– eout_unc_type_arg: a dictionary containing informa-tion necessary to invoke specific types of eout_unc_type as specified below,
– values:float array of the data,
– values_unit: string of units of values.
Currently,five different pre-defined shapes can be used to assign correlation matrices for partial uncertainties with the keys “eout_unc_type” in the dictionaries data and unc_ref or“type”in the dictionaries unc_iso and unc_ref as defined in this section. All pre-defined correlation matrices satisfy mathematical criteria imposed on correlation matri-ces. Their diagonal entries are one and their off-diagonal entries assume values between1 and 1. The matrices are all symmetric and positive semi-definite. The value
“Diagonal”returns a correlation matrix with all off-diagonal entries zero, while for “Positive_fully” all off-diagonal entries are one. “Constant” results in off-diagonal entries all assuming the same value within the interval [0,1]. This value is specified within the dictionary eout_unc_type_arg in the dictionaries data and unc_ref or type_arg in the dictionaries unc_iso and unc_ref with the key “ damp_-term”. For damp_term, a one-dimensional array of floats with lengthnis provided with each entry corresponding to the n different partial uncertainties provided. The value
“Gaussian”provides a correlation matrix with shape:
Cori;j¼exp
c Ei
outEjout
max Ei
out;Ejout
2 4
3 5 2 8
> < > :
9 > = > ;;
where the constant damping factorcwith values between 0
and 1 is defined with the key damp_term in the
dictionaries eout_unc_type_arg or type_arg. In addition toc, the energiesEoutof the PFNS need to be provided with
the keyword “eout” with the same dictionaries. The correlation matrix“Gaussian-Anticorrelated”is very simi-lar to the one termed Gaussian,
Cora
i;j¼Cori;jAi;jð ÞEt ;
except for the matrixAi,j with matrix entries of 1 if the
energiesEioutandEjoutare both either larger or smaller than
Etand1 otherwise. The values ofcandEioutare provided as described above. In addition,Etis provided with the key
“eout-turningpoint”with the same dictionaries.
trsl:This dictionary contains all information necessary to estimate uncertainties due to thefinite time resolution for a PFNS measurement with keys:
–value: afloat with the time resolution, can be afloat array of the same length as the data if multiple time resolutions are given for one dataset,
–unit: string of unit of value,
–ref_value [only ratio and calibration measurements]: a float with the time resolution of the monitor measure-ment, can be afloat array of the same length as data if multiple time resolutions are given for one dataset,
–ref_unit [only ratio and calibration measurements]: string of unit for ref_value.
tof_length:This dictionary contains all information needed to include TOF length uncertainties in a total PFNS covariance matrix. Even if the TOF length uncertainty itself is zero, a TOF length needs to be provided to estimate time resolution uncertainties. The keys of this dictionary are:
– value: afloat with the TOF length of the measurement, can be a float array of the same length as the data if multiple TOF lengths were used,
– value_unit: string of unit of value,
– unc:float of TOF length uncertainty, can be afloat array of the same length as the data if multiple TOF length uncertainties are given,
– unc_unit: string of unit of unc,
– ref_value [only ratio calibration measurements]: afloat with the TOF length of the monitor measurement, can be afloat array of the same length as data if multiple TOF lengths are given for one dataset,
– ref_value_unit [only ratio calibration measurements]: string of unit for ref_value,
– ref_unc [only ratio calibration measurements]: a float with the TOF length uncertainties of the monitor measurement, can be a float array of the same length as data if multiple TOF length uncertainties are given for one dataset,
– ref_unc_unit [only ratio calibration measurements]: string of unit for ref_unc.
maxw_t_iso: This dictionary contains information on the Maxwellian temperature fitted to the measured PFNS. This information is necessary to convert TOF length uncertainties or a time resolution in length units into uncertainties relative to the PFNS which is an essential steps towards generating a total PFNS covariance matrix. The keys are:
– value: afloat with the Maxwellian temperaturefitted to the measured PFNS, can be afloat array of the same length as the data if multiple Maxwellian temperatures are given. Multiple Maxwellian temperatures are usually provided for measurements at different einc,
– unit: string of unit of value, e.g.,“MeV”.
maxw_t_ref: [only ratio and calibration measure-ments] A dictionary containing the same information as maxw_t_iso except for the monitor isotope.
unc_iso: This dictionary contains partial uncertain-ties for the PFNS measurements as well as information necessary to estimate their correlation matrices. The keys are:
– values: a two-dimensional array offloats with as many columnsnas uncertainty sources given and as many rows as data points,
– units: string array of length of columns n in values specifying the unit of each uncertainty source in values. Entry one corresponds to column one in values, and so on,
– type: string array of length ofnin values specifying the type of correlation matrix for each uncertainty source described above. Entry one corresponds to column one in values, and so on,
– type_arg: a dictionary containing information necessary to invoke specific types of correlations related to the key type as specified above.
–eout_unc:float array of the length of the data containing the energy uncertainties of the monitor measurement,
–eout_unc_unit: string of unit of eout_unc, e.g.,“%”,
–eout_unc_type: string containing the type of correla-tions between eout_unc with opcorrela-tions described above,
–eout_unc_type_arg: a dictionary containing informa-tion necessary to invoke specific types of eout_unc_type as specified above.
reference:[only ratio and calibration measurements] This dictionary contains the information necessary to specify the monitor isotope, reaction and the nuclear data which should be used to convert ratio PFNS to PFNS. The keys are:
–isotope: string specifying the monitor isotope,
–quantity: string specifying the observable measured with the monitor isotope. This key will have the value“PFNS” here,
–reaction: a string, either“n,f”for neutron-induced PFNS, or “sf”for spontaneousfission,
–identifier: a string identifying the dataset that can be used. Available datasets are listed in the function Manage_ReferenceData.py. The data of Mannhart [11,12] with identifier “Mannhart-Pointwise” were fre-quently used for establishing a database of 235U PFNS [9].
2.2 Output
ARIADNE automatically produces the following output in the folder specified with the variable output_folder:
–an XML output file with a filename specified with the variable output_file is provided in GND format [8]. This file contains the information provided in the variable documentation, the incident and outgoing neutron energy, the total relative uncertainty, the PFNS and the total correlation matrix. If the original data are given in ratio to a monitor PFNS, the ratio data are converted to PFNS data using the nuclear data specified in
“identifier”for the monitor PFNS;
–the simple text-file“Partial_Unc.dat”contains incident neutron energies, outgoing neutron energies, PFNS, total and all partial uncertainties relative to the PFNS;
–a simple text-file“TotalCor.dat”containing the correla-tion matrix associated with the total relative uncertain-ties in Partial_Unc.dat;
–plots of the PFNS for all incident neutron energies, partial and total relative uncertainties for all incident neutron energies, total and partial uncertainty correla-tion matrices are automatically generated. If the provided PFNS are ratio or ratio calibration data, also plots showing the interpolated monitor PFNS compared to the original ones are provided.
2.3 Covariances between experiments
The estimation of covariances between PFNS of different experiments uses current ARIADNE capabilities for estimating PFNS covariances for single experiments. In the future, a module will be developed that suggest possible
matches leading to correlations between uncertainty sources of two experiments and the possibility to select a correlation factor. Right now, covariances between differ-ent experimdiffer-ents can be estimated with ARIADNE by invoking a total covariance estimation procedurefirst for both measurements in the same IPython-notebook. Then, correlations between different partial uncertainty sources of two experiments are estimated by accessing the partial covariances of each experiment and cross-correlating them using functions of ARIADNE. A text outputfile with the covariances between those experiments is produced which can be used as input to assemble an experimental database for an evaluation.
2.4 Assembling a database as input for evaluations
Two steps need to be performed when assembling a database of experimental data and covariances for a PFNS evaluations: As afirst step, the experimental PFNS have to be scaled with a constant factor for each experimental dataset at one incident neutron energy with respect to either a model curve or general basis function used as the prior for the evaluation [13] as all PFNS data are treated as shape data for evaluation purposes. This step ensures that the x2 between experimental data and the prior mean values only reflects differences in the actual shape and not due to the scaling of the data. In the second step, the experimental database is assembled from different datasets and their associated covariances and cast into a format readable by evaluation codes used for evaluations of reference [7].
In ARIADNE, the function “ Assemble_Plot_PFNS-Database (experimental_data, reference_data, output_ folder,{}, perform_tasks)”performs these two steps with the following input observables:
– experimental_data: a dictionary with the keys
“paths” (providing an array of strings specifying the XML outputfiles produced by ARIADNE which should be included in the database), “Eout_lower” and
“Eout_upper” (one-dimensional arrays of floats with lengths of number of datasets specified in paths providing the energy range of the data used for scaling. If 0 is given, the full energy range of the data is used for scaling),
– reference_data: a dictionary with the keys “path” (string identifying the dataset to which experimental data are scaled to), “Tmaxw” (a float specifying the temperature of the Maxwellian which is used to plot the PFNS in ratio to it),“Tmaxwunit”(a string with the unit of Tmaxw),“Name”(a string used to name the reference data in the legend of the plots), “Isotope” (a string identifying the isotope in the ZZZAAA notation),
– output_folder:string with name of the output folder where data files and plots should be stored. If none is given, they will be stored in the src folder of ARIADNE,
–perform_tasks: an array of strings specifying which tasks the program should execute.“ Plot_Experimental-Data_vs_Reference” plots experimental data versus reference data in the folder output_folder. “ Write_-ScaledData_ToOneFile” writes incident neutron ener-gies, outgoing neutron enerener-gies, the scaled experimental data and relative uncertainties to a text file named
“DataBase_Single_Rescaled_Experiments.dat” in the folder output_folder. “Write_DatabaseOutputfile” writes database to the file “DataBase_ForEvaluation. dat”into the folder output_folder in a format readable by an evaluation program used for reference [7] but can be extended to other formats if needed.
3 Example
As example, it is shown how total covariances for the235U PFNS analyzed by Lestone et al. [14,15] are estimated using ARIADNE . This particular dataset was chosen as only nine data points are provided leading to a relatively small XML-output file which can be easily shown here. Also, the uncertainty sources listed in the input deck shown inFigure 2can be easily aligned with partial uncertainties given in reference [15] for Lestone et al. PFNS.
Lestone et al. PFNS are shape data and, thus the ARIADNE function PFNS.shape() is called in the input deck inFigure 2with function arguments as described in
Section 2. For instance, it is specified that Lestone et al. data are235U PFNS and a documentation is provided with references to the literature used for the uncertainty estimate and assumptions made for the estimation process. The partial uncertainty sources and their correlation coefficients are specified with the dictionary “unc_iso”. Eight different uncertainty sources are provided as ARIADNE input following closely reference [15]. For each partial uncertainty source, a vector of partial uncertainties and information on the shape (e.g., most of them have Gaussian shape, except the fully correlated time resolution uncertainties and diagonal statistical uncertainties). The dictionary“trsl”contains a zero time resolution as Lestone et al. provided already time resolution uncertainties relative to the PFNS which are considered within the dictionary “unc_iso”. The dictionary trsl must still be provided, even if the time resolution itself is zero, to remind the user that such an uncertainty would need to be accounted for when estimating uncertainties of measured PFNS. The same reasoning applies why a dictionary
uncertainty relative to the PFNS for Lestone et al. data. ARIADNE was programed that way as most PFNS measurements provide non-zero time resolution and TOF length uncertainty values, and by having to make the deliberate choice that they are zero, it is less likely that these uncertainty sources are forgotten during the estima-tion process.
Figures 3–5 show plots automatically produced by ARIADNE to visualize the estimated covariances. The PFNS values shown in Figure 3 are given in ratio to a Maxwellian with a temperature specified in maxw_t_iso along with their total 1-sigma uncertainties estimated using ARIADNE.Figure 4shows relative uncertainties for four different—partially combined—uncertainty sources compared to the total uncertainties and, thus, helps in roughly identifying the major uncertainty sources of this measurement. All uncertainty sources for this particular
measurement, including the time resolution and TOF length uncertainty, are given relative to the PFNS and are combined into the uncertainties titled“Isotope”. Therefore, the total uncertainties are the same as the “Isotope” uncertainties for the case of Lestone et al. PFNS. The total correlation matrix in Figure 5 is strongly positively correlated for neighboring energy bins while energy bins far apart are less strongly correlated. This behavior of the correlations was expected given that most uncertainty sources listed in the input deck were assumed to have a Gaussian type correlation. More plots were produced (e.g., PFNS not in ratio to a Maxwellian, PFNS and relative uncertainties on a logarithmic scale and correlation matrices for each uncertainty source listed in the legend ofFig. 4), but are not shown here as they would not add more information on this dataset. For instance, the correlation matrix for the uncertainty source termed
“Isotope” within ARIADNE is the same as that one of
Figure 5 given that all uncertainty sources are given relative to the PFNS for Lestone et al. data.
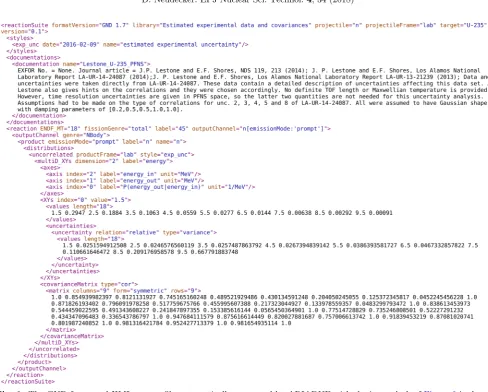
Apart from thefigures, a GND formatted XML output file as shown inFigure 6is produced. It not only provides incident and outgoing neutron energies, PFNS, total relative uncertainties and correlations, but also unambig-uously specifies the data as experimental235U PFNS and provides a documentation.
4 Summary and future developments
The program ARIADNE to estimate covariances in detail for neutron experiments was presented. This program was designed for evaluators to consistently estimate covarian-ces of single datasets, between different experimental datasets and assemble a database from these estimated covariances for evaluation purposes.
Right now, ARIADNE was developed to estimate covariances for PFNS experiments. Currently, no openly available tool exists specifically designed for detailed covariance estimates for experimental PFNS data while IAEA tools connected to EXFOR exist which help in Fig. 3. A plot of Lestone et al. PFNS data with total 1-sigma
uncertainties estimated by ARIADNE using the input deck in
Figure 2is shown as automatically generated by the program.
Fig. 5. A plot of the total correlation matrix estimated for Lestone et al. PFNS using ARIADNE with the input deck in
Figure 2is shown as automatically generated by the program.
estimating covariances for neutron induced cross-sections [16]. ARIADNE streamlines the detailed uncertainty estimate– usually a time and labor-intensive procedure– by providing algorithms for estimating PFNS uncertainties for typical PFNS measurement types [4], converting data given as ratio to a monitor PFNS into PFNS data, providing shapes of typical correlation matrices for partial uncertain-ties and automatically producing from this information total covariances, plots and GND formatted XML and plain text output files. The program relies on input for partial uncertainty sources, information on their correlation as well as important parameters of a PFNS measurement (e.g., time resolution, TOF length). Hence, while ARIADNE facilitates and fastens the uncertainty process, the evaluator still has to extract and identify uncertainties from EXFOR entries and the literature of a dataset.
ARIADNE is written in python and its inputfiles can be stored as IPython or Jupyter notebooks. These inputfiles can be easily exchanged between evaluators and converted conveniently to LaTeX or pdf format for documentation purposes. Given the straightforward possibilities to docu-ment the experidocu-mental database entering an evaluation,
ARIADNE can help in making evaluations more reproduc-ible given that experimental covariances entering evalua-tions are still rarely documented.
Currently, ARIADNE is being updated to estimate total covariances for neutron-inducedfission cross-section data. It is planned that an additional layer is added to ARIADNE which requests typically uncertainty sources encountered in PFNS and fission cross-section measure-ments as listed in references [4,17]. This additional layer should help evaluators in identifying missing uncertainty sources for a particular experiment. A range of typical uncertainties might be provided to help estimating missing uncertainties. Also, a function identifying possible cross-correlations between uncertainty sources of two different experiments will be developed. Once, these parts are finished, steps will be undertaken to release the LANL ARIADNE code as open source program to the nuclear data evaluation community.
This work was carried out under the auspices of the NNSA of the U.S. Department of Energy at LANL under Contract No. DE-AC52-06NA25396.
Appendix. PFNS covariance algorithms
implemented in ARIADNE
The algorithm to estimate total covariances Cov(Nk, Nj) associated with PFNS valuesNkandNjat lattice pointsk andjare described in detail in Section III.M of reference [4] and are summarized here briefly:
CovNk;Nj
NkNj ¼ X
n
dkn;idjn;iCornk;;jiþCEk;jþCkt;jþClk;j
þdNDk dNDj CorNDk;j þX m
dmk;rdmj ;rCormk;j;r: ð1Þ
The PFNS valuesNkandNjare provided as input with the key “values” in the dictionary “data”. The variablednk;i
corresponds to the uncertainties associated with thenth uncertainty source for the measurement of the isotope in question (hence superscript i) given relative to the experimental quantity (e.g., Nk for shape data). In ARIADNE,dnk;i is provided as input for dictionary
“unc_iso” with key “values”. In the current notation,
“units” would be a vector of n strings with “%”. The correlations Cornk;;ji associated withdnk;i of uncertainty sourcenare specified with the keys“type”and“type_arg” in dictionary “unc_iso”. The termPmdmk;rdmj;rCormk;j;r provides covariances for uncertainty sources of and given relative to the reference measurement (superscriptr). This term is non-zero for shape ratio and shape ratio calibration measurements anddmk;randCormk;j;rare provided as input for ARIADNE with the dictionary “unc_ref” analogously to
“unc_iso”. The term dNDk dNDj CorNDk;j adds nuclear data covariances associated with the nuclear data used to convert shape ratio or shape ratio calibration data to PFNS shape data. This term is zero for shape data. The information to define which nuclear data and covariances should be used for dNDk dNDj CorNDk;j is provided in the dictionary“reference”.
The relative covariancesCEk;j,Ckt;j andClk;j for energy, time resolution and TOF length uncertainties, respective-ly, for shape data are given by:
CEk;j ¼dEkidEij 12Ek
Ti 1 2 Ej Ti
CorEk;;ji;
Ct k;j ¼8
ffiffiffiffiffiffiffiffiffiffiffi EkEj p
mnðliÞ2
1 2 Ek Ti 1 2 Ej Ti
ðDtiÞ2;
Clk;j ¼ 4
ðliÞ2 12ETki
1 2 Ej Ti
ðDliÞ2:
ð2Þ
The energy uncertaintiesdEik and associated correlations CorEk;;jifor the isotope in question are given relative to the outgoing neutron energy Ek as input via the keys
“eout_unc” (“eout_unc_unit”=“%” in this notation),
“eout_unc_type” and “eout_unc_type_arg” in the dic-tionary “data”. The outgoing neutron energies Ek are
provided with the same dictionary with the keyword“eout” and “eout_unit”. The Maxwellian temperature Ti of the isotope in question is provided with the dictionary
“maxw_t_iso”, while the time resolution Dti is provided with the keys“value”and“unit”in the dictionary“trsl”. The TOF lengthli and its uncertaintyDliare provided within the dictionary “tof_length” with keys “value”, “ value_u-nit”,“unc”and“unc_unit”. The mass of the neutronmnis
saved as a physical constant in ARIADNE. For shape ratio data, CEk;j,Ckt;j andClk;j read:
CkjE ¼1=Tr1=Ti2dEi
kdEijCorEk;;ji;
Ct
k;j¼8 1=T
r1=Ti
2ðDtiÞ2ðE kEjÞ3=2
mnðliÞ2 ;
Cl k;j¼
4 1 =Tr1=Ti2E
kEjðDliÞ2
ðliÞ2 ; ð3Þ
with the Maxwellian temperatureTrof the reference PFNS provided with the dictionary“maxw_t_ref”.
For shape ratio calibration data, energy uncertainties, time resolutions and TOF length uncertainties need to be provided for the measurement of the isotope in question and the reference measurement. Hence,CEk;j, Ckt;jandClk;j are computed by:
CE
k;j ¼dEikdEij 12ETki
1 2 Ej Ti
CorEk;;ji
þdErkdErj 12ETkr
1
2
Ej
Tr
CorEk;;jr;
Ct k;j¼8
ffiffiffiffiffiffiffiffiffiffiffi EkEj p mn " 1 2 Ek Ti 1 2 Ej Ti
ðDtiÞ2 ðliÞ2
þ 12ETkr
1 2 Ej Tr
ðDtrÞ2 ðlrÞ2
# ;
Clk;j ¼ 4
ðliÞ2 12ETki
1 2 Ej Ti
ðDliÞ2
þ 4
ðlrÞ2
1 2 Ek Tr 1 2 Ej Tr
ðDlrÞ2: ð4Þ
The energy uncertainties dErk and associated correlations CorEk;;jrfor the reference isotope are provided relative to the outgoing neutron energy Ek as input via the keys
“eout_unc” (“eout_unc_unit”=“%” in this notation),
References
1. Experimental Nuclear Reaction Data Library (EXFOR), IAEA Nuclear Data Section. Seehttps://www-nds.iaea.org/ exfor(accessed on 10/16/2017)
2. N. Otuka et al., Nucl. Data Sheets120, 272 (2014) 3. D. Neudecker et al., Nucl. Data Sheets131, 289 (2016) 4. R. Capote et al., Nucl. Data Sheets131, 1 (2016) 5. M.B. Chadwick et al., Nucl. Data Sheets148, 189 (2018) 6. D. Brown et al., Nucl. Data Sheets148, 1 (2018) 7. D. Neudecker et al., Nucl. Data Sheets148, 293 (2018) 8. C.M. Mattoon et al., Nucl. Data Sheets113, 3145 (2012) 9. D. Neudecker, Los Alamos National Laboratory Report
LA-UR-17-28970, 2017
10. Investigation of Covariance Data in General Purpose Nuclear Data Libraries–WPEC subgroup 44 (SG44),https://www. oecd-nea.org/science/wpec/sg44/ (accessed 10/26/2017) 11. W. Mannhart, International Atomic Energy Agency Report
IAEA-TECDOC-410, 1987 pp. 158–171
12. W. Mannhart, International Atomic Energy Agency Report INDC(NDS)-220, 1989 pp. 305–336
13. D.L. Smith et al., International Atomic Energy Agency Report INDC(NDS)-0678, 2015
14. J.P. Lestone et al., Nucl. Data Sheets119, 213 (2014) 15. J.P. Lestone et al., Los Alamos National Laboratory Report
LA-UR-14-24087, 2014
16. V. Zerkin, EPJ Web Conf.27, 00009 (2012)
17. D. Neudecker et al., EPJ Nuclear Sci. Technol.4, 21 (2018)