R E S E A R C H A R T I C L E
Open Access
Estimation of energy balance and training
volume during Army Initial Entry Training
Jeremy McAdam
1, Kaitlin McGinnis
1, Rian Ory
1, Kaelin Young
2,3, Andrew D. Frugé
4, Michael Roberts
2,3and JoEllen Sefton
1*Abstract
Background:Adequate dietary intake is important for promoting adaptation and prevention of musculoskeletal
injury in response to large volumes of physical training such as Army Initial Entry Training (IET). The purpose of this study was to evaluate training volume and dietary intake and estimate energy balance in Army IET soldiers. Methods:Dietary intake was assessed by collecting diet logs for three meals on each of three, non-consecutive days during the first week of IET. Training volume was measured across 13 weeks of training using Actigraph wGT3X accelerometers. Training intensity was classified using Sasaki vector magnitude three cut points. Energy expenditure estimates were calculated during weeks two and three of training using the modified Harris-Benedict equation and by estimation of active energy expenditure using metabolic equivalents for each classification of physical activity. All data is presented as mean ± standard deviation.
Results:A total of 111 male soldiers (ht. = ± 173 ± 5.8 cm, age = 19 ± 2 years, mass = 71.6. ± 12.4 kg) completed diet logs and were monitored with Actigraphs. IET soldiers performed on average 273 ± 62 min low, 107 ± 42 min moderate, 26 ± 22 min vigorous, and 10 ± 21 min of very vigorous intensity physical activity daily across 13 weeks. The estimated total daily energy expenditure was on average 3238 ± 457 kcals/d during weeks two and three of IET. Compared to week one caloric intake, there was a caloric deficit of 595 ± 896 kcals/d on average during weeks two and three of IET. Regression analysis showed that body weight was a significant predictor for negative energy balance (adj. R2 = 0.54, p< 0.001), whereby a 1 kg increase in body mass was associated with a 53 kcal energy deficit.
Conclusions: Based on week one dietary assessment, IET soldiers did not consume adequate calories and
nutrients to meet training needs during red phase (weeks one through three). This may directly affect soldier performance and injury frequency. IET soldiers undergo rigorous training, and these data may help direct future guidelines for adequate nourishment to optimize soldier health and performance.
Keywords: Soldiers, Diet, Energy, Training, Volume
Background
Initial Entry Training (IET) is a mentally and physically demanding military training program designed to trans-form civilians into soldiers. The transtrans-formation from ci-vilian to soldier has become more challenging as the ability of IET soldiers to respond and adapt to IET has declined over recent decades. The American population has become less active due to changes in lifestyle factors
such as increases in screen time in the place of physical activity, reductions in physically active jobs, and reduced active transportation (e.g., walking, riding bikes) [1]. Consequently, fitness levels of civilians entering IET are lower as evidenced by increases in failure rates on the initial fitness assessment of IET [2]. Lower physical fit-ness has been shown to be an important predictor of musculoskeletal injury (MSI) [2–6]. Soldier health and force readiness are greatly impacted by MSI, with MSI alone during IET estimated to cost the United States ap-proximately $384 million per year [2,7].
* Correspondence:[email protected]
1Warrior Research Center, School of Kinesiology, Auburn University, 301 Wire
Road, Auburn, AL 36849, USA
Full list of author information is available at the end of the article
Soldiers perform organized physical fitness training as well as occupational physical activity to improve physical fitness and learn soldiering skills during IET [8–10]. Organized physical fitness training is designed to expose IET soldiers to progressively increasing levels of physical training to improve endurance and strength [9]. Occupational physical activity consists of tactical and survival drills that will enable IET soldiers to carry out required duties for the completion of suc-cessful missions. These physical and cognitive efforts must be adequately fueled in order to optimize IET soldier performance.
Rapid increases in training volume and intensity have been related to higher MSI rates [11]. Few inves-tigations have quantified overall training volume in-cluding occupational physical activity. One study [12] quantified steps and distance covered by soldiers dur-ing IET and observed that those who walked more during basic combat training had a higher risk of mus-culoskeletal injury. To date, only one study [13] has investigated intensity of training in IET. However, the monitors were removed at dinnertime likely underesti-mating training volume.
Dietary intake must match training volume to fuel physiological demands. Inadequate energy is detri-mental to bone health [14, 15], immune health [16, 17], cognitive performance [18,19], as well as exercise performance in physically active populations [20, 21]. Research conducted on the dietary needs of active in-dividuals has primarily focused on power or endur-ance training populations. IET soldiers are required to complete strength, power, endurance and functional training. This suggests IET soldiers have unique fuel-ing needs due to the large variety in trainfuel-ing intensity and duration. IET soldiers likely require the higher protein needs of strength and power athletes as well as the higher carbohydrate and fat intake needs of endur-ance athletes.
Clearly understanding training volume and nutrition intakes of IET soldiers is critical in ensuring training success. However, few studies to date have examined these areas in the IET environment, and none have ex-amined both factors together in IET soldiers. Thus, the primary aims of this study were to: 1) quantify total training volume; 2) determine dietary intake; and 3) esti-mate energy balance in soldiers participating in IET. Secondary aims were to determine how dietary intake of IET soldiers compares to current nutritional recommen-dations for active individuals [22] and to determine if body size is a predictor of energy balance. We hypothe-sized IET soldiers would be in a negative energy balance and consume inadequate dietary intake. We also hypoth-esized that IET soldiers with heavier body mass would be at a greater risk for negative energy balance.
Methods
Ethical approval
The Auburn University Institutional Review Board, Army Institutional Review Board, and the Director, Re-search & Analysis Directorate Army Center approved the study procedures. For inclusion, participants had to be at least 18 years of age, healthy with no apparent dis-ease or MSI, and participating in IET. Interested poten-tial participants from one training unit received verbal explanation of the study from the study team and pro-vided written consent. One hundred eleven male IET soldiers (mean ± SD: age: 19 ± 2 yrs., height: 173 ± 5.8 cm, mass: 72.2 ± 12.5 kg) from one training unit of IET soldiers at Fort Benning, Georgia volunteered for this investigation.
Study design
This study was 14 weeks in total duration. Diet analysis and body mass information was collected during the first week of IET. Physical activity data was collected daily beginning at week two and continued ended during week 14 of IET training.
Body mass measurement
Anthropometric measures were conducted in a fasted state prior to morning physical training and breakfast on the morning of day three of IET. Urine specific grav-ity was evaluated the morning of testing using a hand-held refractometer (Manual, Atago, Tokyo, Japan) to ensure participants were properly hydrated (USG below 1.03) [23]. Height and weight were recorded with IET soldiers wearing only army issued physical training shorts, socks and underwear using a Health-O-Meter professional scale (Model 500KL, Sunbeam Products, Inc. Boca Raton, FL, USA).
Diet logs
barracks immediately following each meal to administer and obtain the diet logs.
Diet log analysis
Macronutrient and select micronutrient data for the din-ing facility foods were accessed from the Army Joint Cu-linary Center of Excellence (JCOE) website [24]. Food items not found on the JCOE menu were retrieved from the US Department of Agriculture (USDA) nutrition data base [25]. Dietary intakes and nutrient information were entered into customized excel spreadsheets (Micro-soft Excel, Micro(Micro-soft Corporation, Redmond, WA, USA), and checked by two researchers to ensure data accuracy. Dietary intake calculations were completed using R stat-istical software [26] and R Studio [27]. R programming packages, dplyr [28], tidyr [29], reshape2 [30] ez [31], car [32], vars [33], ggplot2 [34]. Total calorie, protein, fat, carbohydrate, cholesterol, and sodium intakes were ob-tained for each meal and each day. Dietary intakes were then averaged across each day of diet logs to calculate daily averages. Participants who completed at least two full days of diet logs were used in calculation of average daily intakes and energy balance. However, for the statis-tical comparison of dietary intake at each meal, only par-ticipants who completed all three meals were used in the analysis. In total, 85 participants completed all 3 days of diet logs (included in the statistical analysis), and 26 par-ticipants completed only 2 days of diet logs.
Physical activity assessment
Participants were outfitted with Actigraph wGT3X moni-tors (Actigraph, Pensacola, FL, USA). Training volume and intensity were measured across weeks 2–14 and energy bal-ance was estimated for weeks two and three of red phase during IET. Monitors were initialized using Actilife soft-ware version 13.1.1 (Actigraph, Pensacola, FL, USA). Each week of training a member of the research team met with 12 soldiers (3 per platoon) to instruct them to wear the monitors around the waist, on the right side of the body, at all times (awake and asleep), and to only remove for show-ering. At the end of each week the monitors were collected, and age, height, weight, ethnicity, and hand dominance were entered into the Actilife software for each subject. Sasaki Vector Magnitude 3 cut points were used were used to divide activity into three categories: moderate (2690– 6166 cpm), vigorous (6167–9642 cpm) and very vigorous (> 9642 cpm) [35]. A cut-point was added to classify counts less than moderate physical activity into sedentary and light intensity physical activity (Sedentary < 200 cpm, Light = 201–2689 cpm) which has been used in previous research as a cut point to delineate sedentary time from vector mag-nitude three data [36]. The monitors collected data at the recommended 30 Hz sampling rate [37]. Wear time valid-ation was also used to estimate adherence to wearing the
monitors. A day was considered valid if wear time was at least 600 min [36]. A total of 840 data points were elimi-nated from the analysis due to wear times less than 600 min. All training data was averaged per day and week of training. The data is presented in average minutes per day.
Energy expenditure estimation
Energy expenditure was estimated during weeks two and three of IET. Minutes per day were averaged for each classification of physical activity and then metabolic equivalents (MET) were assigned to each category of physical activity. The MET assignments are as follows: light = 2 METs [38], Moderate = 3–5.99 METs, Vigorous = 6–8.99 METs, Very Vigorous > 9 METs (Sasaki) [35]. We conservatively applied the lowest MET values for moderate (3 METs), vigorous (6 METs), and very vigor-ous (9 METs) physical activity to estimate active energy expenditure [35]. Once MET values were assigned, aver-age daily active energy expenditure (AEE) was estimated for each participant during weeks two and three using the Cooper Institutes MET to calorie conversion [39]:
AEE¼MET Value x Participant body weight kgð Þx Time hrsð :Þ
We estimated resting energy expenditure (REE) using the Modified Harris-Benedict equation [40]:
REE¼88:362þð13:397 x body weight kgð ÞÞ þð4:799 x Height cmð ÞÞ
−ð5:677 x age yrsð :ÞÞ
Total energy expenditure was the sum of REE and AEE. Energy balance was estimated by subtracting each participant’s caloric intake from the estimated total en-ergy expenditure; negative or positive values indicate a caloric deficit or surplus, respectively.
Data presentation and statistical analysis
significant predictor of negative energy balance. Body weight was mean centered (participants body weight – mean (body weight)) was used as the predictor for average energy balance during weeks two and three of IET. For probability testing, statistical significance was set at p< 0.05.
Results
Physical activity data
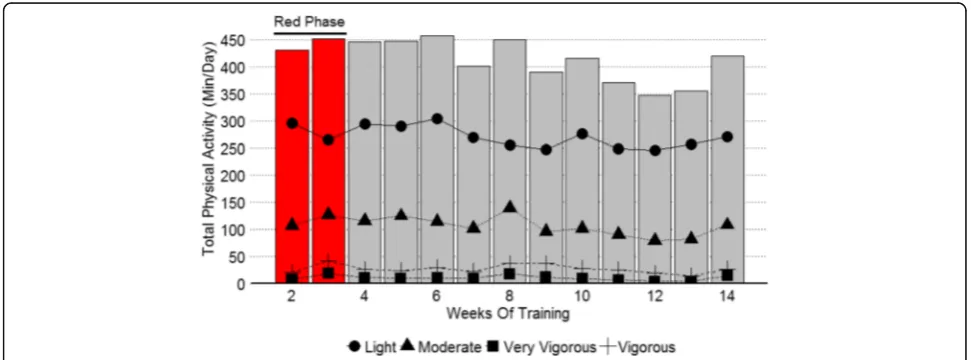
Physical activity data are presented in Fig.1. On average IET soldiers spent approximately 273 ± 62 min in light, 107 ± 42 min in moderate, 26 ± 22 min in vigorous, and 10 ± 21 min in very vigorous intensity physical activity per day during weeks 2–14 of IET. Training volume dur-ing red phase was on average 284 ± 54 min in light, 114 ± 34 min in moderate, 28 ± 21 min in vigorous and 12 ± 17 min in very vigorous physical activity. Actilife soft-ware estimated the activity monitors were not worn (non-wear time) an average of 322 min per day. This non-wear time was inversely correlated with time spent in light intensity (Moderate Correlation: −0.51) and moderate intensity (Small Correlation: −0.33) exercise. Therefore, on weeks where wear time was lower, phys-ical activity levels may be underestimated. IET soldiers averaged 13,569 ± 5197 steps per day during IET.
Dietary intake
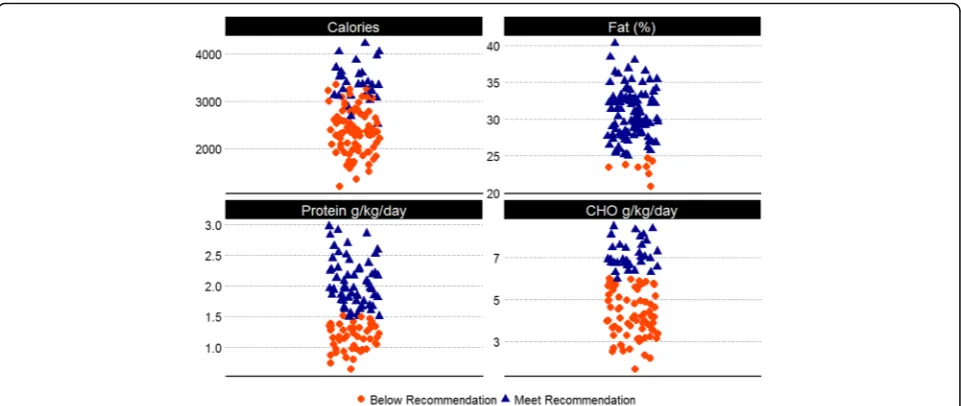
Average macronutrient intake is presented in Fig. 2. IET soldiers consumed on average 2644 ± 639 cal per day during week one. Intake ranged from 1211 to 4228 cal per day. When comparing energy intake across meals, statistical comparison using repeated measures ANOVA revealed a significant main effect of meal with caloric intake highest at breakfast with an average intake of 1013 ± 273 cal, followed by dinner
813 ± 225 cal, and lunch 769 ± 201 cal (F = 69.1, p< 0.001). There was a significant difference between all meals for calorie intake, breakfast and dinner (t= 8.29, p< 0.001), breakfast and lunch (t= 10.72, p < 0.001), dinner and lunch (t= 2.31,p= 0.02). Protein intake av-eraged 38.1 ± 11.2 g for breakfast, 33.7 ± 9.9 g for lunch, and 41.1 ± 11.0 g for dinner. There was a sig-nificant effect of meal on dietary protein intake (F = 24.18,p< 0.001). Post-hoc paired t-tests revealed a sig-nificant difference between breakfast and dinner (t= 2.84, p= 0.005), breakfast and lunch (t= 3.95, p< 0.001), dinner and lunch (t= 7.14, p < 0.001). Carbohy-drate intake averaged 137.3 ± 39.7 g for breakfast, 104.5 ± 28.2 g for lunch, and 101.8 ± 30.3 g for dinner. For carbohydrate intake, Greenhouse-Geisser correc-tions were used because sphericity was violated. Statis-tical analysis revealed a significant effect of meal. Post-hoc paired t-tests revealed a significant difference between breakfast and dinner (t= 9.03, p< 0.001), breakfast and lunch (t= 8.89, p < 0.001), but no signifi-cant difference between dinner and lunch (t= 0.95, p = 0.34). Fat intake averaged 34.6 ± 11.2 g for breakfast, 25.9 ± 9.2 for lunch, and 27.8 ± 11.2 g for dinner. Stat-istical analysis revealed a significant main effect of meal (F = 30.7, p< 0.001). Post-hoc paired t-tests re-vealed a significant difference between breakfast and dinner (t= 5.67, p< 0.001), breakfast and lunch (t= 7.67, p< 0.001), but no significant difference between dinner and lunch (t= 1.61, p= 0.11) for fat intake.
Approximately 49/111 participants consumed less than the recommended 1.5 g/kg of body weight per day of protein intake and 78/111 consumed less than the rec-ommended 6 g/kg of carbohydrate per day. Approxi-mately 103/111 met the lower limit of dietary fat intake (which is 25% of total calorie intake from fat).
Energy balance
Energy expenditure was estimated using the most conservative MET value associated with each classifi-cation of physical activity (Light = 2 METs, Moderate = 3 METs, Vigorous = 6 METs, Very Vigorous = 9 METs). Figure 3 summarizes energy balance during red phase of IET when the lowest MET values, aver-age METs (Light = 2.5 METs, Moderate = 4.5 METs, Vigorous = 7.5 METs, Very Vigorous = 9 METs) and high MET (Light: 2.99 METs, Moderate = 5.99, Vig-orous = 8.99, Very VigVig-orous = 9) values associated with each classification of physical activity. Average total energy expenditure was estimated to be 3238 ± 457 during red phase (week two: 3107 ± 415, week
three: 3371 ± 461). Resting energy expenditure was estimated to be 1777 ± 185 and active energy ex-penditure was 1461 ± 286 (week two: 1329 ± 231, week three: 1593 ± 276) kcal kcal/day on average during red phase of IET. On average 71% of IET (week two: 66%, week three: 77%), soldiers were classified as being in negative net energy balance during red phase. Average energy balance was −595 ± 896 kcal/day during red phase of IET based on week one dietary intake. Regression analysis revealed body weight was a significant predictor for negative energy balance (adj. R2= 0.54, p< 0.001). Specifically, for every 1-kg increase in body mass, energy balance became more negative by 53 cal.
Fig. 2Summary of dietary intake in IET soldiers. Caloric intake (Calories per day), individuals who did not meet the recommendation were those who were in a negative energy balance; Protein, recommendation≥1.5 g/kg body weight; Carbohydrate, recommendation≥6 g/kg of body weight; Fat≥25% total kcal intake, represent macronutrient intakes of IET soldiers in comparison to the recommended intake for active individuals [22]
Discussion
This study evaluated the dietary intake, training load, and balance between estimated energy expenditure and energy intake in U.S. Army IET soldiers. Our primary finding was that IET soldiers expended approximately 595 more calo-ries per day during red phase than they consumed based on our estimation of metabolic training load. It is likely that our estimation of energy expenditure is low based on three important considerations: 1) we applied conservative MET assignments to moderate, vigorous, and very vigor-ous intensity physical activity; 2) estimation of BMR using the Modified Harris-Benedict equation was also a conser-vative estimate of non-physically active energy expend-iture. It assumes the participant is immobile and in a supine position, whereas over half of sedentary time for IET soldiers is standing time which has been reported to increase energy expenditure by as much as 10% [41]; 3) IET soldiers frequently carry loads (10–80 pounds) which increases energy expenditure and was not considered in our calculations [13]. Therefore, the imbalance between energy expenditure and nutrition intake is likely higher than reported here. In addition to preventing optimal per-formance and recovery, inadequate energy intake can negatively affect bone turnover (formation and break-down), and may predispose active individuals to musculo-skeletal injury [14, 15, 42, 43] which is one of the most costly challenges facing the US armed forces today [2,7].
Quantification of training volume during IET revealed soldiers averaged approximately 3180 ± 320 min of phys-ical activity per week with 1202 ± 291 of those minutes being moderate to vigorous physical activity across 14 weeks of IET. For comparison, research indicates only 49–53% of civilian adults 18–34 reported at least 150 min of moderate or 75 min of vigorous and only 31% re-ported participating in 300 min of moderate or 150 min of vigorous physical activity per week [44]. Furthermore, only 27% of adolescents participate in more than 1 h per day of moderate or vigorous physical activity [9]. Thus, IET soldiers complete substantially more physical activity than the general civilian population of the same age range. Also noteworthy was our observation that phys-ical activity was higher during the first three weeks com-pared to the overall cycle average for IET training. Thus, IET soldiers may experience rapid increases in physical activity upon entry to IET compared to civilian life, which has been reported to increase the risk of MSI [11]. To combat this disparity, there are several volun-tary pre-conditioning programs provided to new U. S. Army recruits. Discussions with training and recruiting command Cadre suggest most recruits do not take ad-vantage of these programs or guidance provided on how to prepare for the rigors of military training. A different approach for pre-conditioning of recruits may be neces-sary to prepare them for the rigors of IET.
Previous research reported that IET soldiers spent on average 140 min per day in light, approximately 92 min in moderate, and 38 min per day in vigorous intensity exer-cise (averages calculated from cumulative results from Fort Sill and Fort Jackson) [13]. Differences found in the current study are likely due methodological differences in activity monitoring. The previous study distributed activity monitors at breakfast and collected them at dinner, miss-ing any evenmiss-ing physical activity [13]. Additionally, differ-ences in algorithms used to classify activity counts into physical activity may account for the differences. The prior study used Freedson cut points which are based on verti-cal axis counts [36, 45], whereas our study used Sasaki vector magnitude cut-points which are based on a vector magnitude estimate calculated from all three axes [35]. While vertical axis counts have been validated for record-ing ambulatory physical activity (walkrecord-ing and joggrecord-ing), they tend to underestimate activities that do not necessar-ily occur in the vertical axis (such as shoveling) [46, 47]. Comparison of models using vector magnitude (tri-axis) and vertical axis only have reported higher physical activ-ities when using vector magnitude whereas vertical axis tends to report larger amounts of time in sedentary activ-ity [46,48].
consuming energy dense food items. Soldiers were encour-aged to select foods lower in fat content and increase con-sumption of vegetables, fruits and complex carbohydrates [52,53]. While this nutritional education is important for development of long-term soldier health, care should be taken when explaining these strategies to IET soldiers who are exposed to very high training volumes and need energy dense food items to match caloric expenditure.
Protein intake is crucial for provision of amino acid pools to support cellular adaptations of skeletal muscle such as hypertrophy [54], mitochondrial protein turn-over [55, 56], repair of muscle damage caused by train-ing [57, 58], bone health [59–61] and improved performance [22]. On average IET soldiers consumed more than the lower limit of 1.2 g/kg for protein. How-ever, approximately 44% of IET soldiers consumed less than the recommended 1.5 g/kg of protein intake per day, which is thought to be a more accurate estimation of protein needs for strength and endurance training [22, 62, 63]. Additionally, protein needs for active indi-viduals may increase to 2–3 g/kg of body weight per day when training during energy restriction [64]. This sug-gests that even though IET soldiers consumed above the lower limit for daily protein intake, they are likely con-suming inadequate amounts of protein in due to the training demands and energy restriction soldiers face during IET.
Diets high in carbohydrate intake are associated with increased power output [65, 66], prolonged time to ex-haustion [67], and overall increases in exercise perform-ance [66]. We report that approximately 50% of IET soldiers did not consume more than 5 g/kg and 70% did not meet the lower limit (6 g/kg) of the recommenda-tions for carbohydrate for individuals participating in high levels of physical activity [22]. Conversely, 93% of IET soldiers met the lower recommendation of 25% of total calorie intake from fat. These findings suggest that carbohydrate intake may be inadequate to meet the de-mands of training and thus may limit performance in IET soldiers. This is important as we apply research find-ings clinically to develop fueling recommendations for the IET population. Currently all IET soldiers receive the same serving size and amount at the dining facility. Indi-vidual soldier body composition, fitness and activity level should be considered as we work towards optimization of health and performance.
This investigation is a first step at evaluating energy bal-ance in the IET environment and represents only one train-ing company at one location. One limitation to this study is our assumption that entry-level dietary intake values were reflective of eating habits throughout the 14-week duration. Additionally, we did not estimate energy expenditure dur-ing the same week in which dietary data was collected. However, training schedule and amount of time to eat are
similar within red phase (weeks 1–3) and therefore dietary intake was likely similar in weeks two and three compared to what was found in week one. Additionally, energy ex-penditure was estimated based on the average physical ac-tivity performed by the entire company of IET soldiers. While many of the activities performed at IET are in the group setting, ideally, investigations should assign each IET soldier a monitor to wear daily throughout training to track individual energy expenditure and training load. Finally, using serial and more precise methods to track dietary in-take would improve outcomes. There are known inherent errors when using food logs such as portion estimation error, therefore methodologies in which trained researchers evaluate dietary intake may improve accuracy [68].
Conclusion
Our results suggest that based on the week one diet as-sessment, the IET soldiers in this study did not consume adequate nutrition to meet the physiological demands of training. This may impair each soldiers training response and potentially increase injury rates associated with re-covery and fatigue. Additional research is needed to de-velop strategies to optimize soldier nutrition to improve performance and recovery.
Additional file
Additional file 1:Table S1.Example food log. (DOCX 20 kb)
Abbreviations
AEE:Active Energy Expenditure; IET: Initial Entry Training; JCOE: Army Joint Culinary Center of Excellence; MET: Metabolic Equivalent; MSI: Musculoskeletal Injury; REE: Resting Energy Expenditure; USDA: United States Department of Agriculture
Acknowledgements
The authors would like to thank all of the participants from Army IET training and their commanders for all of their help and support. We also would like to thank our undergraduate and graduate students who assisted in data collection Sarah Gordon, Alex Brown, Jordan Devine, Josh Ourada, Jessica Nendze, and Bryce Munz.
Ethics approval and consent to participate
Study design was approved by the Auburn University Institutional Review Board (Protocol #15–502 MR 1512) and Army Institutional Review Board. The Director, Research & Analysis Directorate Army Center approved the study procedures for Initial Military Training and that they conformed to the standards set by the latest revision of the Declaration of Helsinki. All subjects provided written and verbal consent prior to study participation.
Funding
Funding to support this study came from the Warrior Research Center, Auburn University Kinesiology.
Availability of data and materials
Availability of data is restricted by Army and Auburn Institutional Review Boards and therefore is not made readily available. Data are however available from the corresponding author upon reasonable request.
Authors’contributions
and interpretation. KDM, data collection, analysis, manuscript review. RLO, data collection, analysis, manuscript review. KCY, study design, data analysis, interpretation, manuscript review. ADF, dietician, data analysis, interpretation, manuscript review. MDR, study design, data collection, analysis, interpretation, manuscript review. JMS, corresponding author, funding, study design, oversight of project, data collection, analysis, interpretation, manuscript review.
Consent for publication Not applicable.
Competing interests
The authors declare that they have no competing interests.
Publisher’s Note
Springer Nature remains neutral with regard to jurisdictional claims in published maps and institutional affiliations.
Author details
1Warrior Research Center, School of Kinesiology, Auburn University, 301 Wire
Road, Auburn, AL 36849, USA.2Molecular and Applied Sciences Laboratory, School of Kinesiology, Auburn University, Auburn, AL 36849, USA.
3
Department of Cell Biology and Physiology, Edward Via College of Osteopathic Medicine (Auburn Campus), Auburn, AL 36849, USA.
4
Department of Nutrition, Dietetics, and Hospitality Management, College of Human Sciences, Auburn University, Auburn, AL 36849, USA.
Received: 18 January 2018 Accepted: 11 November 2018
References
1. Brownson R, Boehmer T, Luke D. Declining rates of physical activity in the United States: what are the contributors? Annu Rev Public Health. 2005;26:421–43.
2. Molloy J, Feltwell D, Scott S, Niebuhr D. Physical training injuries and interventions for military recruits. Mil Med. 2012;177(5):553–8.
3. Jones BH, Cowan DN, Tomlinson JP, Robinson JR, Polly DW, Frykman PN. Epidemiology of injuries associated with physical training among young men in the army. Med Sci Sports Exerc. 1993;25(2):197-203.
4. Jones B, Thacker S, Gilchrist J, Kimsey C Jr, Sosin D. Prevention of lower extremity stress fractures in athletes and soldiers: a systematic review. Epidemiol Rev. 2002;24(2):228–47.
5. Lisman P, O'Connor FG, Deuster PA, Knapik JJ. Functional movement screen and aerobic fitness predict injuries in military training. Med Sci Sports Exerc. 2013;45(4):636–43.
6. Shaffer R, Brodine S, Almeida S, Williams K, Ronaghy S. Use of simple measures of physical activity to predict stress fractures in young men undergoing a rigorous physical training program. Am J Epidemiol. 1999; 149(3):236–42.
7. Teyhen D: Professional soldier athlete: the cornerstone of strategic Landpower’s human dimension. United States Army War College; 2014. 8. Knapik J, Daniels W, Murphy M, Fitzgerald P, Drews F, Vogel J.
Physiological factors in infantry operations. Eur J Appl Physiol Occup Physiol. 1990;60(3):233–8.
9. Knapik J, Rieger W, Palkoska F, van Camp S, Darakjy S. United States Army physical readiness training: rationale and evaluation of the physical training doctrine. J Strength Cond Res. 2009;23(4):1353–62.
10. Sharp M, Patton J, Vogel J. A database of physically demanding tasks performed by US Army soldiers. Army Research Inst oF Environmental Medicine: Natick MA; 1998.
11. Garber C, Blissmer B, Deschenes M, Franklin B, Lamonte M, Lee I, Nieman D, Swain D. Quantity and quality of exercise for developing and maintaining cardiorespiratory, musculoskeletal, and neuromotor fitness in apparently healthy adults: guidance for prescribing exercise. Med Sci Sports Exerc. 2011;43(7):1334–59.
12. Knapik J, Hauret K, Canada S, Marin R, Jones B. Association between ambulatory physical activity and injuries during United States Army basic combat training. J Phys Act Health. 2011;8(4):496–502.
13. Simpson K, Redmond J, Cohen B, Hendrickson N, Spiering B, Steelman R, Knapik J, Sharp M. Quantification of physical activity performed during US Army basic combat training. US Army Med Dep J. 2013;4:55–65.
14. Ihle R, Loucks AB. Dose-response relationships between energy availability and bone turnover in young exercising women. J Bone Miner Res. 2004; 19(8):1231–40.
15. Zanker C, Swaine I. Responses of bone turnover markers to repeated endurance running in humans under conditions of energy balance or energy restriction. Eur J Appl Physiol. 2000;83(4–5):434–40.
16. Li P, Yin Y, Li D, Kim S, Wu G. Amino acids and immune function. Br J Nutr. 2007;98(02):237–52.
17. Kramer T, Moore R, Shippee R, Friedl K, Martinez-Lopez L, Chan M, Askew E. Effects of food restriction in military training on T-lymphocyte responses. Int J Sports Med. 1997;18(Suppl 1):S84–90.
18. Cherif A, Roelands B, Meeusen R, Chamari K. Effects of intermittent fasting, caloric restriction, and Ramadan intermittent fasting on cognitive performance at rest and during exercise in adults. Sports Med (Auckland, NZ). 2016;46(1):35–47.
19. Green M, Rogers P, Elliman N, Gatenby S. Impairment of cognitive performance associated with dieting and high levels of dietary restraint. Physiol Behav. 1994;55(3):447–52.
20. Oliver S, Laing S, Wilson S, Bilzon J, Walsh N. Endurance running performance after 48 h of restricted fluid and/or energy intake. Med Sci Sports Exerc. 2007;39(2):316–22.
21. Logue D, Madigan S, Delahunt E, Heinen M, Mc Donnell S, Corish C. Low energy availability in athletes: a review of prevalence, dietary patterns, physiological health, and sports performance. Sports Med. 2018;48(1):73–96. 22. Thomas D, Erdman K, Burke L. Position of the academy of nutrition and
dietetics, dietitians of Canada, and the American College of Sports Medicine: nutrition and athletic performance. J Acad Nutr Diet. 2016; 116(3):501–28.
23. Fukuda D, Stout J, Moon J, Smith-Ryan A, Kendall K, Hoffman J. Effects of resistance training on classic and specific bioelectrical impedance vector analysis in elderly women. Exp Gerontol. 2016;74:9–12.
24. Joint Cullinary Center of Excellence [http://www.quartermaster.army.mil/ jccoe/Operations_Directorate/QUAD/nutrition/G4G_Recipe_Nutrition_ Analysis_Red_Amber_Green_New.pdf].
25. What's In The Foods You Eat Search Tool [https://reedir.arsnet.usda.gov/ codesearchwebapp/(S(qyik1tmzmfjccldwhglgsntv))/CodeSearch.aspx]. 26. R Core Team. R: A language and environment for statistical computing. R
Foundation for Statistical Computing, Vienna, Austria. 2015. In., Vienna: ISBN 3-900051-07-0.
27. RStudio Team. Rstudio: integrated development environment for R 2014. In., Boston: RStudio, Inc.; 2014.
28. Wickham H, Francois R, Henry L, Müller K. dplyr: A Grammar of Data Manipulation. In., R package version 0.7.0 edn; 2017.
29. Wickham H, Henry L. tidyr: Easily Tidy Data with spread() and gather() Functions. In., R package version 0.7.0 edn; 2017.
30. Wickham H. Reshaping data with the reshape package. J Stat Softw. 2007; 21(12):1-20
31. Lawrence M. ez: Easy Analysis and Visualization of Factorial Experiments. In., R package version 4.4-0 edn; 2016.
32. Fox J, Weisberg S. An {R} Companion to Applied Regression. In., vol. 2nd. Thousand Oaks: Sage; 2011.
33. Bernhard P. VAR, SVAR and SVEC models: implementation within {R} package {vars}. J Stat Softw, J Stat Softw. 2008;(4).
34. Wickham H. ggplot2: elegant graphics for data analysis. New York: Springer--Verlag; 2009.
35. Sasaki J, John D, Freedson P. Validation and comparison of ActiGraph activity monitors. J Sci Med Sport. 2011;14(5):411–6.
36. Migueles J, Cadenas-Sanchez C, Ekelund U, Delisle Nystrom C, Mora-Gonzalez J, Lof M, Labayen I, Ruiz J, Ortega F. Accelerometer data collection and processing criteria to assess physical activity and other outcomes: a systematic review and practical considerations. Sports medicine (Auckland, NZ). 2017;47(9):1821–45.
37. Brond J, Arvidsson D. Sampling frequency affects the processing of Actigraph raw acceleration data to activity counts. J Appl Physiol. 2016; 120(3):362–9.
38. Chomistek A, Yuan C, Matthews C, Troiano R, Bowles H, Rood J, Barnett J, Willett W, Rimm E, Bassett D. Physical activity assessment with the ActiGraph GT3X and doubly labeled water. Med Sci Sports Exerc. 2017; 49(9):1935–44.
physical activities: a second update of codes and MET values. Med Sci Sports Exerc. 2011;43(8):1575–81.
40. Roza A, Shizgal H. The Harris Benedict equation reevaluated: resting energy requirements and the body cell mass. Am J Clin Nutr. 1984; 40(1):168–82.
41. Levine J, Schleusner S, Jensen M. Energy expenditure of nonexercise activity. Am J Clin Nutr. 2000;72(6):1451–4.
42. Loucks AB, Kiens B, Wright HH. Energy availability in athletes. J Sports Sci. 2011;29(Suppl 1):S7-15.
43. Barrack M, Van Loan M, Rauh M, Nichols J. Physiologic and behavioral indicators of energy deficiency in female adolescent runners with elevated bone turnover. Am J Clin Nutr. 2010;92(3):652–9. 44. Nutrition, Physical Activity, and Obesity: Data, Trends, and Maps [https://
www.cdc.gov/nccdphp/dnpao/data-trends-maps/index.html.]
45. Freedson P, Melanson E, Sirard J. Calibration of the computer science and applications, Inc. accelerometer. Med Sci Sports Exerc. 1998;30(5): 777–81.
46. Watson K, Carlson S, Carroll D, Fulton J. Comparison of accelerometer cut points to estimate physical activity in US adults. J Sports Sci. 2014; 32(7):660–9.
47. Matthew C. Calibration of accelerometer output for adults. Med Sci Sports Exerc. 2005;37(11 Suppl):S512–22.
48. Keadle S, Shiroma E, Freedson P, Lee I. Impact of accelerometer data processing decisions on the sample size, wear time and physical activity level of a large cohort study. BMC Public Health. 2014;14:1210. 49. Williamson D. Changes in food intake and body weight associated with
basic combat training. Mil Med. 2002;167(3):248.
50. Margolis L, Pasiakos S, Karl J, Rood J, Cable S, Williams K, Young A, McClung J. Differential effects of military training on fat-free mass and plasma amino acid adaptations in men and women. Nutrients. 2012; 4(12):2035–46.
51. Jackson T, Cable S, Jin W, Robinson A, Dennis S, Vo L, Prosser T, Rawlings J. The importance of leadership in Soldiers' nutritional behaviors: results from the soldier fueling initiative program evaluation. US Army Med Dep J. 2013:79–90.
52. TRADOC. United States Army training and doctrine command: regulation 350–6. Virginia: Fort Eustis; 2013.
53. United States Army Food Service: Impletementation Guide for Initial Military Training Soldier Fueling Initiative. In.; 2012.
54. Jager R, Kerksick C, Campbell B, Cribb P, Wells S, Skwiat T, Purpura M, Ziegenfuss T, Ferrando A, Arent S, et al. International Society of Sports Nutrition Position Stand: protein and exercise. J Int Soc Sports Nutr. 2017;14:20.
55. Hill K, Stathis C, Grinfeld E, Hayes A, McAinch A. Co-ingestion of carbohydrate and whey protein isolates enhance PGC-1alpha mRNA expression: a randomised, single blind, cross over study. J Int Soc Sports Nutr. 2013;10(1):8.
56. Rowlands D, Thomson J, Timmons B, Raymond F, Fuerholz A, Mansourian R, Zwahlen M, Metairon S, Glover E, Stellingwerff T, et al. Transcriptome and translational signaling following endurance exercise in trained skeletal muscle: impact of dietary protein. Physiol Genomics. 2011;43(17):1004–20.
57. Hansen M, Bangsbo J, Jensen J, Bibby B, Madsen K. Effect of whey protein hydrolysate on performance and recovery of top-class orienteering runners. Int J Sport Nutr Exerc Metab. 2015;25(2):97–109.
58. Saunders M, Kane M, Todd M. Effects of a carbohydrate-protein beverage on cycling endurance and muscle damage. Med Sci Sports Exerc. 2004;36(7):1233–8. 59. Heaney R, Layman D. Amount and type of protein influences bone health.
Am J Clin Nutr. 2008;87(5):1567S–70S.
60. Torricelli P, Fini M, Giavaresi G, Giardino R. Human osteopenic bone-derived osteoblasts: essential amino acids treatment effects. Artif Cells Blood Substit Immobil Biotechnol. 2003;31(1):35–46.
61. Bihuniak J, Insogna K. The effects of dietary protein and amino acids on skeletal metabolism. Mol Cell Endocrinol. 2015;410:78–86.
62. Kato H, Suzuki K, Bannai M, Moore D. Protein requirements are elevated in endurance athletes after exercise as determined by the Indicator amino acid oxidation method. PLoS One. 2016;11(6): e0157406.
63. Lemon P, Tarnopolsky M, MacDougall J, Atkinson S. Protein requirements and muscle mass/strength changes during intensive training in novice bodybuilders. J Appl Physiol. 1992;73(2):767–75.
64. Helms E, Zinn C, Rowlands D, Brown S. A systematic review of dietary protein during caloric restriction in resistance trained lean athletes: a case for higher intakes. Int J Sport Nutr Exerc Metab. 2014;24(2):127–38. 65. Rauch H, Gibson A, Lambert E, Noakes T. A signalling role for muscle
glycogen in the regulation of pace during prolonged exercise. Br J Sports Med. 2005;39(1):34–8.
66. Simonsen J, Sherman W, Lamb D, Dernbach A, Doyle J, Strauss R. Dietary carbohydrate, muscle glycogen, and power output during rowing training. J Appl Physiol. 1991;70(4):1500–5.
67. Bergström J, Hermansen L, Hultman E, Saltin B. Diet, muscle glycogen and physical performance. Acta Physiol Scand. 1967;71(2–3):140–50. 68. Hill R, Davies P. The validity of self-reported energy intake as determined