Feature Classification of EEG Signal Using Signal Energy
in Multi-Resolution Analysis (MRA) and Radial Basis
Function (RBF) for Detecting Seizure and Epilepsy
Fatemeh Shahlaei1,*, Sajad Banakar2, Hadi Salempoor1, Mahmood Aflaki3, Seyed Mohammad Sadegh Barghi Keyvan1
1Pune University, India
2Boshehr University, Iran
3Qaem Shahr University, Iran
Abstract
Background/Objectives: Automatic medical diagnostic system has become an important task due to the need of new technology. Methods/Statistical analysis: This paper presents a new methodology for detecting brain disorders by electroencephalogram (EEG) signal. The automatic diagnosis system consists of feature extraction and classification. For this purpose, wavelet transform is used to extract features of EEG signals. Findings: Then, an artificial neural network (ANN) as a powerful intelligent method is applied to the features to automatically classify the disturbances. For this aim, Radial basis function (RBF) is considered. The energies of the features based on Parseval's theorem are used for training the RBF system. Five types of EEG signals including healthy and unhealthy cases are used as input patterns. Application/Improvements: The simulation results show the suggested system has potential in classification of different disorders.Keywords
EEG signal, Wavelet transform, Feature classification, Artificial neural network1. Introduction
The electroencephalogram (EEG) signals shows brain activities. So that brain disorders can be detected by the study of EEG signals [1-3]. But Processing large amount of data is laborious and it increases error in the system. To improve it, automatic diagnosis methods have been noticed for EEG signals [4-7]. The demand for more accurate automatic mental detection increases the need for growing computational methods recently.
Automatic disorders detection in EEG signals consists mainly of two steps. The first step is feature extraction and the second step is classification. Fourier transform (FT), wavelet transform (WT) as two famous methods in signal processing which are usually used for feature extraction in EEG signals [8, 9].
FT is the most famous method in signal processing which is proper for analyzing stationary signals. However, non-stationary signals cannot be detected by FT. To cope with this issue, short time fourier transform (STFT) is used to non-stationary signals by assuming a fixed window to
* Corresponding author:
[email protected] (Fatemeh Shahlaei) Published online at http://journal.sapub.org/ijea
Copyright © 2017 Scientific & Academic Publishing. All Rights Reserved
concentrate on certain period of time [8]. Although it can be used for simple time varying signals but it has some difficulties in non-stationary signals with high degree of nonlinearity or uncertainty [10]. This is due to the limitation of the fixed window.
Wavelet transform (WT) is recently used in EEG for analyzing signals [9, 11]. It does not need to get a fixed window, it provides a short window for high frequency components and long window for low frequency components [12], so it can be used for time varying signals. WT is able to consider the time and the frequency information together; therefore, it can be known as a time-frequency representation of the signal [13].
After features of signals are extracted, different methods are used for classification and diagnosing the disorders. There are two main classification methods in the literature of EEG analysis, parametric and non-parametric methods. Parametric methods like mean, variance,… are used when statistical distributions of faults are accessible [14]. Unfortunately, they are not available in the most cases. On the other hand, non-parametric methods do not need statistical characteristic of the signal.
For example, they can be obtained by a description of the signals, like, fuzzy logic (FL) [8], or data driven methods, such as, artificial neural network (ANN) [9, 14-16].
applications in different fields like estimation [17, 18], classification [9, 14, 15]. ANN as a famous intelligent method can effectively capture characteristics of signals, learn from data, and give a proper response for new data input. These properties make ANN more suitable when a group of data is available for training the network.
This paper presents a new method for detecting seizure and epilepsy. For this propose, it is assumed that EEG signals of healthy people and seizure and epilepsy patients are available. First, wavelet transform (WT) is applied on EEG signals to decompose signals at different levels. Then, the energies of signals at different levels are calculated to build their feature vectors. Then, an ANN as a powerful intelligent tool is used to classify the EEG signals. Radial basis function (RBF) is considered. The novelty of the purposed method is in the way it is designed. For the first, the energies of different levels of signals are applied to obtain a unique feature vector. RBF as a famous network is shown to be a strong classifier in this field. The designed system can diagnose different diseases correctly. Finally, the proposed classifier method robust against noise. Through a simulation study, real data of EEG signals are used. Simulation results show the ability of the proposed method in diagnosing disorders.
The paper is organized as follows. Section 2 describes different types of EEG signals. Section 3 briefly demonstrates the basic theory of the methods used in this paper. Design methodology and simulation study are considered in Section 4. Simulation results are illustrated in Section 5. Finally, concluding remarks are given in Section 6.
2. Data Descriptions
Data described in [19] has been used which is publicly available. In this section, only a short description is given and it is referred to [19] for further details. The complete dataset consists of five sets (denoted A–E), each containing 100 single-channel EEG signals of 23.6 s. Each signal has been selected after visual inspection for artifacts and has passed a weak stationary criterion. Sets A and B have been taken from surface EEG recordings of five healthy volunteers with eyes open and closed, respectively. Signals
in two sets have been measured in seizure-free intervals from five patients in the epileptogenic zone (D) and from the hippocampal formation of the opposite hemisphere of the brain (C). Set E contains seizure activity, selected from all recording sites exhibiting ictal activity. Sets A and B have been recorded extracranially, whereas sets C, D, and E have been recorded intracranially.
3. The Basic Theory of the Suggested
Methods
In this section, first, the basic theory of discrete wavelet transform is illustrated. Then, some concepts on artificial neural network are considered.
3.1. Discrete Wavelet Transform (DWT)
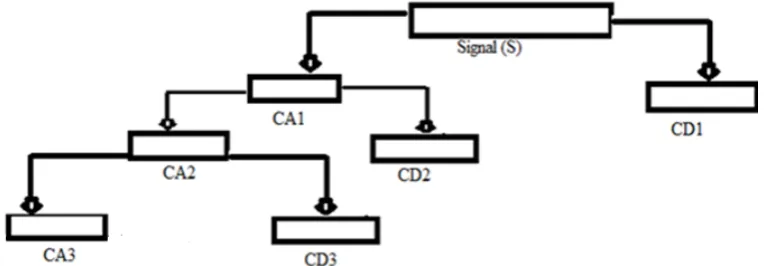
Discrete wavelet transform (DWT) presents a signal as a combination of scaling functions and their wavelets at different locations (positions) and scales (duration). DWT is introduced to map a discrete signal into different resolution levels [20].
In [21] introduces a unique framework for discrete wavelet, known as multi-resolution analysis (MRA). The aim is to decompose signal f(t) ∊ L2 (R). For this purpose,
consider f(t) as a linear combinations of scaling functions and its orthogonal wavelets as follows:
𝑓𝑓(𝑡𝑡) = ∑+∞𝑘𝑘=−∞𝑎𝑎0,𝑘𝑘𝛷𝛷0,𝑘𝑘(𝑡𝑡) + ∑0𝑚𝑚=−∞∑+∞𝑘𝑘=−∞𝑑𝑑𝑚𝑚,𝑘𝑘𝛹𝛹𝑚𝑚,𝑘𝑘 (1)
𝛷𝛷𝑚𝑚,𝑘𝑘(𝑡𝑡) = 2
−𝑚𝑚
2 𝛷𝛷(2−𝑚𝑚𝑡𝑡 − 𝑘𝑘), m, k ∊ Z (2)
𝛹𝛹𝑚𝑚,𝑘𝑘(𝑡𝑡) = 2
−𝑚𝑚
2 Ψ(2−𝑚𝑚𝑡𝑡 − 𝑘𝑘), m, k ∊ Z (3)
Where φ(t) and ψ(t) are scaling functions and their orthogonal wavelets, and m and, k are dilation and translation factors of the scaling functions and the wavelets, respectively. It has to be noticed that 2−𝑚𝑚2 is used as an energy normalization factor. 𝑎𝑎0,𝑘𝑘 and 𝑑𝑑𝑚𝑚,𝑘𝑘 can be
computed as the following:
𝑎𝑎0,𝑘𝑘=< 𝑓𝑓, 𝛷𝛷0,𝑘𝑘> (4)
𝑑𝑑𝑚𝑚,𝑘𝑘 =< 𝑓𝑓, 𝛹𝛹𝑚𝑚,𝑘𝑘> (5)
Figure 1 shows the decomposition of a signal based on MRA.
The energy of the signal 𝑓𝑓(𝑡𝑡) based on Parseval's theorem can be obtained as follows:
𝐸𝐸𝑠𝑠𝑠𝑠𝑠𝑠𝑠𝑠𝑎𝑎𝑠𝑠 = ∫ |𝑓𝑓(𝑡𝑡)|0𝑇𝑇 2𝑑𝑑𝑡𝑡 = ∑𝑁𝑁𝑠𝑠=0|𝐹𝐹[𝑠𝑠]|2 (6)
Where T and N are time period and length of the signal, respectively.
3.2. Artificial Neural Network (ANN)
Ability of artificial neural networks (ANNs) to learn complex nonlinear functions motivates their applications in different fields. They aim to mimic biological nervous systems using massive interconnection of individual processing elements called neurons in a multi-layered architecture. The layered topology of neurons provides great promise to compactly emulate a very general nonlinear function.
Therefore, multi layered perceptron (MLP) represents the most popular class of neural networks, consisting of multiple layers of artificial neurons in a feed forward. It potentially provides a generic model representation for nonlinear black box systems which can be adapted with experimental input output data [18, 22]. Although Feed forward neural networks, trained with the back propagation (BP) algorithm, have been widely used in different fields [18, 23, 24]. However, there are faced with several drawbacks such as potentially pre converging to a local minima, relatively slow convergence rate, and difficulties to determine an adequate architecture to obtain a minimum [18, 23, 24].
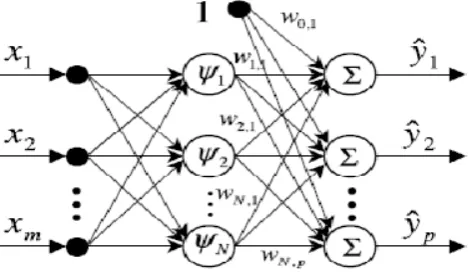
Radial basis function (RBF) neural networks has a universal approximation ability. The work reported in this paper uses RBF neural network due to its structural simplicity and general approximation capabilities. A RBF neural network has an input layer, a nonlinear hidden layer and a linear output layer. The nodes within each layer are fully connected to the previous layer nodes. The output layer nodes are weighted linear combinations of the RBF in hidden layer. The structure of a RBF neural networks with m inputs, p outputs and N hidden nodes is depicted in Figure 2.
Figure 2. RBF neural networks structure
Where 𝑋𝑋(𝑘𝑘) = (𝑥𝑥1(𝑘𝑘), … , 𝑥𝑥𝑚𝑚(𝑘𝑘))𝑇𝑇 and 𝑌𝑌�(𝑘𝑘) =
(𝑦𝑦�1(𝑘𝑘), … , 𝑦𝑦�𝑚𝑚(𝑘𝑘))𝑇𝑇 denote input and output vectors,
respectively. 𝜓𝜓𝑗𝑗(𝑋𝑋(𝑘𝑘)) is a nonlinear function which is
chosen as a Gaussian activation function:
. 𝜓𝜓𝑗𝑗�𝑋𝑋(𝑘𝑘)� = exp(�𝑋𝑋(𝑘𝑘) − 𝐶𝐶𝑗𝑗�2/𝜆𝜆𝑗𝑗2) (7)
Where 𝐶𝐶𝑗𝑗 ∊ 𝑅𝑅𝑁𝑁 indicates the center of the jth hidden
unit, 𝜆𝜆𝑗𝑗 is the width of the jth RBF hidden unit.
Then, the ith RBF network output can be represented as a linearly weighted sum of N basis functions as follows:
𝑦𝑦�𝑠𝑠(𝑘𝑘) = 𝑤𝑤0,𝑠𝑠+ ∑𝑁𝑁𝑗𝑗 =1𝑤𝑤𝑗𝑗 ,𝑠𝑠 𝜓𝜓𝑗𝑗�𝑋𝑋(𝑘𝑘)�, 𝑠𝑠 = 1,2, … , 𝑝𝑝 (8)
where 𝑤𝑤0,𝑠𝑠 𝑎𝑎𝑠𝑠𝑑𝑑 𝑤𝑤𝑗𝑗 ,𝑠𝑠 represent the weights [18 & 25-26].
4. Design Methodology and Simulation
Study for the Purposed System
In this section, first, wavelet transforms of EEG signals introduced in Section 2 are analyzed and proper features are selected. Then, a RBF network is tuned to classify the purposed faults.
4.1. Feature Extraction with Wavelet Transform
Feature extraction is an important task in pattern reorganization, classification, machine learning and data mining. Feature extraction is used to find the common properties among a group of signals. This has a high effect on the accuracy of classifiers. On the other hand, wavelet transform is a powerful method for analyzing non-stationary signals, because of this; it is used in EEG signals [9, 11].
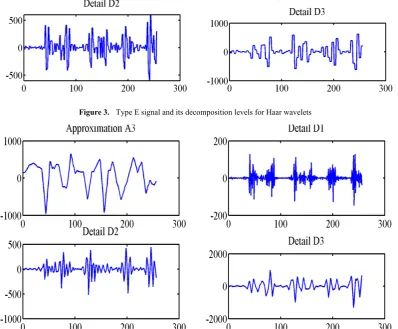
This section presents the suggested feature extraction method based on wavelet transform. For this purpose, the patient signals are decomposed by MRA method to obtain decomposition levels known as details. To have a successful feature extraction and consequently classify different types of signals, it is important to choose level of decomposition and type of wavelet properly. For this reason, decomposition of EEG signal type E is made by different types of wavelet to evaluate which wavelet is more efficient for the suggested design methodology. The level of decomposition is chosen to be 3. Figure 3 and 4 show the type E signal and its decomposition levels for Haar and Daubechies 3 (db3) mother wavelets.
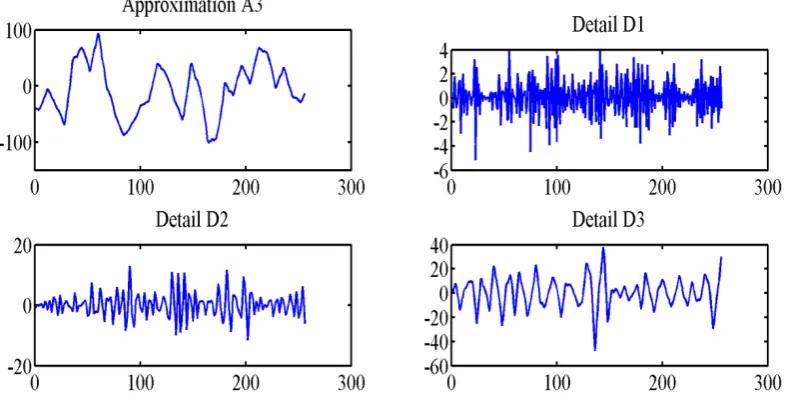
The vertical axis is magnitude of the signal and the horizontal axis is the sampling time. To have a proper feature extraction, db3 is chosen to be the mother wavelet. Figure 5 and 6 show type D and C signals and their decomposition levels with db3 wavelets.
In this paper, the energies of decomposition levels D1, D2, D3 and A3 are computed by Eq. (6) and they are used for feature extraction.
Now a new vector is taken as feature in the following:
Figure 3. Type E signal and its decomposition levels for Haar wavelets
Figure 4. Type E signal and its decomposition levels for db3 wavelets
Figure 6. Type C signal and its decomposition levels for db3 wavelets
4.2. Classification with RBF Network
This subsection presents the structure of the suggested RBF network for classification of EEG signals.
The aim is to design a RBF network to receive the feature vector in Eq. (9) and classify the unhealthy signals correctly. For this purpose, a three layered RBF network with four inputs, fifty five neurons in the hidden layer and one output is design. The neural network is trained with the feature data as input and decision vector as output using back-propagation (BP) algorithm. Gaussian and linear functions are used in the hidden and output layers, respectively.
5 different data sets are used for training the suggested RBF network. Different output level ranges are considered in the RBF to indicate different healthy and unhealthy cases. For this purpose, output levels in the ranges of 0.5 to 1.5, 1.5 to 2.5, 2.5 to 3.5, 3.5 to 4.5 and 4.5 to 5.5, are allocated to the types 1, 2, 3, 4 and 5, respectively.
5. Simulation Tests and Results
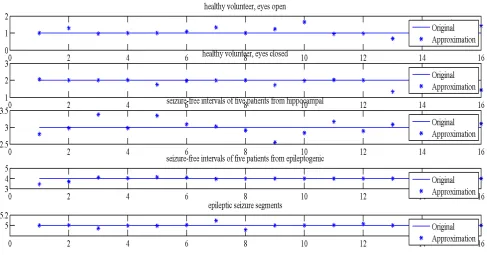
In this section, different data of EEG signals are considered to evaluate the designed system. For this purpose, after features are extracted from different types of signals, they are applied to the RBF network to classify the data. Figure 7 show the performance of the RBF network.
Figure 8 shows the output of the classifier. It can be seen from Figure 8 that the designed system can classify different types of the EEG signals correctly. The mean squared error (MSE)
The mean squared error (MSE) of EEG signals is illustrated in Table 1.
Table 1. The MSE error of the EEG signals
EEG
signal Type A Type B Type C Type D Type E
MSE 0.0885 0.0592 0.0380 0.0282 0.0013
The best performance is belonged to EEG signal type E which stands at 0.0013. Regarding EEG signals type C and D, the MSE are 0.0380 and 0.0282, respectively, which is acceptable.
6. Conclusions
Figure 7. The performance of the RBF system
ACKNOWLEDGMENTS
The authors would like to thank Professor Andrzejak for using his EEG data.
Nomenclature
𝛷𝛷𝑚𝑚,𝑘𝑘(𝑡𝑡) 𝛹𝛹𝑚𝑚,𝑘𝑘(𝑡𝑡) scaling functions wavelets m k 𝐸𝐸𝑠𝑠𝑠𝑠𝑠𝑠𝑠𝑠𝑎𝑎𝑠𝑠 𝑋𝑋(𝑘𝑘) 𝑌𝑌(𝑘𝑘) 𝜓𝜓𝑗𝑗(𝑋𝑋(𝑘𝑘)) dilation translation energy of signal input vector of RBF output vector of RBF RBF nonlinear functionSubscripts
EEG Electroencephalogram
ANN RBF
Artificial neural network Radial basis function FT
WT STFT
Fourier transform Wavelet transform Short time Fourier transform
FL BP Fuzzy logic Back propagation DWT MRA
Discrete wavelet transform Multi resolution analysis
MLP multi-layered perceptron
REFERENCES
[1] Adeli H, Zhou Z, Dadmehr N. Analysis of EEG records in an epileptic patient using wavelet transform. Journal of neuroscience methods. 2003 Feb 15; 123(1):69-87.
[2] Hazarika N, Chen JZ, Tsoi AC, Sergejew A. Classification of EEG signals using the wavelet transform. InDigital Signal Processing Proceedings, 1997. DSP 97., 1997 13th International Conference on 1997 Jul 2 (Vol. 1, pp. 89-92). IEEE.
[3] Rosso OA, Figliola A, Creso J, Serrano E. Analysis of wavelet-filtered tonic-clonic electroencephalogram recordings. Medical and Biological Engineering and Computing. 2004 Jul 1; 42(4): 516-23.
[4] Glover Jr JR, Raghaven N, Ktonas PY, Frost Jr JD. Context-based automated detection of epileptogenic sharp transients in the EEG: elimination of false positives. Biomedical Engineering, IEEE Transactions on. 1989 May; 36(5): 519-27.
[5] Gabor AJ, Seyal M. Automated interictal EEG spike detection using artificial neural networks.
Electroencephalography and Clinical neurophysiology. 1992 Nov 1; 83(5): 271-80.
[6] Webber WR, Litt B, Lesser RP, Fisher RS, Bankman I. Automatic EEG spike detection: what should the computer imitate?. Electroencephalography and clinical
neurophysiology. 1993 Dec 31; 87(6): 364-73.
[7] Nigam VP, Graupe D. A neural-network-based detection of epilepsy. Neurological Research. 2004 Jan 1; 26(1):55-60. [8] Polat K, Güneş S. Artificial immune recognition system with
fuzzy resource allocation mechanism classifier, principal component analysis and FFT method based new hybrid automated identification system for classification of EEG signals. Expert Systems with Applications. 2008 Apr 30; 34(3): 2039-48.
[9] Güler I, Übeyli ED. Adaptive neuro-fuzzy inference system for classification of EEG signals using wavelet coefficients. Journal of neuroscience methods. 2005 Oct 30; 148(2): 113-21.
[10] Zolfaghari R, Shrivastava Y, Agelidis VG. Evaluation of windowed ESPRIT virtual instrument for estimating Power Quality Indices. Electric Power Systems Research. 2012 Feb 29; 83(1):58-65.
[11] Adeli H, Ghosh-Dastidar S, Dadmehr N. A wavelet-chaos methodology for analysis of EEGs and EEG subbands to detect seizure and epilepsy. Biomedical Engineering, IEEE Transactions on. 2007 Feb; 54(2): 205-11.
[12] Kaewarsa S, Attakitmongcol K, Kulworawanichpong T. Recognition of power quality events by using multiwavelet-based neural networks. International Journal of Electrical Power & Energy Systems. 2008 May 31; 30(4): 254-60.
[13] Nguyen T, Liao Y. Power quality disturbance classification utilizing S-transform and binary feature matrix method. Electric Power Systems Research. 2009 Apr 30; 79(4): 569-75.
[14] Srinivasan V, Eswaran C, Sriraam N. Approximate entropy-based epileptic EEG detection using artificial neural networks. Information Technology in Biomedicine, IEEE Transactions on. 2007 May; 11(3): 288-95.
[15] Srinivasan V, Eswaran C, Sriraam AN. Artificial neural network based epileptic detection using time-domain and frequency-domain features. Journal of Medical Systems. 2005 Dec 1; 29(6):647-60.
[16] Memon AP, Uqaili MA, Memon ZA, Ali AA, Zafar A. Combined Novel Approach of DWT and Feedforward MLP-RBF Network for the Classification of Power Signal Waveform Distortion. Indian Journal of Science and Technology. 2014 May 1; 7(5): 710.
[17] Salahshoor K, Kordestani M, Khoshro MS. Design of online soft sensors based on combined adaptive PCA and DMLP neural networks. InControl and Decision Conference, 2009. CCDC'09. Chinese 2009 Jun 17 (pp. 3481-3486). IEEE. [18] Salahshoor K, Kordestani M, Khoshro MS. Design of online
[19] Andrzejak RG, Lehnertz K, Mormann F, Rieke C, David P, Elger CE. Indications of nonlinear deterministic and finite-dimensional structures in time series of brain electrical activity: Dependence on recording region and brain state. Physical Review E. 2001 Nov 20; 64(6):061907.
[20] Gaouda AM, Salama MM, Sultan MR, Chikhani AY. Power quality detection and classification using wavelet-multiresolution signal decomposition. IEEE Transactions on Power Delivery. 1999 Oct 1; 14(4):1469-76. [21] Mallat SG. A theory for multiresolution signal decomposition:
the wavelet representation. Pattern Analysis and Machine Intelligence, IEEE Transactions on. 1989 Jul; 11(7):674-93. [22] Valarmathi R, Nawaz GK. Secure data transfer through audio
signal with LSA. Indian Journal of Science and Technology. 2015 Jan 1; 8(1):17.
[23] Guo Q, Tang Q. Data mining based on improved neural network and its application in fault diagnosis of steam turbine. InIntelligent Control and Automation, 2008. WCICA 2008. 7th World Congress on 2008 Jun 25 (pp. 4051-4056). IEEE.
[24] Tian Z, Zhang H, Wang Y. Failure diagnosis of steam turbine-generator set based on genetic algorithm and BP network. Innull 2006 Oct 16 (pp. 930-935). IEEE.
[25] Li W, Yue HH, Valle-Cervantes S, Qin SJ. Recursive PCA for adaptive process monitoring. Journal of process control. 2000 Oct 31; 10(5): 471-86.