www.zumj.journals.ekb.eg
January 2019 Volume 25 Issue 1 www.zumj.journals.ekb.eg 9
LEFT VENTRICULAR DYSFUNCTION IN END STAGE RENAL DISEASE
PATIENTS ON REGULAR HAEMODIALYSIS CORRELATED TO
DIFFERENT VARIABLES
Mohamed Kewan1, Tamer Goda1,Yasser El Hindy1 , Ahmed Hussin2 ,
Internal medicine1 Department , faculty of medicine, Zagazig university , Egypt. cardiovascular 2 Department, faculty of medicine, Zagazig university , Egypt
Received: 3 October 2018 Accepted: 22December 2018
Corresponding author
Mohamed Kewan
ABSTRACT
Background: Patients with chronic kidney disease (CKD) manifest an increased prevalence of cardiovascular morbidity and mortality compared with age-matched persons, and this relationship is directly proportional to the severity of CKD. After age, left ventricular hypertrophy (LVH) is considered to be the strongest independent predictor of cardiovascular disease and events, cardiovascular death and total mortality. In CKD patients, LVH contributes to diastolic dysfunction, congestive heart failure, arrhythmia and sudden death.
Aim of the Work: The aim of this study is to clarify the relationship between ESRD and left ventricular dysfunction
Methods: All patients were subjected to the following :: Complete history and physical examination, Routine laboratory investigations including: Complete blood picture,Blood urea and serum creatinine, Random blood suger, calcium, phosphors,, uric acid urine analysis, PTH Special investigations in the form of 2D echocardiography.
Results: The collected data were computerized and statistically analyzed using SPSS program (Statistical Package for Social Science) version 24.
INTRODUCTION
n the haemodialysis (HD) population left
ventricular dysfunction (LVDys) is
common with a rate 10–30 times greater than that in the general population. The clinical diagnosis of congestive heart failure (CHF) in the HD population, which may be due to decreased left ventricular function, correlates strongly with mortality, having a reported 3-year survival of only 17%(1)
The traditional risk factors for cardiovascular disease do not completely explain this high risk, which seems to be influenced by the so-called nontraditional risk factors associated with CKD. This set of factors accelerates the course of coronary artery disease and is associated with a higher
prevalence of ventricular hypertrophy,
myocardial fibrosis, valvulopathies,
arrhythmias, and sudden death (2)
PATIENTS AND METHODS
This is a cross sectional study that included 90 patients who diagnosed as end-stage renal failure on regular HD. They were recruited from the nephrology and dialysis
unit of internal medicine Department and Cardiology Department, Zagazig University hospitals, from September 2017 to March 2018. Patients included in this study were on HD had been on regular 4 h HD sessions three times per week for at least 6 months. Patients were divided according to the history taking:
Group (1): ESRD patients with comorbidites either hypertension, diabetes and anemia N(76)
Group (2): ESRD patients without comorbidities hypertension, diabetes and anemia (14)
Inclusion criteria
Adult patients of both sex.
End stage renal disease patients that
diagnosed according to National Institute for Health and Care Excellence (NICE) clinical guidelines 2017 (GFR ˂ 15 ml/min/1.73 m2, ACR ˃ 30 mg/mmol, end stage renal biopsy and on hemodialysis for last 6 months)
Exclusion criteria
Patients with known Rheumatic heart
Disease.
January 2019 Volume 25 Issue 1 www.zumj.journals.ekb.eg 10 patients who refuse to be admitted in the
study
Ethical consideration
Written Informed consent was taken from the
patient to participate in the study. Approval for performing the study was obtained from internal medicine and cardiology departments, Zagazig University Hospitals after taking Institutional Review Board (IRB) approval.
All subjects of this study were subjected to the following
:
Thorough clinical examination Full general examination including: Vital
o Pulse examination
o Blood pressure measurement; It was
measured by a mercury sphygmomanometer with the subject recumbent in bed.
o Body mass index (BMI) “kg/m2”
Haemodialysis
Patients were dialyzed on Fresenius 4008B dialysis machine (Bad Homburg, Germany) at blood flow rate = 2.5 × weight (kg) + 100 ml/min, using polysulfone hollow fiber dialyzers suitable for the surface area of the patients (Fresenius FX8 = 1.4 m2, FX10= 1.8 m2 and F6 = 1.2 m2). Bicarbonate dialysis solutions were used. Patients dialyzed three sessions per week 4 hours for each session.
I. Laboratory investigations
a) Routine investigations Including
The routine laboratory investigations were done according to Clinical Pathology department and laboratories of Zagazig University Hospitals’ protocol and include:
1. Complete blood picture (CBC): measured by automated blood counter.
2. Kidney function tests: serum creatinine,
serum urea by colorimetric assay.
3. Calcium and Phosphors measured by
photometric test.
4. Parathyroid hormone (PTH) measured by
Quantitative, electrochemiluminescence
(ECLIA) assay.
5. Lipid profile (LDL, HDL, serum total
cholesterol, serum Triglyceride) by enzymatic colorimetric test for serum TC & serum TG and homogeneous enzymatic colorimetric test for LDL & HDL.
6. Iron, TIBC using Cobas 2000/ ROCHE®
diagnostic Germany.
7. urine analysis
8. Pelvi-abdominal U/S.
b) Special investigation included:
2D echocardiography:The entire study population underwent
echocardiography, including both
conventional and tissue Doppler imaging of the LV and the. Echocardiography was performed within 1 h after the completion of HD while the patients were at optimal dry weight to avoid any overestimation of pulmonary pressure because of volume overload. Images were obtained using a
Philips iE33 (Philips Healthcare,
Massachusetts, USA) with 2 and 2.5MHz. The study was carried out according to the criteria of the American Society of Echocardiography, 2017. LV volumes were estimated using the z-derived method. Ejection fraction (EF) of the LV was calculated using the Teicholz formula and further confirmed using Simpson’s technique in the four-chamber view. The maximal tricuspid regurgitation velocity was measured
by continuous wave Doppler
echocardiography from the apical four-chamber view. The highest peak velocity was recorded and the average peak velocities from three beats were calculated.
STATISTICAL ANALYSIS
The collected data were computerized and statistically analyzed using SPSS program (Statistical Package for Social Science) version 24.
Data were tested for normal distribution using the Shapiro Walk test. Qualitative data were represented as frequencies and relative percentages. Chi square test (χ2) and Fisher exact was used to calculate difference between qualitative variables as indicated. Quantitative data were expressed as mean ± SD (Standard deviation) for parametric and median and range for non-parametric data. Independent T test and Mann Whitney test were used to calculate difference between quantitative variables in two groups for parametric and non-parametric variables respectively. Pearson’s and Spearman’s correlation tests were used for correlating
normal and non-parametric variables
January 2019 Volume 25 Issue 1 www.zumj.journals.ekb.eg 11
The (+) sign was considered as indication for direct correlation i.e. increase frequency of independent lead to increase frequency of dependent & (-) sign as indication for inverse
correlation i.e. increase frequency of
independent lead to decrease frequency of dependent, also we consider values near to 1 as strong correlation & values near 0 as weak correlation.
Backward multivariate logistic regression analysis model was done using any predictor with p<0.05 in univariate analysis.
All statistical comparisons were two tailed with significance Level of P-value ≤ 0.05 indicates significant, p <0.001 indicates highly significant difference while, P> 0.05
indicates Non-significant difference
RESULTS
Table 1 Prevelence ECHO changes in the Study Population
N %
ECHO changes Grade 1 59 65.60%
Grade 2 21 23.30%
Grade 3 2 2.20%
Normal 8 8.90%
Table 2 Comparison of clinico-demographic data between both groups
Comorbidities X2/t p
No=14 Yes=76
N % N %
Sex F 12 85.7% 38 50.0% 6.1 0.013
M 2 14.3% 38 50.0%
Ageyears Mean ±SD Median (Range)
42.7 ± 11.6 45 (20-59)
50.1 ± 14.6 52 (18-85)
1.7 0.077
BMI(Kg/m2) Mean ±SD Median (Range)
25.4 ± 4.8 23.2 (21.2-35)
24.6 ± 4.1 23.3 (12.2-37.6)
-0.6 0.531
HD duration(months) Mean ±SD
Median (Range)
25.6 ± 15.4 24 (3-60)
68.5 ± 48.5 60 (2-300)
3.2* 0.002
All variables were compared using Independent T test except (*) Mann Whitney test
The table shows
- There is a significant difference between the two groups regarding sex and HD duration.
- No significant difference between the two groups regarding age and body mass index.
Table 3 Comparison of DM, HTN and ANEMIA prevelence in both groups
Comorbidities X2 p
No=14 Yes=76
N % N %
DM No 14 100% 55 72.40% 5 0.025
Yes 0 0% 21 27.60%
HTN No 14 100% 26 34.20% 20.7 <0.001
Yes 0 0% 50 65.80%
Anemia No 14 100% 1 1.30% 82.8 <0.001
Yes 0 0% 75 98.70%
The table shows
January 2019 Volume 25 Issue 1 www.zumj.journals.ekb.eg 12 Fig: Prevelence ECHO changes in the Study Population
Table 4 Comparison of ECHO data between both groups
Comorbidities X2/t p
No=14 Yes=76
N % N %
Echo Changes
Grade 1 7 50% 52 68.4% 24.5 <0.001
Grade 2 1 7.1% 20 26.3%
Grade 3 0 0% 2 2.6%
Normal 6 42.9% 2 2.6%
EF % Mean ±SD Median (Range)
58.1 ± 5.2 58 (47-64)
59.9 ± 9.5 60.5 (35-78)
0.5 0.307
The table shows
- There is a significant difference between the two groups regarding Echo changes.
- No significant difference between the two groups regarding EF.
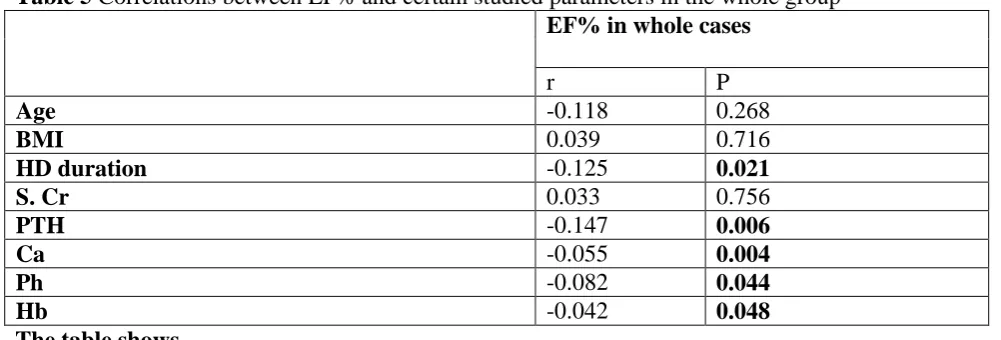
Table 5 Correlations between EF% and certain studied parameters in the whole group
EF% in whole cases
r P
Age -0.118 0.268
BMI 0.039 0.716
HD duration -0.125 0.021
S. Cr 0.033 0.756
PTH -0.147 0.006
Ca -0.055 0.004
Ph -0.082 0.044
Hb -0.042 0.048
The table shows
- There is a negative significant correlation between EF with HD duration, PTH, calcium, phosphorus and hemoglobin in the whole studied patients.
Grade1 66%
Grade2 23%
Grade3 2%
Normal 9%
ECHO changes
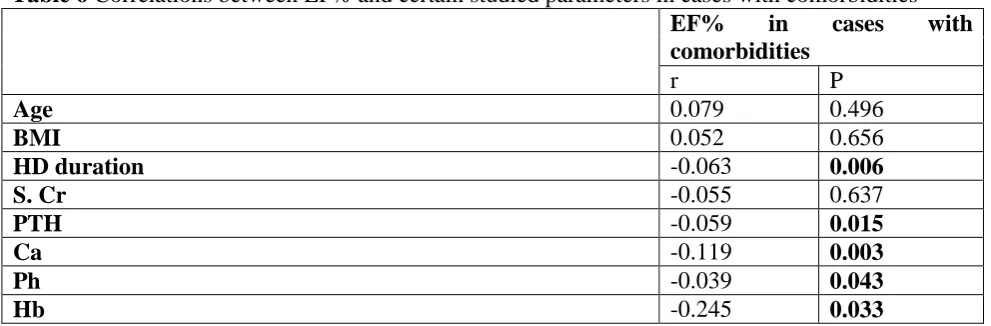
January 2019 Volume 25 Issue 1 www.zumj.journals.ekb.eg 13 Table 6 Correlations between EF% and certain studied parameters in cases with comorbidities
EF% in cases with comorbidities
r P
Age 0.079 0.496
BMI 0.052 0.656
HD duration -0.063 0.006
S. Cr -0.055 0.637
PTH -0.059 0.015
Ca -0.119 0.003
Ph -0.039 0.043
Hb -0.245 0.033
The table shows
- There is a negative significant correlation between EF with HD duration, PTH, calcium, phosphorus and hemoglobin in cases with comorbidities.
Table 7 Correlations between EF% and certain studied parameters in cases without comorbidities
EF% in cases with comorbidities
r P
Age -0.307 0.286
BMI -0.695 0.006
HD duration -0.09 0.017
S. Cr 0.18 0.537
PTH -0.095 0.031
Ca -0.613 0.022
Ph -0.483 0.041
Hb -0.769 0.001
The table shows
- There is a negative significant correlation between EF with BMI, HD duration, PTH,
calcium, phosphorus and hemoglobin in cases without comorbidities
Table 8 Multivariate logistic regression of potential predictors of LVDD in CKD on HD
B SE Sig. OR 95% CI for OR
Lower Upper
BMI 0.577 0.213 0.007 1.7 1.3 2.7
Serum Ca 2.511 1.036 0.015 12.4 1.7 93.8
HTN -6.268 2.616 0.017 1.2 0.11 0.12
Constant -38.1
β: regression coefficient; SE: standard error; OR: odds ratio; 95%CI: 95% confidence interval, p< 0.05 is significant.
The table shows
- That BMI, Serum Ca and HTN were
found to be independent risk factor for LVDD in CKD on HD.
DISCUSSION
There was a significant difference between the group regarding sex and HD duration.
January 2019 Volume 25 Issue 1 www.zumj.journals.ekb.eg 14
We found that there was a significant difference between the two groups regarding echo changes and no significant regarding EF. Similarly to [6] and [5] who found that the EF was significantly lower in HDpatients.
However,[7] found no difference in theleft ventricle ejection fraction (LVEF) between the HDgroup and the control group.
The difference may be attributed to a relativelyshorter duration of dialysis in our study patients than thatin the study of [6]
The prevalenceof LVH in the general population is 15–21%, but itaffects 50–70% of patients during intermediate stages of CKDand up to 90% of patients with end-stage kidney disease[8]
In a cross-sectional study of 3487 participants of the ChronicRenal Insufficiency Cohort Study, the prevalence of LVH assessedby echocardiography was 32, 48, 57 and 75% for estimatedglomerular filtration rate (eGFR) categories ≥60, 45–59,30–44 and <30 mL/min per 1.73 m2, respectively. In fullyadjusted multivariable analyses, subjects with eGFR levels of <30mL/min per 1.73 m2 had 2-fold higher odds of LVH(OR=2.20,95% CI = 1.40–3.40; P < 0.001) relative to subjects with eGFRlevels of ≥60 mL/min per 1.73 m2([9]. In a Spanish generalpractice multicentre study
of 13,687 hypertensive patients, the
relationshipbetween electrocardiographic
(EKG)-LVH and CKDstage was present in women but absent in men[10].
In our study we found that there a statistically significant decrease in hemoglobin in the patients with comorbidities compared to patients without comorbidities
In agree with our results [5] found that in the HD group compared with the control group and astatistically significant decrease in blood hemoglobin. But they disagree with us that they found a significant increase inblood urea, serum creatinine, potassium, and phosphorsin the HD group compared with the control group and astatistically significant decrease in calcium.
In our study, regarding the echo changes the most significant finding was grade 1 among the HD patients either in patients with comorbidities or without. However, there was a significant difference between the two
studied group. We also found no significant difference between the two group.
[11]
documented the same finding regarding Echo changes. Also others authors reported the same results
We found a negative significant correlation between EF with HD duration, PTH, calcium,
phosphorus and hemoglobin in the
hemodialysis patients.
We also documented the same relation in both group, this suggesting the prolonged HD duration is the main risk for comorbidities.
Our finding agreed with finding of Ahmed et
al. 2016 who reported a negative significant correlation between EF with calcium and HD duration, but they disagreed with us that they found a positive significant correlation between EF with hemoglobin, creatinine, uric acid and phosphorus.
In our study we found that BMI, Serum Ca and HTN were found to be independent risk factor for LVDD in CKD patients on HD. suggest thateven with levels of eGFR above 60, there is a relationshipbetween kidney function and cardiac function.
Diastolic dysfunction is closely associated withleft ventricular hypertrophy (LVH). LVH is knownto occur in > 70% of incident ESRD
patients and increasesthe risk for
cardiovascular event. LVH hasbeen shown to be an important independent predictorof cardiovascular outcome in ESRD patients diastolic dysfunction is a powerful predictor of all-causemortality in advanced CKD patient
In conclusion, LVDys is highly prevalent in HD patients and confers a worse prognosis in this already highly comorbid population. The most commonly used
measurement technique, 2D
echocardiography, can lead to
underestimation of LV function rendering interpretation of the literature problematic. The routine use of modern measurement techniques will hopefully allow for more accurate estimates of prevalence
.
REFERENCES
1. Sood MM, Pauly RP, Rigatto C and Komenda P(2008). Left ventricular dysfunction in the haemodialysis population. NDT Plus 4: 199–205. 2. Sarnak MJ, Levey AS, Schoolwerth AC, Coresh J,
January 2019 Volume 25 Issue 1 www.zumj.journals.ekb.eg 15
disease as a risk factor for development of cardiovascular disease: a statement from the American Heart Association councils on kidney in cardiovascular disease, high blood pressure research, clinical cardiology and epidemiology and prevention. Circulation; 108: 2154–2169.. 3. Besarab A, Levin A. (2010) Defining a renal
anemia management period. Am.J.Kidney Dis.;36:S13–S23.
4. Momtaza M, Al Fishawya H, Aljarhi UM, et al. (2013) Right ventricular dysfunction in patients with end-stage renal disease on regular hemodialysis. The Egyptian Society of Internal Medicine, , 25:127–132.
5. Said K, Hassan M, Baligh E, Zayed B, Sorour K(2012). Ventricular function in patients with end-stage renal disease starting dialysis therapy: a tissue Doppler imaging study. Echocardiography; 29:1054–1059.
6. Paoletti E, Cassottana P, Cannella G (2005): Prevalence of left ventricular hypertrophy: some
alternate thoughts. In reply.Am J Kidney Dis.; 46:1148-1149.
7. Park M, Hsu CY, Li Y et al. (2012) Associations between kidney function and subclinical cardiac abnormalities in CKD. J Am Soc Nephrol; 23: 1725–1734. Epub 30 August 2012
8. Redon J, Cea-Calvo L, Lozano JV et al. (2006) Kidney function and cardiovascular disease in the hypertensive population: the ERIC-HTA study. J Hypertens; 24: 663–669.
9. Lee M, Saver JL, Chang KH, et al. (2010): Low glomerular filtration rate and risk of stroke: meta-analysis. BMJ; 341: c4249
10. Campese V.M. (2014) Left ventricular function and chronic kidney disease: how soon does it start? Nephrol Dial Transplant 29: 1989–1991.. 11. Tzatzaki E, Spartalis M, Kamperidis V, Spartalis E, Giannakoulas G, Karvounis H. Diastolic dysfunction in end-stage renal disease patients. Hell J Atheroscler 2017, 8: 96-102.
12.
How to cite this article: KewanM, Goda T, El Hindy Y, Hussin A. Left ventricular dysfunction in