Organized by C.O.E.T, Akola. Available Online at www.ijpret.com375
INTERNATIONAL JOURNAL OF PURE AND
APPLIED RESEARCH IN ENGINEERING AND
TECHNOLOGY
A PATH FOR HORIZING YOUR INNOVATIVE WORK
PAYBACK ANALYSIS OF SOLAR PV SYSTEM FOR RESIDENTIAL USE
UMESH P. PAGRUT1, JAYANT G. INGOLE2
1. Shri Shivaji College, Akola.
2. School of Architecture, Akola.
Accepted Date: 12/03/2016; Published Date: 02/04/2016
Abstract:Nowadays installed power capacity of photovoltaic system has an exponential increase around the
world. For this increase various factors are responsible. Ease of availability, independent source of supply, cost effectiveness and environmental pollution are some major aspects for the growth of photovoltaic (PV) system. This paper aims to study cost effectiveness of the solar PV system used for residential use. To have a knowledge for this aspect, design and construction evaluation of PV system, simulation technique is used. Simulation is done by utilizing the modules of software from MATLAB. The methodology of project is based on standard irradiance data to produce power by simulating the system operation. Economic analysis is done by comparing energy produced by solar photovoltaic system and actual commercial energy supplied by MAHADISCOM (MSEB) for the selected system.
Keywords: Solar, PV system, Irradiance, Simulink
Corresponding Author: MR. UMESH P. PAGRUT Co Author: MR. JAYANT G. INGOLE
Access Online On: www.ijpret.com
How to Cite This Article:
Umesh P. Pagrut, IJPRET, 2016; Volume 4 (8): 375-385
PAPER-QR CODE
SPECIAL ISSUE FOR
NATIONAL LEVEL CONFERENCE
"RENEWABLE ENERGY
Organized by C.O.E.T, Akola. Available Online at www.ijpret.com376 INTRODUCTION
Urbanization and economic development are leading to a rapid rise in energy demand in urban areas in our country leading to enhanced Green House Gas (GHG) emissions. Many cities around the world are setting targets and introducing polices for promoting renewable energy and reducing GHG emissions. Accordingly, the Ministry of New and Renewable Energy (MNRE), Government of India has taken initiatives to develop green campuses under "Development of Solar Cities" program which aims at minimum 10 per cent reduction in projected demand of conventional energy at the end of five years. [1] [2]
The key component of solar PV system is the solar panel. It costs near about 50% of entire solar PV system. The maximum power point tracking (MPPT) control strategy applied on solar PV inverters have greatly increased the efficiency of solar PV system output. For the erection of solar PV system either assistance of contractor is taken or very few, mostly residential units, are installed by private semiskilled parties. Research has indicated that most of such projects do not complete paperwork for PV system output optimization, site analysis and roof space evaluation. In this paper calculations for the solar energy economic utilization is done by studying the case study of residential 750 Wp solar system. [3]
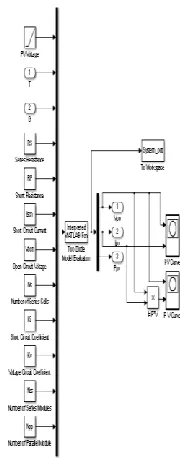
Simulation in MATLAB software is done to study [4] the performance and output of components of solar PV system.
FACTORS AFFECTING PV OUTPUT
Energy efficiency factors must be carefully considered while designing any solar PV systems to get the best out of your efforts and investment. Following are six important considerations:
1. Cable Thickness: Normally in PV system DC voltages is 12V, 24V or 48V. For the same wattage much higher currents are involved in the PV systems. This brings into picture resistance losses in the wiring.
Organized by C.O.E.T, Akola. Available Online at www.ijpret.com377
3. Shading: Ideally solar panels should be located such that there will never be shadows on them because a shadow on even a small part of the panel can have a surprisingly large effect on the output. [5]
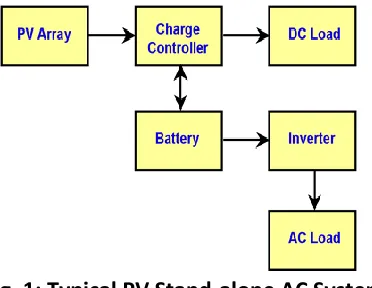
4. Charge Controller: An inherent characteristic of solar silicon cells is that the current produced by a particular light level is virtually constant up to a certain voltage (about 0.5V for silicon) and then drops off abruptly. MPPT (Maximum Power Point Tracking) charge controller tries keeping the panel at its maximum voltage and simultaneously produces the voltage required by the battery.
5. Inverter Efficiency: When the solar PV system is catering to the needs of the AC loads an inverter is needed. Although inverters come with wide ranging efficiencies but typically affordable solar inverters are between 80% to 90% efficient.[6]
6. Battery Efficiency: Whenever backup is required batteries are needed for charge storage. Lead acid batteries are most commonly used. All batteries discharge less than what go into them; the efficiency depends on the battery design and quality of construction.
MODELLING PV MODULE
Solar cell is basically a PN junction fabricated in a thin wafer or layer of semiconductors. The electromagnetic radiation of solar energy can be directly converted to electricity through photovoltaic effect.[7] When exposed to sunlight, photons with energy greater than the band-gap energy of the semiconductor are absorbed and create some electron-hole pair proportional to the incident irradiation. Under the influence of the internal electric fields of the PN junction, these carriers are swept apart and create photocurrent (Iph) which is directly proportional to solar irradiation (G). [8]
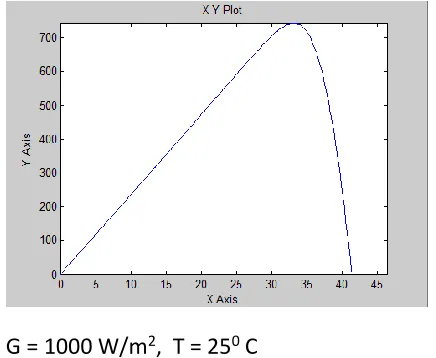
Organized by C.O.E.T, Akola. Available Online at www.ijpret.com378 Naturally, PV system exhibits a nonlinear current- voltage I-V and power-voltage P-V characteristics which vary with the radiant intensity G and cell temperature T. [9] The dependence of power generated by a PV array can readily be seen in the I-V and the P-V characteristics of PV arrays as shown in Fig. 4. [10]
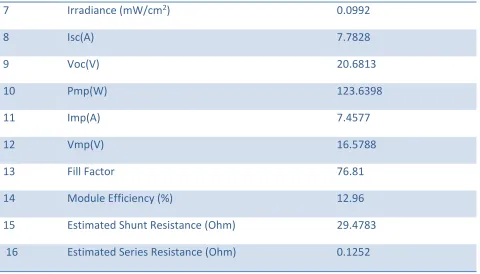
Table No. 1: Data Sheet of Selected Module
SN Description Details
1 Operator SGTIPDC
2 Product ID 125WP/12V SN80
3 Current Temp Coefficient (mA/oC) 2.000
4 Voltage Temp Coefficient (mV/ oC) -2.0000
5 Model Area (cm2) 9620.00
6 Sensor Temperature oC 28.7
Fig. 2 Solar Module
Organized by C.O.E.T, Akola. Available Online at www.ijpret.com379
7 Irradiance (mW/cm2) 0.0992
8 Isc(A) 7.7828
9 Voc(V) 20.6813
10 Pmp(W) 123.6398
11 Imp(A) 7.4577
12 Vmp(V) 16.5788
13 Fill Factor 76.81
14 Module Efficiency (%) 12.96
15 Estimated Shunt Resistance (Ohm) 29.4783
16 Estimated Series Resistance (Ohm) 0.1252
G = 1000 W/m2, T = 250 C
Voc = 41.36 Volt , Imax = 23.69 Amp
X-Axis: Voltage (V) Y-Axis: Current (I)
Organized by C.O.E.T, Akola. Available Online at www.ijpret.com380 G = 1000 W/m2, T = 250 C
Voc = 41.36 Volt , Pmax = 742.90 Watt X-Axis: Voltage (V) Y-Axis: Power (P)
Fig. 5: Voltage-Power (V-P) Characteristics
SYSTEM DESIGN
A. Solar Panels: It is the standard selection decided by the requirement of Conversion Unit SOLARCON. It is recommended for 24 Volt, 20 Amps, 600 Wp. We selected 750Wp considering thumb rule of 1.3 times of recommended value. [11] [12]
600 x 1.3 = 780 ~ say 750 Wp.
B. Cable: SOLARCON is rated for 20 Amp.
Maximum current for panel,
Imax = 750 Wp / 24V = 31.25 Amp. For this current rating cable used is POLYCAB make, industrial 2 core, 4 sq mm.
C. Conversion Unit: Model SOLARCON HISIS, 12V -24V / 20 Amp by Su-Kam is used for conditioning of solar power to electrical energy.
D. Battery: 1000 VA, 2 Nos. Lead Acid Solar batteries are used.
Organized by C.O.E.T, Akola. Available Online at www.ijpret.com381 PAYBACK PERIOD
In order to calculate payback period of investment on solar system, all the expenditure incurred for solar system are considered. For calculating the cost, system is designed by the thumb rule utilized in routine practice. Technical aspects are referred by considering the standard published and manufacturer’s data. Two part calculations are done for the comparison point of view. For first part calculations are done from the electric bill data from MSEB per unit average rate for electricity. For second part after the implementation of solar system in conjunction with grid system, kWh units saved are observed. With observation of difference in consumed units, average billing rate is calculated. And with this rate saving calculations are done.
A. System Output: For the case study, solar system of Shri Shailesh Dhotre, Ranpise Nagar,
Akola is used who uses it for residential use in conjunction with MSEB grid. The details of grid connected meter are, Consumer No. 310071315095 and BU No. 4592. SOLARCON unit from Su-Cam Company for solar energy conversion in electric energy was installed in last month of
November, 2016. Fig 6 and Fig 7 shows the actual setup of solar system. Table No. 2 shows per month per unit cost of energy used from grid side and in conjunction with solar system. Table No. 3 shows the cost analysis and finally per unit saving in cost.
Organized by C.O.E.T, Akola. Available Online at www.ijpret.com382 B. Saving Per Unit
Table No. 2:Per Month Unit Cost
Table No. 3: Per Unit Saving in Cost by Solar Use
System Month Units Bill (Rs) Unit Cost (Rs)
SOLAR Feb, 16 78 430 5.51
Jan, 16 57 340 5.96
Dec, 15 53 320 6.03
GRID Nov, 15 365 3230 8.84
Oct, 15 454 4960 10.92
Sep, 15 325 2590 7.96
Aug, 15 374 3200 8.55
Jul, 15 652 6490 9.95
Jun, 15 865 8020 9.27
May, 15 643 5970 9.28
Apr, 15 392 3030 7.72
System Month Ave. Units per Month
Cost Saving
SOLAR Feb, 16 62.66 Rs. 5.83/- Rs. 3.23/- per
kWh by using Solar System Jan, 16
Dec, 15
GRID Nov, 15 508.75 Rs. 9.06/-
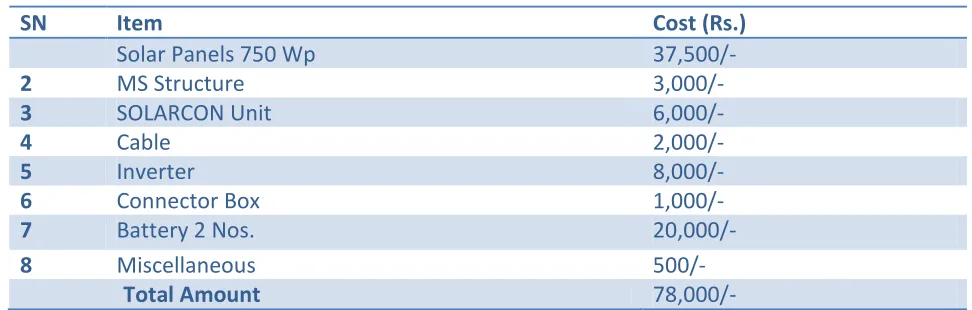
Organized by C.O.E.T, Akola. Available Online at www.ijpret.com383 C. Cost of Assembly:
Table No. 4: Total Cost of Assembly
D. Payback Period Calculation:
Table No. 5: Payback Period Calculation
RESULT
Simulated results from MATLAB software gives the Open Circuit Voltage (Voc) 41.36 Volt, Maximum Current (Imax) 23.69 Amp and Maximum Power (Pmax) 742.90 Watt. It is evident with the observation of Table No. 2 that from the month of December 2015, there is reduced consumption of units from the grid system. The demand of power is mostly supplied by power generated by solar system. The reduced use of units (kWh) gives low rate for the energy used from grid system. Table No. 3 shows the average cost of energy for the supply from grid and by using the solar system. With use of solar system, there is a saving of Rs. 3.23/- per kWh. Considering the average consumption per month and saving rate due to use of solar power, Table No. 5 gives the payback period of 54 months i.e. 4.5 years.
SN Item Cost (Rs.)
Solar Panels 750 Wp 37,500/-
2 MS Structure 3,000/-
3 SOLARCON Unit 6,000/-
4 Cable 2,000/-
5 Inverter 8,000/-
6 Connector Box 1,000/-
7 Battery 2 Nos. 20,000/-
8 Miscellaneous 500/-
Total Amount 78,000/-
Cost of assembly Rs. 78,000/-
kWh saved per month 508.75 - 62.66 = 446.09
Saving in Rs. per unit Rs. 3.23
Per month saving in Rs. 446.09 x Rs. 3.23 = Rs. 1440.87
Payback period in month
Organized by C.O.E.T, Akola. Available Online at www.ijpret.com384 CONCLUSION
Solar system is economical in use. This fact is proved by the calculations from the setup of Shri Shailesh Dhotre’s solar system erected in conjunction with the grid system. As the entire life of solar panels is 25 years and inverter/ converter unit is 20 years, system is proved to be economical. The main reason for the economy of solar system is that there is no fuel charge for the energy generation by solar panels, as sun rays is the gift of God. There is least maintenance for the solar system. As no harmful gases or GHG gases are liberated from the solar system, it is environmental friendly. Simulated results gives the maximum power output, but in actual working condition power output is low. This is because, irradiance for Akola is low which is the prime factor for energy generation. Again simulink model is not developed with system losses such as cable, contact resistance, inverter efficiency and dust deposition on panels. Surrounding temperature is a key factor for output energy also.
REFERENCE
1. www.uqc.ac.in
2. www.mnre.qov.in
3. Modeling Solar Photovoltaic Cell and Simulated Performance Analysis of a 250W PV Module
By: Md. Aminul Islam, Adel Merabet, Rachid Beguenane and Hussein Ibrahim, 978-1-4799-0106-7/13/$31.00 ©2013 IEEE
4. Design and Return on Investment Analysis of Residential Photovoltaic System, By: Duotong Yang, Haniph A. Latchman, 278 – 6648 / 15 © 2015 IEEE
5. PV Array Characteristics Analysis Under Partial Shading & Modeling of P&O MPPT Applied Boost Convertor Using Matlab/Simulink, By: Alex Joseph, Kamala J, 978-1-4673-6150-7/13/$31.00 ©2013 IEEE
6. Power Output Evaluation of Polycrystalline PV Panel under Various Irradiances and Temperatures in Moroccan Regions By: Radouan Ajdid, Mohammed Ouassaid, Mohamed Maaroufi 978-1-4799-7479-5/15/$31.00 ©2015 IEEE
Organized by C.O.E.T, Akola. Available Online at www.ijpret.com385 8. A Photovoltaic System Model For Matlab / Simulink Simulations By: Cemal Keles, B. Baykant Alagoz, Murat Akcin, Asim Kaygusuz, Abdulkerim Karabiber, 978 – 1 – 4673 – 6392 -1 / 13 / $31.00 ©2013 IEEE
9. A Simple and Accurate Model of Photovoltaic Modules for Power System Design By: V. Boscaino, G. Cipriani , V. Di Dio, R. Miceli, G. Capponi, 978 – 1 – 4799 – 3787 – 5114 / $31.00 © 2014 IEEE
10. Characterization of PV Cells with Varying Weather Parameters to Achieve Maximum Power By: Kamala J, Tamilarasi A, 978 – 1 – 4788 – 7225 – 8 / 15 / $31.00 ©2015 IEEE
11. Modeling, Simulation and Parameters Estimation for Photovoltaic Module By: Badr Aldwane,978-1-4799-3602-1/14/$31.00©2014 IEEE
12. Evaluating Solar Photovoltaic System Performance using MATLAB, By: M. Bouzguenda , T.