CrossMark Published by DiscoverSys
ABSTRACT
Background: Cancer has become an increasingly important issue for health expenditure and in the public sector. Therefore, identification of socioeconomic patterns is essential for developing novel methods of cancer prevention. A cancer risk prediction system is proposed here, which is easy and cost-effective, also saves time.
Methods: Initial data were collected from surveys with a digital audio recorder on 2014 cancer dependent and independent smokers. Patterns were found using a decision tree model. As socioeconomic patterns are neglected altogether, this study will pave the way for public health policies.
Results: This study shows that a death rate in cancers by smoking around 24.3%. According to them, the type of cancers attributed to smoking was oral cavity (8.2%) and bladder (8.2%) cancer. Some risk factors related to smoking and cancers were included male patients
(66%), age <35 years old group (56.3%), employee (86.3%), married (86.2%), as well as have very good public insurance (96.5%). In addition, 98% cancer patients were known have public insurance. Education levels have been shown most of the patients with cigarette smoking had less than a college education and in the absence of police, they use fewer safety belts. Those with risk factors for failing to wear a seat belt under a doctor to quit smoking. Although The health situation in cancers attributed to smoking vs. non-smoking attributed to worse evaluated. The age factor is effective in counseling for the doctor to quit smoking, and people aged 35-65 are the most advised to quit smoking. Conclusion: Smoking-related costs in Iran are high. The cost methodology presented is useful for policy making. Cost estimates can be used to evaluate the level of cigarette taxes and other policies related to smoking.
Keywords: cancer, smoking, socioeconomic class, data mining, health policy
Cite This Article: Hosseini, L., Vatanpour, H., Mohammadzadeh, M., Abdolahi, M., Motidostkomleh, R. 2018. Data mining approach for exploring socioeconomic patterns in cancer. Bali Medical Journal 7(1): 97-103. DOI:10.15562/bmj.v7i1.652
Data mining approach for exploring socioeconomic
patterns in cancer
Leila Hosseini,1 Hossein Vatanpour,2* Mehdi Mohammadzadeh,1 Mohamadreza Abdolahi,1 Rita Motidostkomleh1
INTRODUCTION
There is an ample evidence of the association between the incidence and mortality of cancer and socioeconomic factors; however, only a little-pub-lished data have been paid attention to the effects of socioeconomic and demographic patterns.1,2,3,4,5
Despite the importance of the socioeconomic level of cancer patients, there is still a paucity of evidence on this issue. Cancers are an increasingly important area of health expenditure and the public sector. A great number of factors lead to cancers, such as smoking, which has received considerable critical attention and a question of great interest to wide range of fields in the relationship between smoking and cancers
Some previous studies confirm the role of socio-economic status in the incidence of cancers and mortality. One of them is Body Mass Index (BMI) were increasing a 5 kg/m2 in BMI in men has been observed to be strongly associated with esophageal adenocarcinoma as well as thyroid, colon, and renal cancers. In addition, a strong relationship has been recorded in women between a 5kg/m2 increase in BMI toward to endometrial, gallbladder, and renal cancers. A weak positive relationship also has been
reported between increased BMI and rectal tumors as well as threatening melanoma in men, postmen basal breast, pancreatic, colon cancer in women, leukemia, multiple myeloma, and non-Hodgkin lymphoma in both genders.6,2
Studies have shown that the number of students who smoked one pack of cigarettes or more every week increased with the decreasing social class, as measured by their fathers’ occupations. This pattern was seen for both male and female students. The number of fathers who smoked demonstrated a corresponding relationship with social class. However, the number of mothers who smoked did not fluctuate by social class. The number of students who smoked and especially those who were heavy smokers was low in families where both parents were regular smokers.6
Given the effect of gender on smoking, it was argued that in Spain, from 1987 to 2001, differences in smoking have increased in both sexes. Males as the result of a higher reduction in the prevalence of smoking amongst them are the most advantaged clusters, and in women, it is because of a greater risk among the less advantaged clusters. Males in more
1Department of Pharmacoeconomics
and Pharma Management, School of Pharmacy, Shahid Beheshti University of Medical Sciences.
2Toxicology and Pharmacology
Department, School of Pharmacy, Medical Science University of Shahid Beheshti, Tehran, Iran.
*Correspondence to:
Hossein Vatanpour, Toxicology and Pharmacology Department, School of Pharmacy, Medical Science University of Shahid Beheshti, Tehran, Iran
Received: 2017-05-31 Accepted: 2017-09-30 Published: 2017-10-9
Volume No.: 7
Issue: 1
First page No.: 97
P-ISSN.2089-1180
E-ISSN.2302-2914
deprived areas show a higher probability of smoking. For women, the likelihood of smoking is greater when residing in less deprived urban areas up to 1995–97.
Individual and environmental, social and socie-tal issues, including social capisocie-tal, social networks or socioeconomic position, affect smoking patterns. Lower education, more disadvantaged social clus-ters living in regions in the worst socioeconomic circumstances, are more likely to smoke than advanced working class and educational levels. So that, the models take into account age, marital posi-tion, urban size, and employment position.7
High SES and living in local urban areas have a lower smoking prevalence than other clusters. Alaska Natives, low SES, rural inhabitants had both high smoking prevalence (48%) and constituted a large percentage of the country’s smokers (nearly 10%).
With non-native high-SES urban inhabitants, making up the largest percentage of users despite the lower prevalence, and Alaska Natives, low SES, and Ural inhabitants have high prevalence and make up a large percentage of users.8,9,10
The study in Britannia evaluated the effect of three important factors: socioeconomic conditions, psychological health, and the partner’s smoking position. The study agrees that female smoker are more disadvantaged than the wider population of women, both concerning their socioeconomic condition. In this disadvantaged group, higher cigarette consumption was linked to more socio-economic disadvantage and poorer psychosomatic health to partner’s smoking position.11
Low schooling level, old beliefs, literacy level, SES and employment, and status-all effect cigarette smoking among adult males. Although poor people smoked more and spent more of their incomes on cigarettes, another causes-like educational level, and old beliefs were found to affect the practice of cigarette smoking. In men, a significant relationship is found between cigarette smoking and religion, literacy, the level of education, employment, wealth index and the rate of reading media, attention to radio and television. The relationship between the type of cigarette smoking, place of habitation or protection by health insurance were not significant.
The impact of a religious conviction on tobacco use differs across the SES. Islam impacts tobacco use more in the poor SES group, while Christianity impacts it more in the opulent SES groups.
Plaintiffs in the poor SES groups who cannot read at all and have no education use more tobacco. However, those with secondary school education in the richer SES appear to use more tobacco than others. Another factor is financial stress. As data were cross-sectional, reliable inferences cannot be drawn about the causal relationship between
smoking and financial stress. It is probable that they both affect each other. Certainly, expenditure on tobacco will decrease available funds that could otherwise be used to alleviate financial stress.12
The study discovered that various effects of cigarette smoking on BMI: smoking raises BMI at low/moderate BMI level and reduces BMI at higher BMI levels.13
In addition, regarding the effect of culture on smoking, some evidence was found for both individual and societal teenage smoking, which was interrelated in a mixed model, regardless of culture or smoking rates. Individual factors include academic success, life gratification and future- orientedness, and social influences (aggression, social association, and perceived friends’ smoking).
A major issue in early cancer research concerned socioeconomic status, which suggests a deep under-standing of how society works or how it should work. The fact is that there is no definition of SES that is agreed upon because the construct neces-sarily entails political ideologies about existing and desired social structures.
This study outlines a critical role for SES in cancer patients. Till date, various methods have been developed and introduced to measure SES status. Data mining was used in this study.
METHODS AND MATERIALS
Data mining methods have become a widely-used research tool for medical researchers to identify and use patterns and relationships among a large number of variables. Decision tree learning is one of the most widely used and practical methods for classification. In this approach, learned trees can be characterized as a set of if-then roles. Decision trees are very useful in recognizing and understanding domain experts. A decision tree is a tree where each non-terminal node is a test or decision on the data item considered. The selection of the optimistic branch depends upon the outcome of the test. To classify a particular data item, we start at the root node and follow the claims down until we reach a terminal node. A decision is made when a termi-nal node is approached. Decision trees can also be taken to refer to a unique form of a rule set, charac-terized by their hierarchical union of rules.
Beheshti health administrators and 35,500 cancer patients. Then, about 12,000 participants from cancer patients residing in Tehran province during 2014 were divided into two groups. The first group, according to ICD10, had cancer due to smoking, and the second group did not depend on smoking.14
The first group, including ICD (00-C14 (lip, oral cavity, pharynx), C15 (esophagus), C16 (stomach gastric), C25 (pancreas), C32 (larynx), C33-C34 (trachea, lung, bronchus), C53 (cervix, uterus), C64-C65 (kidney and renal pelvis), C67 (urinary bladder) and there was not a code C92 (acute myeloid leukaemia). The second group included other cancers.
The design of the survey was based on questions, including smoking history (light, moderate, heavy), insurance coverage (public and private), health status (excellent, very good, good, fair to poor, based on Likert Index), socio-demographic char-acteristics (such as age, marital status, education, monthly family expenditure), risk behaviours (such as obesity, seat belt), and annual expenditures on healthcare services (such as inpatient hospitaliza-tion, ambulatory, outpatient visits and medication).
RESULTS
The association between socioeconomic levels and cancers was determined by a questionnaire
and data was then analyzed using statistical tests through data mining, based on a decision tree model. To extract knowledge from data, we compared the overall final questionnaire between two groups of cancers, independent from and dependent on smoking. Data are presented in the tables.
According to the Table 2, the data gathering show 1,565 patients have cancers with smoking independence while 521 participants have cancers with smoking dependence. The response rate in both groups is about 8 percent, and a death rate in cancers by smoking dependence is about three times (Table 2).
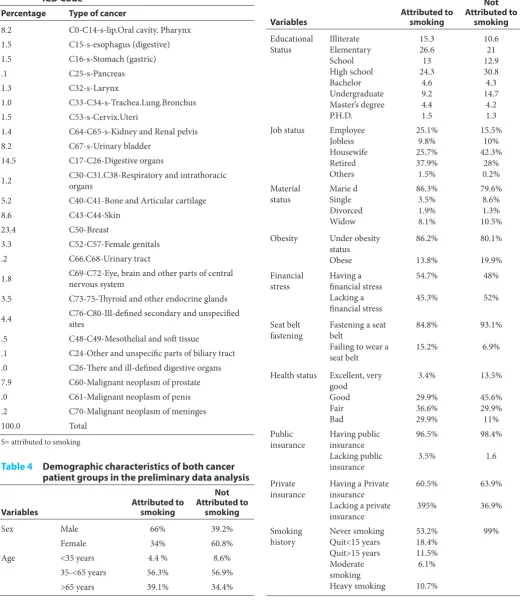
Based on frequencies of cancers by type in ICD code, it indicates that the breast cancers have the highest percentage among them (23.4%), followed by digestive organs cancer (14.5%), skin cancer (8.6%), as well as urinary bladder cancer (8.2%), and lip, pharynx, and oral cavity cancer (8.2%) (Table 3).
The results obtained from the preliminary anal-ysis of data related to the demographics in two cancer patient groups smoking-dependent and smoking-independent are shown in Table 4.
According to the type of cancers among both groups, breast cancer is known as the most common cancer among the smoking-dependent
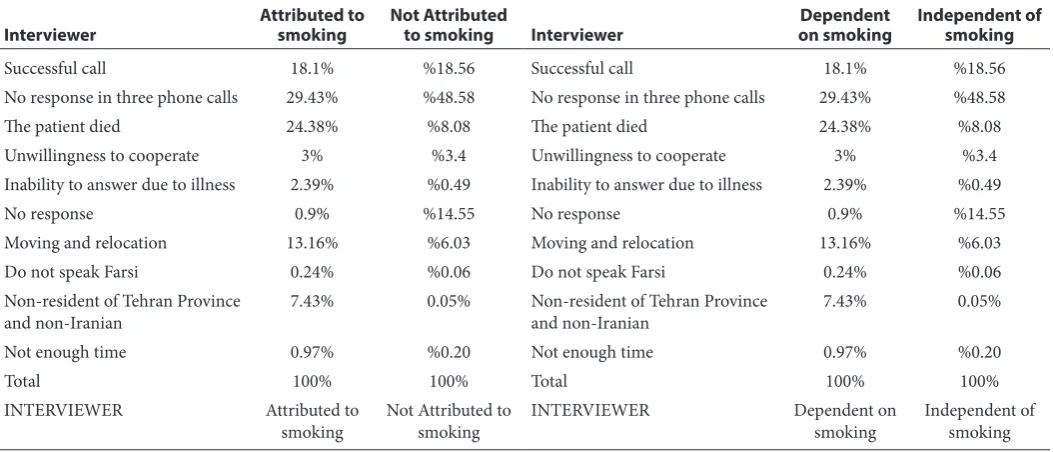
Table 1 An overview of the data gathering process
Interviewer Attributed to smoking Not Attributed to smoking Interviewer on smokingDependent Independent of smoking
Successful call 18.1% %18.56 Successful call 18.1% %18.56
No response in three phone calls 29.43% %48.58 No response in three phone calls 29.43% %48.58
The patient died 24.38% %8.08 The patient died 24.38% %8.08
Unwillingness to cooperate 3% %3.4 Unwillingness to cooperate 3% %3.4
Inability to answer due to illness 2.39% %0.49 Inability to answer due to illness 2.39% %0.49
No response 0.9% %14.55 No response 0.9% %14.55
Moving and relocation 13.16% %6.03 Moving and relocation 13.16% %6.03
Do not speak Farsi 0.24% %0.06 Do not speak Farsi 0.24% %0.06
Non-resident of Tehran Province
and non-Iranian 7.43% 0.05% Non-resident of Tehran Province and non-Iranian 7.43% 0.05%
Not enough time 0.97% %0.20 Not enough time 0.97% %0.20
Total 100% 100% Total 100% 100%
INTERVIEWER Attributed to
smoking Not Attributed to smoking INTERVIEWER Dependent on smoking Independent of smoking
Table 2 The response and death rate among patients who have cancers in smoking independence or dependence
groups
All participants 11294 patients 12.2% died
Not Attributed to Smoking 8431 patients 8% died 1565 participants
Table 3 The Frequencies of Cancer according to ICD Code
Percentage Type of cancer
8.2 C0-C14-s-lip.Oral cavity. Pharynx 1.5 C15-s-esophagus (digestive) 1.5 C16-s-Stomach (gastric)
.1 C25-s-Pancreas
1.3 C32-s-Larynx
1.0 C33-C34-s-Trachea.Lung.Bronchus 1.5 C53-s-Cervix.Uteri
1.4 C64-C65-s-Kidney and Renal pelvis 8.2 C67-s-Urinary bladder
14.5 C17-C26-Digestive organs
1.2 C30-C31.C38-Respiratory and intrathoracic organs
5.2 C40-C41-Bone and Articular cartilage
8.6 C43-C44-Skin
23.4 C50-Breast
3.3 C52-C57-Female genitals .2 C66.C68-Urinary tract
1.8 C69-C72-Eye, brain and other parts of central nervous system
3.5 C73-75-Thyroid and other endocrine glands
4.4 C76-C80-Ill-defined secondary and unspecified sites
.5 C48-C49-Mesothelial and soft tissue
.1 C24-Other and unspecific parts of biliary tract .0 C26-There and ill-defined digestive organs 7.9 C60-Malignant neoplasm of prostate .0 C61-Malignant neoplasm of penis .2 C70-Malignant neoplasm of meninges
100.0 Total
S= attributed to smoking
Table 4 Demographic characteristics of both cancer
patient groups in the preliminary data analysis
Variables Attributed to smoking
Not Attributed to
smoking
Sex Male 66% 39.2%
Female 34% 60.8%
Age <35 years 4.4 % 8.6%
35-<65 years 56.3% 56.9%
>65 years 39.1% 34.4%
Table 4 Continues
Variables Attributed to smoking
Not Attributed to
smoking Educational
Status IlliterateElementary School High school Bachelor Undergraduate Master’s degree P.H.D.
15.3 26.6 13 24.3
4.6 9.2 4.4 1.5
10.6 21 12.9 30.8 4.3 14.7
4.2 1.3 Job status Employee
Jobless Housewife Retired Others
25.1% 9.8% 25.7% 37.9% 1.5%
15.5% 10% 42.3%
28% 0.2% Material
status Marie dSingle Divorced Widow
86.3% 3.5% 1.9% 8.1%
79.6% 8.6% 1.3% 10.5% Obesity Under obesity
status Obese
86.2%
13.8%
80.1%
19.9% Financial
stress Having a financial stress Lacking a financial stress
54.7%
45.3%
48%
52%
Seat belt
fastening Fastening a seat belt Failing to wear a seat belt
84.8%
15.2%
93.1%
6.9%
Health status Excellent, very good
Good Fair Bad
3.4%
29.9% 36.6% 29.9%
13.5%
45.6% 29.9% 11% Public
insurance Having public insurance Lacking public insurance
96.5%
3.5%
98.4%
1.6
Private
insurance Having a Private insurance Lacking a private insurance
60.5%
395%
63.9%
36.9%
Smoking
history Never smokingQuit<15 years Quit>15 years Moderate smoking Heavy smoking
53.2% 18.4% 11.5% 6.1%
10.7%
patients (23.4%). In contrast, Cancers of the lip, tongue and oral cavity are the most common in those smoking-independent (8.2%) (Table 5).
In order to know the relationship between the cost of treatment and other variables, Table 6 is trying to illustrate them. This study suggests that the patients seem to seek more referrals to the private sector with private insurance, but who has financial stress more often looking for a referral to the public sector. In addition, the patients who have a higher education level seems used the private sector more than the public sector. For the revenue status, higher income patients tend to refer to the private sector more than public sector. However, this study is only giving no relationship in relation with fastening the seat belt, history of smoking, sex, and overweight status (Table 6).
The relationship between monthly revenue and smoking history as well as insurance status were shown in Table 7 and 8. Table 7 suggested that most of the lower-income smokers had 5000000-7500000 thousand rials revenue a month. In addi-tion, the insurance coverage in cancer patients shows that about 98% cancer patients had public insurance, whereas only 63% of insurance coverage from the private sector (Table 8).
According to the health status and relation-ship between cancer and their risk factors, it was suggested that most participants satisfied with their health status (Table 9). However, there is no rela-tionship between cancer and obesity in this study, but a relationship between cancer and seat belt was found (Table 10).
DISCUSSION
It is interesting to note that in all these studies comparing two groups of cancers-attributed to and not attributed to different smoking patterns emerged.
Table 5 The most common cancers in smoking and without
smoking groups
Not Attributed to Smoking Breast Cancer 23.4% Digestive system 14.5% Skin 8.6%
Attributed to Smoking Cancer of the lip, tongue, oral cavity 8.2%
Cancer of bladder 8.2%
Table 6 Relationship between cost of treatment and
other variables Relationship
between the cost of treatment and
other variables Private insurance See more referrals to the private sectorThere is a relationship Having financial
stress See more referrals to the public sectorThere is a relationship Education status See higher education patients use the
private sector more than the public sector There is a relationship
Revenue status Higher-income patients refer to the private sector more than public sector
There is a relationship Fastening of seat
belt Referrals to public and private sectors are the same. There is no relationship
Age 35–65-year-old patients referred to private sector more than public sector
There is a relationship.
(In non-smoker patients, age is the most important division.)
History of
smoking The smokers have more medical expenses than non-smokers, in both the private and public sector.
(Smoking history is a major division.) Sex There is no relationship with referrals to
the public and private sectors.
Overweight There is no relationship with referrals to the public and private sectors
Table 7 The relationship between monthly revenue and
smoking history
Monthly revenue
in cancer patients History of smoking Mostly lower-income smokers had 5000000-7500000 thousand rials revenue a month (1 dollar = 3500000 rial)
Table 8 Insurance coverage status among cancer patients
Insurance coverage in
cancer patients Public Private
98% 63%
98% cancer patients had
public insurance Basic insurance is the most important factor in government spending
Table 9 Health status among
cancer patients
Assessment of health status (self-reported) patient)
Most participants satisfied with their health status
The high mortality rate in cancer patients is a worthwhile point
Table 10 The relationship between cancer
and risk factors
Cancer and
obesity There is no relationship between cancer and obesity in this study Cancer and
This study was conducted during 2014 based on 2013 data. Accordingly, there were 521 cancer patients with smokers who compared with 1540 patients non-smokers. Diseases attributed to smoking were compared with diseases which were not attributed to smoking. It was found that about 34% patients from attributed to smoking cancers group vs. 60.8% patients from not attributed to smoking cancers were women. In addition, 66% of the attributing group were men vs. 39.2 % from the not attributed group. In a not attributed to the smoking group, 4.4% were less than 35 years old vs. 8.6% is attributed to the smoking group. 56.3% were 35–<65 years old in the first group vs. 56.9% in the second group. According to the age, about 39.14% in the first group were > 65 years old compared with only 34.4% in the second group. It seems 54.7% of all patients not attributed group had financial stress vs. 48% in group attributed to smoking. 13.8% patients not attributed group was overweight vs. 19.9% in the not attributed group. In the attributed group, 3.4% participants evaluated their health status as ‘very good’ vs. 13.5% in the not attributed group. 29.9% of the first group evaluated their health status as good vs. 45.6% in the second group. In the attributed group, 36.6% patients evaluated their health status as fair vs. 29.9% in the second group. In the attributed group, 29.9% had bad health status, vs. 11% in the not attributed group. Fastening seat belt in the absence of police, 84.8% patients were found in the attribute group vs. 93.1% in the not attributed group. Answered: Yes.
In the attributed group, 25.1% patients were employees, 9.8 % of them were jobless, 25.7% were housewives, and 37.9% were retired. Results showed that 5.5% patients in the not attributed group were employees, 10% were jobless, 42.3% of them were housewives, and 28% were retired. Marital status showed 86.3% patients in the attributed group were married vs. 79.6% in the not attributed group. Singles were 3.5% in the first group against 8.6% in the second group. The divorce rate was 1.9% in the first group vs. 1.3% in the second group. Widows comprised 8.1% in the attributed t group vs. 10.5% in the not attributed group.
As far as public insurance in the attributed group was concerned, 96.5% had public insurance as against 98.4% in the not attributed group. 60.5% patients in the first group had private insurance vs. 63.9% in the second group.
This study yielded surprising results on smoking history. It was different in the two groups. The inde-pendent group showed about 99% patients never smoked and, compared with the first group, it was found that 53.1% patients never smoked, 18.4% quit smoking less than 15 years ago, and 11.5% cited more than 15 years. According to the type of
smokers, around 6.1% were moderate smokers and 10.7% heavy smokers. Some of the results of this study was similar to other studies, for example, seat belts in groups with other risk factors such as smok-ing less visible but there are differences in marital status and smoking
CONCLUSION
This study showed cancer patients with private insurance have more referrals to the private hospi-tals. Financial stress caused more referrals to the public sector. Higher education had a significant relationship with referrals to private sectors and no significant relationship with referrals to public sectors. With higher revenue, patients have more referrals to the private sector. The age factor in non-smokers is the most important factor. Patients aged 35–65 years refer for treatment more frequently. No relationship has been reported between cost treatment and referrals to both sectors with Seatbelt and BMI. Concerning the history of smoking, the smokers experience more medical expenses than non-smokers in both private and public sectors. In smokers, smoking history is a major contributing factor.
According to the insurance coverage, it was found that 98% patients had public insurance and 63% had public insurance; then basic insurance is the most important factor in government spending. Surprisingly, most of the patients were satisfied with their health status. However, the findings cannot be extrapolated to all patients because of the attention rate. This result may be explained by the factor of time.
According to the monthly revenue, more low-income smokers group had 500-700,000 Tomans (~3000 Tomans = 1 dollar). The most obvi-ous finding to emerge from the analysis is that most common cancers in two groups were different. Breast cancer, digestive system, and skin were more common in the smoking-not attributed group, while in the second group cancers of the lip, tongue, oral cavity and bladder were common in smoking attributed one. This study found that the death rate in cancer- attributed to smoking was three times more than in others. These findings enhance our understanding of socio-economic levels.
People who have been borrowing from their interviews during the past year to pay for their living expenses and use financial resources to use public sector facilities, so the services of this department should be fair and easily accessible to them.
according to culture, and should, therefore, be mainstreamed from sociology and psychology.
Studies show that stress and discontent among single people than married and divorced and widowed More and more we turn to smoking to relieve stress But this pattern was not particularly visible and most of our study population was married, and more research is needed for married people. Stress has been a major contributor to cigarette smoking in the studied community, and it differs from the global model that needs to be examined by psychologists, although individuals in Iran prefer ethical marital considerations.
ACKNOWLEDGEMENT
The project was funded by a grant from the School of Pharmacy, Shahid Beheshti University of Medical Science. We would like to thank the health admin-istration of Iran and Tehran University.
REFERENCES
1. Bettina F. Piko, Aleksandra Luszczynska, Frederick X. Gibbons, Mert Teko zel. A culture-based study of personal and social influences of adolescent smoking. European Journal of Public Health, Vol. 15, No. 4, 393–398 q The Author 2005. Published by Oxford University Press on behalf of the European Public Health Association. All rights reserved. doi:10.1093/eurpub/cki008 Advance Access published on 4 July 2005
2. World Health Organization, ECONOMICS OF TOBACCO TOOLKIT, Assessment of the Economic Costs of Smoking 3. Rebecca A. Krukowski, Zoran Bursac, Melissa A. Little,
and Robert C. Klesges Karin Bammann, the Relationship between Body Mass Index and Post-Cessation Weight Gain in the Year after Quitting Smoking: A Cross-Sectional Study, PLoS One. 2016; 11(3): e0151290
4. Lijing Ouyang, Sibling effects on teen risky behav-iors, Department of economics-Duke university, November 2004.
5. M Siahpush/ R Borland /M Scollo Smoking and Financial Stress On January /10-2012-published by group.bmj.com
6. Ahmed K, Jesmin T, Rahman Z et al. Early Prevention and Detection of Skin Cancer Risk using Data Mining. Asian Pacific J Cancer Prev. 2013; 14(1):595-98
7. Bellachai A, Guven E. Predicting breast cancer surviv-ability using data mining techniques. Department of Computer Science, The George Washington University. 2006; 58(13);1-4
8. CDC, C. for D. C. and P: Medical-care expenditures attributable to cigarette smoking--United States, MMWR. Morbidity and Mortality Weekly Report. 1993; 43(26):469.
http://doi.org/10.1001/jama.1994.03520060026013
9. Miller VP, Ernst C, Collin F. Smoking-attributable medical care costs in the USA. Social Science and Medicine. 1999; 48(3):375–391. http://doi.org/10.1016/ S0277-9536(98)00344-X
10. Ashkan Babaheydari , A Thesis Submitted in the College of Graduate Studies and Research Culture, In Partial Fulfillment of the Requirements For the Degree of Masters of Arts In the Department of Economics University of Saskatchewan Saskatoon Edited by John Britton, ABC Of Smoking Cessation -Professor of Epidemiology at the University of Nottingham 2004 by Blackwell Publishing Ltd
11. Kaisaeng N, Harpe SE, Carroll NV. Out-of-pocket costs and oral cancer medication discontinuation in the elderly. J Manag Care Pharm. 2014; 20(7):669–75.
12. Kovacevic A, Dragojevic-Simic V, Rancic N, Jurisevic M, Gutzwiller FS, Matter-Walstra K, Jakovljevic M. End-of-life costs of medical care for advanced stage cancer patients. Vojnosanit Pregl. 2015; 72(4):334–41. http://doi. org/10.2298/VSP1504334K
13. Sturm R. The effects of obesity, smoking, and drinking on medical problems and costs. Health Aff. (2002): 21: 245–53.
14. Max W, Rice DP, Sung HY, Zhang X, Miller L. The eco-nomic burden of smoking in California. Tobacco Control. 2004; 13(3):264–7. http://doi.org/10.1136/tc.2003.006023