Available Online at www.ijpret.com 258
INTERNATIONAL JOURNAL OF PURE AND
APPLIED RESEARCH IN ENGINEERING AND
TECHNOLOGY
A PATH FOR HORIZING YOUR INNOVATIVE WORK
A REVIEW ON DETECTION OF THUNDERSTORM USING DATA MINING AND
IMAGE PROCESSING
GEETA N. JAMOD1, PROF. P. H. PAWAR2 1. M.E. Student, Department of computer science & engineering, BNCOE, Pusad.
2. Assistant Professor, Department of computer science & engineering, BNCOE, Pusad
Accepted Date: 05/03/2015; Published Date: 01/05/2015
\
Abstract:Natural calamities cause heavy destruction to both life and property. Thunderstorm is one of the most spectacular weather phenomena in the atmosphere. It is also known as electrical storm or lightning storm, is characterized by the presence of lightning and its effect on earth’s atmosphere known as thunder. Severe thunderstorms frequently occur over India during the pre-monsoon season. Heavy rain from thunderstorm leads to flash flooding and causes extensive loss to property and other living organisms. On the other hand, detection of thunderstorm is said to be complicated task in weather forecasting, due to its limited spatial or temporal extension either dynamically or physically. In this regard, many researchers proposed various methodologies for detection, but neither of them could provide accuracy. In this paper, the present research adopted clustering and wavelet transform techniques in order to improve the identification rate of thunderstorms to a greater extent. Firstly the satellite image is segmented using K-means clustering based on various color factors in order to remove textures from original image. The feature extracted clustered image is analyzed further by applying wavelet transformations. The proposed model results with higher accuracy of 89.23% in detection of thunderstorm.
Keywords: Clustering, Haar wavelet transform, Image processing, satellite imagery, thunderstorm.
Corresponding Author: MS. GEETA N. JAMOD
Access Online On:
www.ijpret.com
How to Cite This Article:
Geeta N. Jamod, IJPRET, 2015; Volume 3 (9): 258-267
Available Online at www.ijpret.com 259 INTRODUCTION
Thunderstorm is a vicious, climatic, disturbance that is associated with heavy rains; lightning, thunders, thick clouds and gusty surface winds [1].Thunderstorms are formed by a process called convection, defined as the transport of heat energy. Because the atmosphere is heated unevenly, an imbalance can occur which thunderstorms attempt to correct [11].Usually, thunderstorms have the spatial area for a few kilometers and life span of less than an hour. However multi-cell thunderstorms have a life span of several hours and may travel over a few hundreds of kilometers. Many parts over the Indian region experiencethunderstorms at higher frequency during pre-monsoon months when the atmosphere is highly unstable because of high temperatures prevailing at lower levels [2].
Cloud to ground lightning frequently occurs as part of the thunderstorm phenomena, which on severity becomes hazardous to the property, wildlife and population across the globe. Significant research work carried out in the last two decades about understanding the life cycle of thunderstorm and the prediction of thunderstorm is still a challenging task to the forecasters and researchers. Thunderstorms were predicted based on severity of sounds of the thunder, statistical test and graphing were the other parameters used for the prediction purpose. This motivates the present research to utilize satellite images, which are high in quality and can be effective source for the prediction purpose.
1. Thunderstorm formation
Thunderstorm may generally form and develop in any particular geographical location, perhaps most frequently within areas located at mid latitude when warm moist air collides with cooler air. Thunderstorm development is dependent on three basic components; moisture, lift, instability.
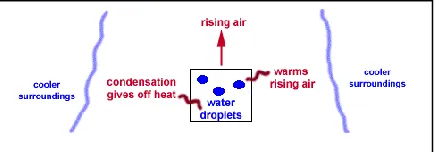
Moisture: Sufficient moisture must be present for clouds to form. As the warm air rises, it cools and the water vapor in the air condenses into cloud droplets. The condensation releases heat, allowing the rising air to stay buoyant and continue to move upward.
Available Online at www.ijpret.com 260 Lift: Regardless of how air is lifted, if the lift is enough to make the air warmer than the surrounding air, convection can continue [11].
Instability: It is critical factor in the development of severe weather. The greater the instability, the greater the potential for severe thunderstorms [12].
1.1 Stages of thunderstorm development
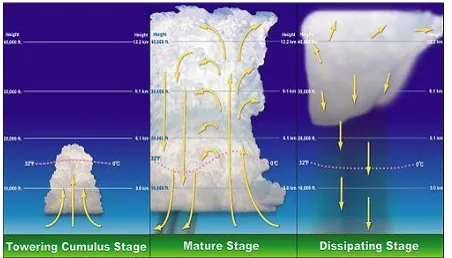
Thunderstorms result from the rapid upward movement of warm, moist air; this can be represented in 3 stages named as the cumulus, maturity, and dissipation stage.
The cumulus stage is when, the storm starts strengthening in this the warm, moist air rises above and gets mixed with the freeze air making the warm air to get colder resulting in condensation. In this stage, the cloud forms larger due to the instability in the atmosphere.
The maturity stage starts when the storm reach its peak and is well developed, including a strong, dense anvil along with updrafts and downdrafts and in this stage hail may also prevail.
The dissolving stage. The storm starts fading away, when the cool downdrafts begin to intensify, the storm begins to dissolve. These downdrafts basically push everything out of the storm
Fig. 2 Stages of thunderstorm development: cumulus stage, mature stage, dissipating stage
I. Present theories or Literature review
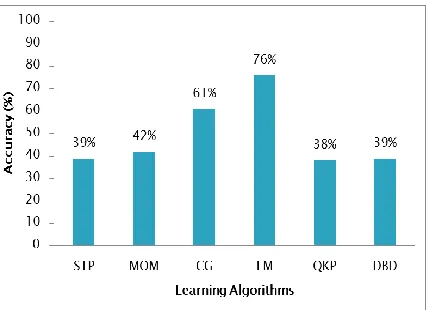
Available Online at www.ijpret.com 261 Delta(DBD). To test the impact of learning algorithms validated the model results with observation. A statistical analysis based on mean absolute error, root mean square error, correlation coefficient and percentage of correctness is also performed for comparison among predicted and observed data with above algorithms .From demonstrations, LM model performance is significantly better than other algorithms. The author concluded that ANN model with LM algorithm predicted the hourly surface temperature in terms of sudden fall of temperatures and intensity and gives accuracy of 76% compared to others.
Fig 3: Performance accuracy of learning algorithms for the prediction of hourly temperature during thunderstorm days.
Mahesh Anand, s., Ansupa Dashi, Jagadeesh Kumar, Amit
Available Online at www.ijpret.com 262 Fig. 4. Architecture of Proposed ANN Design
ANN is an iterative learning process in which data were presented to the network one at a time, and weights associated with the input values are adjusted each time. It has trained and tested using different weather data. Here minimum set of input is used; however increase in input parameter will effectively increase the prediction accuracy.
Harvey Stern [3] used a knowledge based system to predict thunderstorms. The result shows analysis of linear relationship between the predict and (Probability of Thunderstorm-PoTS) and the predictors (various combinations of Sine Day of Year, Cosine Day of Year, precipitation amount, Occurrence of Precipitation and Strength of Flow) significant data used were Precipitation amount and occurrence of precipitation. Highly significant is the predictor, Occurrence of Precipitation, suggest that the greater the likelihood of precipitation, the higher the likelihood of thunderstorms.
II. METHODOLOGY
The supreme goal is to scrutinize the satellite images obtained from Indian Meteorological Department, in order to predict whether the cloud images produces thunderstorms or not. Initially, the original satellite image of clouds is taken as the input image for the experimentation. As the input image is a satellite image, it may restrain with different type of noises such as striping noise, speckle noise, blurs and so on which are ought to be removed. It may also contains various textures such as water bodies, forests, grass, asphalt, barren lands, concrete, clouds and so on. If the satellite image containing such types of noises and textures are analyzed, the result obtained may deviate from original value.
So, the input image must be segmented. The thunderstorm identification methodology developed in this paper comprises of four stages:
Available Online at www.ijpret.com 263 the original image. Clustering is an efficient technique to segment the input image into several clusters based on similarity measure, here Euclidean distance is used as one of the similarity metric. Here, Segmentation is performed to image by based on various color factors because colors possess wavelength values. The image containing relatively similar wavelength values are grouped into different clusters.
In the second stage, Haar wavelet transform [15-17] is adopted to acquire square root balance sparsity norm threshold value for the feature extracted image.
The soft threshold expression is shown in equation (1).
For the determination of threshold values, equation
(2) is used In the third stage, the obtained threshold value is multiplied by wavelength factor to compute a wavelength range of the required image and this range should lie in between 380nm-750nm [14].
Available Online at www.ijpret.com 265 III. EXPERIMENTATION
In our study, the satellite images obtained from Indian Meteorological Department is analyzed to identify the presence of thunderstorms within the clouds. On analysis of these satellite images using MATLAB, a square root balance sparsity norm threshold value should be computed and is established to be in between an optimal range of 9 - 11. As satellite image is a visible spectrum, its wavelength value always lies in the range of 380nm-750nm [14]. Based on this criterion, the wavelength range for the feature extracted images should be tested and on observation of these results, a range of 380nm-480nm is established for the clouds containing thunderstorms.
IV. CONCLUSION
Predicting thunderstorms is a very critical task. Various studies are been carried out related to this. We have here technique of k-means clustering and haar wavelets for predicting thunderstorms by using real time satellite images. So by analyzing these images from their wavelength, that is if the wavelength is in between the range of 350 nm and 450 nm, we can conclude that there is a thunderstorm otherwise no thunderstorm.
REFERENCES
1. Himadri Chakrabarty, Murthy, C. A., Sonia Bhattacharya and Ashis Das Gupta, “Application of Artificial Neural Network to Predict Squall-Thunderstorms Using RAWIND Data,” International Journal of Scientific and Engineering Research, 2013, pp. 1313-1318.
2. Litta, A.J., Sumam Mary Idicula and Naveen Francis C, “Artificial Neural Network Model for the Prediction of Thunderstorms over Kolkata”, International Journal of Computer Applications, 2012, pp.50-55.
3. Harvey Stern, “Using A Knowledge based System to predict Thunderstorms,” Bureau of Meteorology, Australia.
4. Rudolf kaltenbock, Gerhard Diendorfer and Nikolai Dotzek, “Evaluation of Thunderstorm Indices from ECMWF Analyses, Lightning data and Severe Storm reports,” Atmospheric research Journal, Elsevier, 2009, pp. 381-396.
Available Online at www.ijpret.com 266 6. Mahesh Anand, s., Ansupa Dashi, Jagadeesh Kumar, Amit Kesarkar, “Prediction and Classification of Thunderstorms using Artificial Neural Network,” International journal of Engineering,Science and Technology, 2011, pp. 4031-4035.
7. Alwin Haklander, Aarnout Van Delden, “Thunderstorm Predictors and their Forecast Skill for the Netherlands,” Atmospheric Research,Elsevier, 2003, pp. 273-299.
8. Pinto, “The Sensitivity of The Thunderstorm Activity in the city of Sao paulo to temperature Changes: predicting the Future Activity for Different Scenarios,” International Lightning Detection Conference,2012, pp. 1-4.
9. Alan czarnetzki, C., “Evaluation of a Forecast strategy for Nocturnal Thunderstorms that Produce heavy rain,”pp. 25-31.
10. David Bright, R., Matthew Wandishin, S., Ryan Jewell, E., and Steven Weiss, j., “A Physically Based Parameter for Lightning Prediction and its Calibration in Ensemble Forecasts,” Confeerence on Meteorological Applications of Lightning Data, AMS, 2005,pp. 1-11.
11.Ken Harding, “Thunderstorm Formation and Aviation Hazards,”NOAA’s National Weather Service, pp. 14
12. Bill Nisley, “Thunderstorm Anatomy and Dynamics,”Naval Postgraduate School, california, 1999, pp. 1-13.
13. Anisha Ravinder, P., Prudhvi Kumar Reddy, K., Narasimha Prasad L.V., “Detection of Wavelengths for Hail Identification Using Satellite Imagery of Clouds,”IEEE CICSYN, 2013, pp. 205 – 211.
14.http://en.wikipedia.org/wiki/Visible_spectrum
15.Kanwaljot Singh Sidhu, Baljeet Singh Khaira, Ishpreet Singh Virk, “Medical Image Denoising In The Wavelet Domain Using Haar and DB3 Filtering,” International Refereed Journal of Engineering andScience, 2012, pp1-. 8.
16. Yang Qiang, “Image denoising based on Haar wavelet transform,”IEEE Internatonal conference on Electronics and Optoelectronics,2011, pp. 129-132.
17.Candra Dewi, Mega Satya Ciptaningrun, Nmuh Arif Rahman, “Denoising Cloud Interference