ISSN: 1942-9703 / CC BY-NC-ND
Abstract— Distributed Denial of Service attack (DDoS) is a critical current security attack. Application layer DDoS attacks consume less bandwidth and are hard to detect. This paper studies the unique characteristics of such attack and identifies the main highlighted parameters of the protocols accompanying in every layer seven attacks. The parameter such as HTTP count, IP density during a small time window, constant mapping of random source port to a regular destination port and frame length have been identified. Their possible combination formed the dataset of the classification model. In our paper, we classify the incoming packets as either attack category or normal category based on the input attribute set. We take up the DDoS attack dataset of CAIDA, EPA-HTTP dataset to study the characteristics of the protocols considered. These attribute set are then tested against the well known statistical classifiers to compare their accuracy rate, sensitivity, specificity and time for classification. The experimental results of some of the classification algorithms using the proposed dataset have been presented in the paper for its viability and usability.
Index Terms— Active attack, Application Layer Attack, Classifiers, Denial of Service, Distributed Denial of Service
I. INTRODUCTION
LL human being irrespective of the profession now a day depends on the Internet for data sharing and management. Our world becomes smaller and transparent due to availability and uses of Internet services. Daily activities that range from ticket reservation, online transaction, E-commerce, shopping, education relay on the Internet. These are some of the positive sides of the Internet, but when some section of the people manipulates such a useful application of Internet, then havoc in the society raises. Of all the recent and powerful
Manuscript received March 22, 2017.
Khundrakpam Johnson Singh is with the National Institute of Technology, Durgapur, West Bengal, India (e-mail: [email protected] ).
Usham Sanjota Chanu is with National Institute of Electronics & Information Technology, Manipur, Imphal, India (e-mail: [email protected])
Tanmay De is with National Institute of Technology, Durgapur, West Bengal, India (e-mail: [email protected])
mechanism for causing Internet-related havoc in the society is that by the Distributed Denial of Service attack (DDoS). DDoS attack is defined as the cooperative efforts of Denial of Service Attack (DoS) from different unauthorized users sometimes automated malicious machine call bots residing at the different geographical location with a common goal to bring down a server to a complete hold [1]. These attacks try to flood the server with unwanted traffic thereby further denying services to benign clients. DDoS attacks mainly fall in two categories network layer attack and application layer attack [2]. Network layer DDoS attack sends invalid traffic thereby causing the huge volume of traffic at the server end. IP spoofing is a primary mechanism in this type of attack category. Whereas application layer DDoS attack uses genuine request to flood the victim server through legitimate TCP connection.
Fig.1(a):During Attack
Fig.1(b):During Normalcy
Analysis of Application Layer DDoS Attack
Detection Parameters Using Statistical
Classifiers
Khundrakpam Johnson Singh and Tanmay De, Member, IEEE
In this category, the attacker uses the application layer protocols such as HTTP or Domain Name Services (DNS) [3]. DDoS attacks are stronger than the DoS Attack on Wireless LAN (WLAN) [4] and clouds security [5]. The common motives of the DDoS attack are mainly for economic gain, ransom, enmity, competition, hatred, etc. The illustration during an attack scenario and a normal scenario using HTTP protocol is shown in Fig. 1(a) and 1(b) respectively.
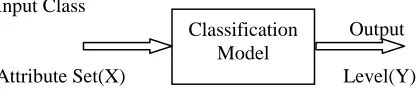
In this paper, we classify the dataset into either attack or normal class using statistical classifiers. Statistical Classification is the task of assigning objects to one of the several predefined categories based on quantitative information on one or more characteristics inherent in the object and based on a training set of previously classified objects. The field of classification ranges from detecting spam emails based on message header and payload to even the classification of galaxies based on their size. The basic block diagram for classification is illustrated in the Fig. 2.
Input Class
Output
Attribute Set(X) Level(Y)
Fig. 2. A basic classification model
The input data for the classification is a collection of records. Each record is a set of the tuple (X, Y), where X is the set of attribute and Y is the category of the class ( attack class or normal class). The attribute set consists of the properties of an attack such as the number of HTTP count for a particular IP address, the density of an IP address within a small time window, constant mapping of random source ports to a specific constant destination port and length of the protocol. The classification technique suited for predicting data sets with the binary or nominal category.
The classification model makes use of a learning algorithm to identify a model that best fits the relation between attribute sets and the type of the class (learn model). The training sets consist of a collection of records whose category of classes are known and are used to build a classification model. The generated classification model is then applied to test set that consist of records with the unknown class category.
We create the training datasets from the DDoS attack dataset available at CAIDA [6], EPA-HTTP DDoS datasets [7] and experimentally generated DDoS datasets. From these datasets, we performed feature extraction and formed a record that consists of the set of attributes. In this paper, we employ the extracted attributes into the classification models like Naïve Bayes, Multilayer Perceptron, RBF network and Voted Perceptron available in Weka 3.6.6. We compare the accuracy rate of correctly identifying a class category, Sensitivity (True Positive rate), Specificity (True Negative Rate) of each classifier with variation in the input sample size.
DDoS attacks are a type of active attack; such attacks are difficult to prevent because of the variations of potential physical, software, and network vulnerabilities. Instead, the
goal is to detect active attacks and to recover from any disruption or delays caused by them.
The rest of the paper is organized as follows. Section II provides related works. Section III provides the feature extraction. Section IV describes classification models. We discussed the experimental results and discussion in Section V. Finally; we present the concluding remarks in Section VI.
II. RELATED WORKS
Some Researchers make use of the packet headers information to calculate Hartley entropy, Shannon entropy, Renyi’s entropy, generalized entropy, Kullback–Leibler divergence [8]. They make use of these estimated entropy to measure their ability to detect both low rate and high rate DDoS attacks. The above-selected metrics are used to provide characteristics of network traffic data and also provide building an efficient model to detect both low-rate and high-rate DDoS attacks. To illustrate the efficiency and effectiveness of the selected metrics, the researchers use the already available datasets of MIT Lincoln Laboratory, CAIDA and TUIDS DDoS datasets. A scheme known as Connection Score [2] was introduced where a server measures different statistical metrics during the normal condition. The server then considers the measured statistical parameters as a reference profile and uses it during the attack time as a benchmark. Attributes such as Request rate and download rate, Uptime and downtime, browsing behavior, Source IP address distribution and Arrival distribution rate of users are considered to calculate the behavior of the users. The server assigns scores to connections based on the reference point. The connections that get lower scores have higher chances to be an attacker.
Researchers proposed an enhanced detection model using traffic matrix [9] where traffic pattern is set up by capturing inbound traffic stream. Furthermore, researchers use Genetic Algorithm for Optimization of parameters used in traffic model. The detection parameters consist of matrix size, packet based window size instead of time-based window size to reduced computational overheads and a new hash functions to avoid hash collisions, and a threshold value, T. They decide whether inbound traffic is an attack or normal by comparing the computed variance and threshold value set by the GA. Researchers carried out their experiments on not only a LBL-PKT-4 dataset but also using a DARPA 2000 LLDOS. Finally, researchers assure that their detection model can maximize the detection rates by optimizing parameters through GA according to the corresponding network infrastructure. Due to the vulnerable architecture of TCP/IP protocol, DDoS attacks are possible where a packet is routed without verifying its source address. Defense against DDoS attacks lies not only in preventive measures but also in identifying the actual origin of the attacks to block further attacks and assist the mitigation process.
As a solution to those, three phases is considered to defense DDoS attack, i.e., prevention and preemption; detection and filtering; and trace back and identification [10]. During an attack, identification of attack source and attack path is done Classification
ISSN: 1942-9703 / CC BY-NC-ND (IP traceback) and even continues after the termination of
attack. IP traceback and post-attack analysis of traffic help in reducing the possibility of future attacks by revealing the compromised systems and sometimes the actual attacker. Researchers analyzed different IP traceback approaches, their functional classes and IP traceback metrics. They are classified based on the collection of trace information and differ in their deployment strategies, storage requirements, and information collecting algorithms. The issues and challenges faced by IP traceback are that it terminates at the entry points unable to proceeds further process beyond firewalls or private networks without their co-operation.
Knowing only the entry points doesn’t resolve the issues of traceback as the trace system might itself contain an enormous number of compromised systems acting as sleeper cells for future attacks but provides some support to filter out possibilities of future attacks. With the rise in threat of DDoS attacks on the Internet, researchers developed a currency-based DDoS mitigation solution [11] that considers that sender to certify her legitimacy needs to utilize resources like computational cost, bandwidth, prior knowledge, human action and money. Apart from this, researchers proposed credit-based accounting mechanism.
An overspread based DDoS mitigation system, called over court is introduced, where clients serve different communication channel with different credit points. The path is fixed through the tunnel to migrate the traffic path of a well-behaving client from the Non-VIP channel to secure VIP channel. Credit Router records the credit points of each customer and makes decisions of path migration. They adopt one-hop splicer that splices two virtual links together at a single intermediary.
The fundamental of the credit-based system are to uplift well-behaving clients and to penalize ill-well-behaving customers. Attacks including un-spoofed and spoofed DDoS attacks are also prevented by over court.
III. FEATURE EXTRACTION
Feature extraction is an important stage in classification, and it directly impact on the prediction of accuracy. A typical example of a weblog record looks like:
191.213.11.102 [29:23:53:25] "GET /Software.html HTTP/1.0" 200 1497 or in some cases looks like:
147.10.10.21 -- [11/Aug/2009:15:53:06 -0700] "GET /apache_pb.gif HTTP/1.0" 200 2026
Such a record consist of the information of the IP address, date, month, year, timing (Hour: Minute: Second), time zone, request line from the client, protocol, success status, data in bytes transported to the customer and sometimes information about the browser and operating system, etc.
All the above information is not required to form the attribute set for classification. Before discussing the classification model, we consider the input attributes. The output is a classification of either an attack category or a normal class. After studying the DDoS attack datasets in CAIDA,
HTTP-EPA dataset and experimentally generated DDoS attack we identify the characteristics of the four parameters of the IP headers. The four parameters consist of Number of HTTP count, Density of the IP addresses within a small time window, constant mapping of port number from random source ports to a constant destination port number and the length of a frame sent.
A. Parameter 1: HTTP GET Request Count
HTTP has various parameters to perform specific tasks. In the paper, we consider GET parameter of HTTP. It is observed from the attack dataset of EPA-HTTP that during the attack phase, there is an enormous amount of HTTP GET request from various clients to the target server. It is also observed that during a mild attack, the number of HTTP GET request from individual clients’ increases to overwhelm the server. However, during normalcy, the number of HTTP GET request per unique IP address is less than 35. In this paper, we use Wireshark version 1.12.4 to capture and analyze the logs provided by the dataset.
B. Parameter 2: Number of Clients within a Time Window
It refers to the number of clients’ IP address accessing the target web server. In the paper, we consider a time window of 20 sec to calculate the number of clients sending HTTP GET request to the victim server. It is observed that the number clients accessing the web server during an attack phase are high [12].
The higher the number of clients accessing the web server within a limited time, the quicker the exhaustion of server resources. During normalcy other than flash events, the number of clients accessing the web server within a small window of 20 sec is low. The analysis of number of clients within 20 sec time window using the dataset is given in Fig. 3.
Fig. 3. Number of clients in an attack case within 20 sec time window
C. Parameter 3: Source Port to Destination Port Mapping
number from the clients but a constant port number of the target server. During normalcy, the client’s port number rarely changes and also made connections with a different port number of the web server. In the case of a Slowloris attack on an Apache web server, the port number of the attacker linearly increases by 1 and made the connection with port number 443 of the web server. If the client exhibits a constant mapping then the present parameter value (Pvalue) is set to 1, otherwise we set it to 0.
D. Parameter 4: Frame Length
It refers to the size of the frame transmitted in a single connection between the client and the server. The analyzed dataset shows that there is constant frame length from a particular client to a web server in an attack phase. However, different clients have variations in the length of the frame transmitted. In normalcy, there is variation in length of frames transferred to from a client to the web server. If a frame length is constant for a client during a time period (20sec), we set the Pvalue to 1else we set it to 0.
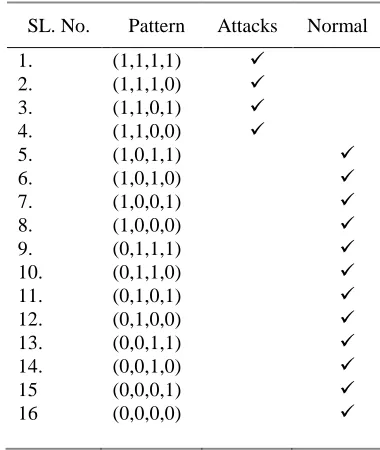
E. Pattern Construction
The value of a single parameter alone could not identify the attack and the normal scenario. Thus a combination of the above four parameters is formed into 24 i.e. 16 possible combinations and analyze whether a particular combination value put the corresponding IP address on the level of an attack, or normal. To make the training and the testing process easier, for the first two parameters we assign 1 for the high value and 0 for the low value of the selected parameter. To assign 1 or 0 to the parameters we calculate a threshold value (Tvalue) for each parameter. The assignment of the 0 and 1 for parameter 1 and 2 is shown in the code snippet below. The four parameters are taken in the order given below:
(parameter1, parameter2, parameter3, parameter4)
Table I provides the assignment of 1/0 of the four parameters as in the above given order.
BEGIN
FOR each parameters
Compute the threshold value, Tvalue
Compute the current parameter value, Pvalue
IF (Pvalue<Tvalue) Pvalue=0; ELSE Pvalue=1; END IF END FOR
END
IV. CLASSIFICATION MODELS
The statistical classifiers have various models; among them are the Naive Bayes, Multilayer perceptron (MLP), RBF Network, Voted Perceptron, etc.
TABLEI
POSSIBLEPATTERNOFTHEFOURPARAMETERS
A. Naive Bayes Classifier
Naive Bayes [13] is a probabilistic learning supervised algorithm that uses Bayes theorem. It uses the concept of prior events to predict the future outcomes. In the paper, the prior probability is calculated by considering the number of attack and normal IP addresses out of the total number of clients in the given dataset. Likelihood of an IP address to be in either an attack class or normal class is given by taking the number of IP addresses that belong to a particular class and lies in the vicinity of a point considered out of the number of IP addresses that belong to a class under consideration.
Finally, the posterior probability of an IP address being either in attack or normal class is given by the multiplication of prior probability and the likelihood of the considered class.
Using the model we calculate the confusion matrix for the given dataset given in Table II. Confusion matrix is a supervised machine learning field to visualize the performance of the algorithm used in the classification. Each column of the matrix provides the instances in a predicted category and each row provides the instances in an actual category.
TABLEII
CONFUSIONMATRIXFORNAIVEBAYES SL. No. Pattern Attacks Normal
1. (1,1,1,1)
2. (1,1,1,0)
3. (1,1,0,1)
4. (1,1,0,0)
5. (1,0,1,1)
6. (1,0,1,0)
7. (1,0,0,1)
8. (1,0,0,0)
9. (0,1,1,1)
10. (0,1,1,0)
11. (0,1,0,1)
12. (0,1,0,0)
13. (0,0,1,1)
14. (0,0,1,0)
15 16
(0,0,0,1) (0,0,0,0)
Actual
Predicted
Positive Negative
Positive 211(a) 60(b)
ISSN: 1942-9703 / CC BY-NC-ND B. Multilayer Perceptron
The neural network that we used is the Multilayer perceptron (MLP) [14]. The structure of the neural network is given in Fig. 4. The network contains three layers: input, hidden and output. The layers are connected by synaptic weights.
In the MLP model, the size of each input pattern is 4. The number of Hidden Neuron is 3. The number of Output neuron is 1.
Fig.4. Multilayer Perceptron Model
The input layer consists of the combination of parameter 1, parameter 2, parameter 3 and parameter 4 which is an attribute to the input layer.
The learning of the network is realized by back-propagation (BP) algorithm. The BP algorithm is based on the error-correction principle. The parameters that are used during the learning process are given:
xi: The ith input
yj: The output of the jth hidden neuron ok: The output of the k
th
output neuron dk: The desired output
vij: The weight from the ith input to the jth hidden neuron wjk: The weight from the j
th
hidden neuron to the kth output neuron
η: The learning rate
There are I inputs, J hidden neurons and K output neurons. The weights of the hidden layer is updated using equation (1)
vij(η+1)=vij(η)+η*δj(η)*xi(η) (1)
Where δj is the error signal produced by the jth hidden neuron. The weights of the output layer is updated using equation (2) wjk(η+1)=wjk(η)+η*δk(η)*yj(η) (2)
Where δk is the error signal produced by the k th
output neuron. δk(η+1)=(dk-ok)*(1-ok)*ok (3)
Using δk , from equation (3) we can calculate as follows δ'j = ∑
K
k=0 δk*wjk (4) δj=(1-yj)*yj*δ’j (5)
So, for any input, we find the output of the hidden neurons, and then the output of the output layer neurons. The outputs in each layer are computed using the sigmoid function. The weights of each hidden and output layer neurons are updated using the above equations (4) (5). The error signals of the hidden neurons are back propagated from the output layer to the hidden layer. This process is repeated for the next input-output pattern and so on until the error is below a pre specified
threshold. We used the minimization of the squared error cost function as in equation (6)
E=½∑Kk=0(dk-ok)2 (6)
In weka 3.6, the learning rate for MLP with BP should be between 0 and 1; by default the learning rate is set to 0.3. The momentum rate for MLP with BP is between 0 and 1; by default it is set to 0.2.
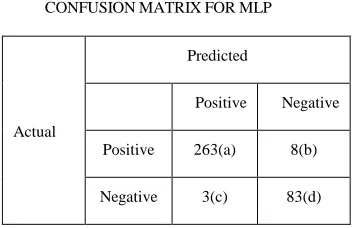
We compute the confusion matrix for MLP with the same dataset as shown in Table III.
TABLEIII
CONFUSIONMATRIXFORMLP
Similarly we compute the confusion matrix for Radial Basis Function Network (RBF Network) [15] in Table IV, Voted Perceptron [16] in Table V respectively. RBNF Network uses the concept of function approximation. It make use of two layer feed forward network. The hidden nodes implements a set of radial basis function and the output node make use of linear summation function (like MLP).
TABLEIV
CONFUSIONMATRIXFORRBFNETWORK
TABLEV
CONFUSIONMATRIXFORVOTEDPERCEPTRON
Actual
Predicted
Positive Negative
Positive 263(a) 8(b)
Negative 3(c) 83(d)
Actual
Predicted
Positive Negetive
Positive 251(a) 20b)
Negative 17(c) 69(d)
Actual
Predicted
Positive Negetive
Positive 271(a) 0b)
From the computed confusion matrix of each classifier we carry out a comparison of the classifiers in terms of accuracy, sensitivity, specificity and time to build model as shown in Table VI. The Accuracy, sensitivity and specificity are given by equation (7), (8) and (9) respectively.
The corresponding values of a, b, c and d are taken from their respective confusion matrix.
Accuracy = (a+d)/(a+b+c+d) (7) Sensitivity = a/(a+b) (8) Specificity = d/(c+d) (9)
TABLEVI
COMPARISONOFTHEFOURMODELS
Models Accuracy Sensitivity Specificity False Positive (FP) Naive Bayes 82.19 0.829 0.58 0.221
MLP 96.92 0.969 0.912 0.029
RBF Network 89.64 0.896 0.775 0.073
Voted Perceptron 75.91 0.759 0 0
V. EXPERIMENTAL RESULT AND DISCUSSION
For the experimental evaluation, we obtain the ROC (Receiver Operating Characteristics) curve for each classification model using Weka 3.6. We set the cross-validation to 10 folds. The ROC curve is a plot of true positive rate against the false positive rate. Characteristics are analyzed according to the following rules:
1. The closer the curve towards the left border and towards top borders of the ROC space, the more accurate the test.
2. The closer the curve towards the 45 degrees diagonal to the ROC curve, the less precise is the test.
From the ROC curve in Fig. 5, Fig. 6 and Fig. 7, we conclude that the ROC curve of the MLP satisfies the ROC curve characteristics to be the best classifier for accurately classifying class category.
Even though the classification models have better accuracy rate but these models must be tested for their False Positive rate (FP). A good classification model must have least FP rate. We calculate the FP rate of the four models using equation (10). The comparisons are depicted in Table VII.
FP= b/(a+b) (10)
TABLE VII FPCOMPARISON
Models
Naive
Bayes MLP RBF
Network
Voted Perceptron
FP 0.221 0.029 0.073 0
It is observed from Table VII that Voted Perceptron have the lowest FP value compared to other three models. However from Table VI, we observed that the accuracy rate of Voted Perceptron is only 75.91. As a result we select MLP classification model with the accuracy of 96.92 and FP of 0.029.
The four models are compared in terms of margin curve. Margin curve refers to the difference in the probability of the actual class predicted with the highest probability predicted for the other class. Fig.8, 9, 10 and 11 analyzes the margin curve for the four models. The MLP have better margin curve then the rest of three models.
We compare the selected four classification models in a lower threshold value to analyze which statistical classification model provides best threshold curve.
For this, we plot the models by considering sample size as X-axis and True Positive rate as the Y-Axis. The generated graph is shown in Fig.12. In Fig.12, the zoomed portion indicates the clear distribution of the four models.
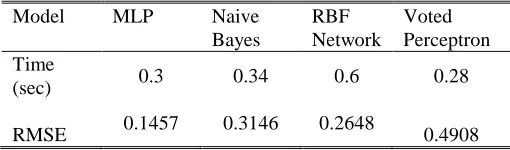
From the graph, it is seen that MLP classification model provides better threshold curve which means that the rate of prediction probability of positive is higher than the rest three models. We finally compare the four models in terms of time taken for classification in a sample size of 357 web accessing clients. To find the difference between the values predicted by the classification model and the observed values, we calculate the Root Mean Square Error (RMSE) of the four models. Table VIII provides the comparison results of the four classification models in terms of time taken and RMSE. It is observed that MLP classification model takes lesser time in predicting the classes with lower RMSE value.
TABLE VIII
TIME AND RMSE COMPARISON
Model MLP Naive
Bayes
RBF Network
Voted Perceptron Time
(sec) 0.3 0.34 0.6 0.28
RMSE 0.1457 0.3146 0.2648 0.4908
ISSN: 1942-9703 / CC BY-NC-ND
Fig. 5. ROC curve comparison Naïve Bayes with MLP Fig. 6. ROC curve comparison RBFNetwork with MLP
Fig. 7. ROC curve comparison VotePerceptron with MLP
Fig.8. Margin curve of Naive Bayes model Fig.9. Margin Curve of RBF Network model
VI. CONCLUSION
Application layer DDoS attack are hard to be ignored by present firewall system as they make use of genuine protocols. It is not easy to achieve 100% accuracy in detecting or classifying application layer DDoS attack. In our approach, we formed the attribute sets using the four parameters of the IP. For any possible combination of the parameters, we countercheck the effect on the testing web server (Apache web server). The combination of the four parameters successfully forms the input attribute and efficiently provides the class category for the new test dataset. Out of the multiple classification models used against the attribute of entry set, we found that Multilayer Perceptron provided an efficiency of 96.92% in classifying a class category and a low False Positive rate of 2.9%. In future, the work can be extended in analyzing the class and add more class like that of a suspect that has fifty-fifty chance of acting as an attack or normal clients. The work can be also extended in comparing the MLP classification models with other online attack datasets available.
ACKNOWLEDGEMENT
The author would like to thank the anonymous referees, reviewers and editors for their valuable comments and their feedbacks for better improvement of the paper.
REFERENCES
[1] Steve McGregory, 2013, “Preparing for the next DDoS attack”, Network Security, 2013(5), pp. 5-6.
[2] Hakem Beitollahi, Geert Deconinck, 2012, “Tackling Application-layer DDoS Attacks”, Procedia Computer Science, pp. 432-441.
[3] Samanesh Rastegari, M.Iqubal Saripan, Mohd Fadlee A.Rasid, 2010, “Defending Denial of Service Attacks against Domain Name System with Machine Learning Techniques”, IAENG International Journal of Computer Science Issues, Vol. 37.
[4] Chibiao Liu, James Yu,, 2007 “A Solution to WLAN Authentication and Association DoS Attacks”, IAENG International Journal of Computer Science Issues, Vol. 34. [5] Mansaf Alam, Kashish Ara Shakil, Mohd.Salman Javed, Manzoor Ansari and Ambreen, 2015 “Detect and Filter Traffic Attack through Cloud Trace back and Neural Network” Proceedings of the World Congress on
Engineering, London, U.K., pp. 535-540
[6] The CAIDA UCSD "DDoS Attack 2007" Dataset
http://www.caida.org/data/passive/ddos-20070804_dataset.xml. Accessed on May 20, 2015.
[7] Laura Bottomley, EPA-HTTP - a day of HTTP logs from a busy WWW server available at
http://ita.ee.lbl.gov/html/contrib/EPA-HTTP.html, August 1995. Accessed on February 2015.
ISSN: 1942-9703 / CC BY-NC-ND rate and high-rate DDoS attack detection”, Pattern Recognition
Letters, Vol. 51, pp. 1-7.
[9] Sang Min Lee, Dong Seong Kim, Je Hak Lee, Jong Sou Park, 2012, “Detection of DDoS attacks using optimized traffic matrix”, Computers & Mathematics with Applications, 63(2), pp.501-510.
[10] Karanpreet Singh, Paramvir Singh, Krishan Kumar, 2016, “A systematic review of IP traceback schemes for denial of service attacks”, Computers & Security, Vol. 51, pp. 111-139. [11] Ping Du, Akihiro Nakao, 2010, “OverCourt: DDoS mitigation through credit-based traffic segregation and path migration”, Computer Communications, 33(18), pp. 2164-2175.
[12] Sung-ju Kim, Byung-chul Kim, Jae-yong Lee, Chan-kyou Hwang and Jae-jin Lee, 2008, “Rule-based Defense Mechanism against Distributed Denial-of-Service Attacks” Proceedings of the World Congress on Engineering, London, U.K., pp 543-548.
[13] Sotiris Kotsiantis, 2014, “Integrating Global and Local Application of Naive Bayes Classifier”, The International Arab Journal of Information Technology, 11(3).
[14] Jing Yang, Xiaoqin Zeng, Shuiming Zhong, 2013, “Computation of multilayer perceptron sensitivity to input perturbation”, Neurocomputing, Vol. 99, pp. 390-398.
[15] Turker Ince, Serkan Kiranyaz, Moncef Gabbouj, 2012, “Evolutionary RBF classifier for polarimetric SAR images”, Expert Systems with Applications, 39(5), pp. 4710-4717. [16] Yoav Freund and Robert E.Schapire, 1999, “Large Margin Classification Using the Perceptron Algorithm”, Mach. Learn. 37(3), pp.277-296.
Khundrakpam Johnson Singh receives his bachelor of engineering degree in Computer Science and Engineering from KBNCE, Gulbarga, Karnataka, in 2010. He completed his master of technology degree in Computer Science and Engineering from Dayananda Sagar College of Engineering, Bangalore, Karnataka, in 2012. He is currently pursuing Ph.D degree in Computer Science and Engineering at National Institute of Technology, Durgapur, West Bengal. He is interested in carrying out the research work in server security.