www.biogeosciences.net/9/2961/2012/ doi:10.5194/bg-9-2961-2012
© Author(s) 2012. CC Attribution 3.0 License.
Biogeosciences
Fine-scale variability in methanol uptake and oxidation:
from the microlayer to 1000 m
J. L. Dixon and P. D. Nightingale
Plymouth Marine Laboratory, Prospect Place, West Hoe, Plymouth, Devon, PL1 3DH, UK
Correspondence to: J. L. Dixon ([email protected])
Received: 22 March 2012 – Published in Biogeosciences Discuss.: 16 April 2012 Revised: 19 June 2012 – Accepted: 30 June 2012 – Published: 6 August 2012
Abstract. The aim of this research was to make the first
depth profiles of the microbial assimilation of methanol car-bon and its oxidation to carcar-bon dioxide and use as an en-ergy source from the microlayer to 1000 m. Some of the highest reported methanol oxidation rate constants of 0.5– 0.6 d−1were occasionally found in the microlayer and imme-diately underlying waters (10 cm depth), albeit these samples also showed the greatest heterogeneity compared to other depths down to 1000 m. Methanol uptake into the particu-late phase was exceptionally low in microlayer samples, sug-gesting that any methanol utilised by microbes in this envi-ronment is for energy generation. The sea surface microlayer and 10 cm depth also showed a higher proportion of bacteria with a low DNA content, and bacterial leucine uptake rates in surface microlayer samples were either less than or the same as those in the underlying 10 cm layer. The average methanol oxidation and particulate rates were however sta-tistically the same throughout the depths sampled, although the latter were highly variable in the near-surface 0.25–2 m compared to deeper depths. The statistically significant rela-tionship demonstrated between uptake of methanol into par-ticles and bacterial leucine incorporation suggests that many heterotrophic bacteria could be using methanol carbon for cellular growth. On average, methanol bacterial growth ef-ficiency (BGEm) in the top 25 m of the water column is 6 % and decreases with depth. Although, for microlayer and 10 cm-depth samples, BGEm is less than the near-surface 25–217 cm, possibly reflecting increased environmental UV stress resulting in increased maintenance costs, i.e. energy required for survival. We conclude that microbial methanol uptake rates, i.e. loss from seawater, are highly variable, par-ticularly close to the seawater surface, which could signif-icantly impact upon seawater concentrations and hence the air–sea flux.
1 Introduction
McDonald, 2000; Chistoserdova, 2011). Biological methanol turnover times as low as 1 day have been found in sur-face waters of the subtropical northeast Atlantic (Dixon et al., 2011a). Molecular approaches have identified methy-lotrophs like Hyphomicrobium and Methylophaga spp. in re-mote marine and coastal locations (Dixon et al., 2011b; Neu-field et al., 2007, 2008). Other bacteria, such as undescribed Gammaproteobacteria (Neufield et al., 2007, 2008), have also been found to uptake methanol carbon into their cells. Recently, Sun et al. (2011) also revealed that the most abun-dant heterotrophs in the oceans, SAR11 Alphaproteobacte-ria, who play a major role in mineralising marine-dissolved organic matter, use methanol to produce energy.
Previous results have focussed only on bulk surface wa-ters (5–10 m) and have reported microbial methanol oxida-tion rates between 2–8 nM d−1 in more northern temperate waters (Dixon et al., 2011b) and between 2–146 nM d−1 in oligotrophic tropical waters of the North Atlantic (Dixon et al., 2011a), giving turnover times of between 7–33 and 1–25 days, respectively. The aim of this research was to make the first depth profiles for microbial methanol use as an energy source and a growth substrate. We further profiled the fine-scale variability in these rates in the top 2 m of the water col-umn and the sea surface microlayer to assess whether bulk surface, i.e. 5–10 m measurements, typically used in air– sea flux calculations, were truly representative of the near-surface (<2 m). Temporal and surface spatial changes in mi-crobial methanol use are also compared.
2 Methods
Sampling was conducted at a series of stations west of the Iberian Peninsula in the NE Atlantic aboard RRS Discov-ery on the SOLAS UK (Surface Ocean Lower Atmosphere Study) DOGEE II (Deep Ocean Gas Exchange Experiment II) D320 research cruise (Fig. 1).
2.1 Sampling devices
Ten-litre, Teflon-coated, steel-sprung Niskin bottles were used to routinely sample waters ≥5 m during spatial and depth surveys. High-resolution sampling in the top 2 m was achieved through the use of a Near-surface Sampling Device (N), which consists of eight 4 l sampling bottles mounted horizontally and spaced at 20–30 cm intervals, with the top bottle at 25 cm below the sea surface and the bottom one at 220 cm (as described in Tilstone et al., 2010). An additional microlayer sampling device that was mounted on a Catama-ran (C) was also fitted with a subsurface pole that enabled sampling from 10 cm, 1 and 2 m below the sea surface (as described in Brooks et al., 2009). The sea surface microlayer was also sampled by hand from a rigid inflatable boat using a Garrett Screen (GS, Garrett 1965). Briefly, this screen con-sisted of a 50 cm2frame enclosing a stainless steel mesh and
Figure 1
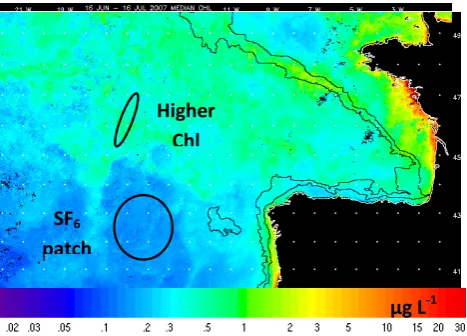
Fig. 1. Sampling areas overlaid on a composite chlorophyll a image (MODIS Aqua) over the duration of the cruise (16 June–16 July 2007).
is typically considered to sample the top 300–400 µm (Cun-liffe et al., 2009; Zuev et al., 2001). Additional 10 cm sam-ples were also taken by hand from the inflatable boat using a 10 ml long-handled pipette. Microlayer samples were also obtained using the Catamaran, as it was fitted with a rotating drum device mounted between the hulls. The rotating glass drum picks up the sea surface by tension, and is thought to typically sample 20–100 µm (Zuev et al., 2001).
2.2 SF6tracer deployment
A diel experiment was undertaken using surface waters that had been labelled with the inert tracer SF6(as used in an air– sea gas transfer experiment detailed in Salter et al., 2011). We used this tracer to check that we were consistently sampling the same body of water during the diel experiment.
2.3 Methanol oxidation and uptake into particulate phase
We incubated surface seawater samples with nanomolar con-centrations of 14C-labelled methanol (14CH3OH) and de-termined both uptake into particles and oxidation to CO2 (Dixon et al., 2011a and b), which we interpret as microbial cellular incorporation (cell growth, G) and energy use (E), re-spectively. For full experimental details please refer to Dixon et al., 2011b. In brief, seawater samples were treated with ap-proximately 10 nM final added concentration of14CH3OH, and were always<1 % of the sample volume. We generally incubated oxidation samples for 1–3 h and uptake onto parti-cles for 3–9 h (to ensure sufficient counts).
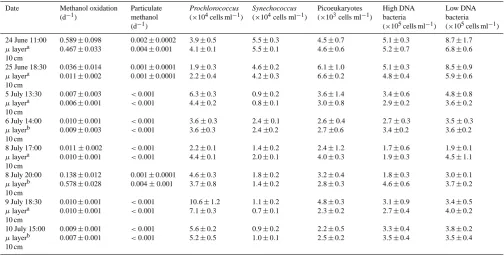
[image:2.595.311.545.63.231.2]Table 1. Summary of methanol uptake and cellular abundance in the microlayer and 10 cm-depth layer in the low chlorophyll a tracer (SF6) patch area. Error bars are based on 2–6 replicates.
Date Methanol oxidation (d−1)
Particulate methanol (d−1)
Prochlorococcus
(×104cells ml−1)
Synechococcus
(×104cells ml−1)
Picoeukaryotes (×103cells ml−1)
High DNA bacteria (×105cells ml−1)
Low DNA bacteria (×105cells ml−1)
24 June 11:00
µlayera 10 cm
0.589±0.098 0.467±0.033
0.002±0.0002 0.004±0.001
3.9±0.5 4.1±0.1
5.5±0.3 5.5±0.1
4.5±0.7 4.6±0.6
5.1±0.3 5.2±0.7
8.7±1.7 6.8±0.6 25 June 18:30
µlayera 10 cm
0.036±0.014 0.011±0.002
0.001±0.0001 0.001±0.0001
1.9±0.3 2.2±0.4
4.6±0.2 4.2±0.3
6.1±1.0 6.6±0.2
5.1±0.3 4.8±0.4
8.5±0.9 5.9±0.6 5 July 13:30
µlayera 10 cm
0.007±0.003 0.006±0.001
<0.001
<0.001
6.3±0.3 4.4±0.2
0.9±0.2 0.8±0.1
3.6±1.4 3.0±0.8
3.4±0.6 2.9±0.2
4.8±0.8 3.6±0.2 6 July 14:00
µlayerb 10 cm
0.010±0.001 0.009±0.003
<0.001
<0.001
3.6±0.3 3.6±0.3
2.4±0.1 2.4±0.2
2.6±0.4 2.7±0.6
2.7±0.3 3.4±0.2
3.5±0.3 3.6±0.2 8 July 17:00
µlayera 10 cm
0.011±0.002 0.010±0.001
<0.001
<0.001
2.2±0.1 4.4±0.1
1.4±0.2 2.0±0.1
2.4±1.2 4.0±0.3
1.7±0.6 1.9±0.3
1.9±0.1 4.5±1.1 8 July 20:00
µlayerb 10 cm
0.138±0.012 0.578±0.028
0.001±0.0001 0.004±0.001
4.6±0.3 3.7±0.8
1.8±0.2 1.4±0.2
3.2±0.4 2.8±0.3
1.8±0.3 4.6±0.6
3.0±0.1 3.7±0.2 9 July 18:30
µlayera 10 cm
0.010±0.001 0.010±0.001
<0.001
<0.001
10.6±1.2 7.1±0.3
1.1±0.2 0.7±0.1
4.8±0.3 2.3±0.2
3.1±0.9 2.7±0.4
3.4±0.5 4.0±0.2 10 July 15:00
µlayerb 10 cm
0.009±0.001 0.007±0.001
<0.001
<0.001
5.6±0.2 5.2±0.5
0.9±0.2 1.0±0.1
2.2±0.5 2.5±0.2
3.3±0.4 3.5±0.4
3.8±0.2 3.5±0.4
aThe microlayer was sampled using a Garrett Screen and 10 cm using a hand pipette from a rib.
bThe microlayer was sampled using a rotating skimmer device and the 10 cm layer using a subsurface pole mounted on a Catamaran.
constants were corrected by subtracting killed sample (TCA, 5 % final concentration) counts. Evaluation of control sam-ples suggests that≤2% of the added14CH3OH is counted in the resultant precipitate (for determining oxidation) and
≤0.3 % is recovered on the filters.
2.4 Bacterial production
Heterotrophic bacterial production rates were determined by measuring the incorporation of3H-leucine (20 nM final con-centration) into bacterial protein synthesis on 1.7 ml seawater samples following the method of Smith and Azam (1992).
2.5 Cellular abundance
The numbers of bacterioplankton cells were determined by flow cytometry on SYBR Green I DNA-stained cells from 1.8 ml seawater samples fixed in paraformaldehyde (5 %, final concentration). Numbers of Prochlorococcus spp. and Synechococcus spp. were analysed on unstained samples by flow cytometry. Surface concentrations of chlorophyll a were estimated using a composite Aqua-MODIS chlorophyll a remotely-sensed image for stations 4 and 5, as unfortunately the continuous surface fluorometer onboard the ship was not working correctly.
3 Results
3.1 The sea surface microlayer and 10 cm
Methanol oxidation rate constants in the sea surface micro-layer were highly variable and on average ranged between 0.006–0.59 d−1 (Table 1). Methanol uptake into the partic-ulate phase in the microlayer showed the lowest-ever rate constants reported, and on average ranged between<0.001– 0.002 d−1 (Table 1). The highest values of uptake were co-incident with the highest methanol oxidation rates. For the majority of sampling occasions there was little difference between methanol rate constants (oxidation and particulate uptake) in the sea surface microlayer and 10 cm depth. The greatest difference in oxidation and uptake rates between the microlayer and 10 cm samples was observed at times of maximum rates, although there was no consistent trend. However, the two highest particulate methanol rate constants were found in the 10 cm-depth samples (not the microlayer). For microlayer samples which were obtained with either the Garrett Screen and/or the Catamaran Skimmer, no consistent differences could be identified for any parameter/rate deter-mined.
Figure 2
Methanol, k (d-1)
0.00 0.02 0.04 0.06 0.08 0.10 0.12
D
ep
th
(c
m
)
0
25
50
75
100
125
150
175
200
225
Oxidation (C) Particulate (C) Particulate (N) 4th July 2007
Methanol, k (d-1)
0.000 0.004 0.008 0.012 0.016
D
ep
th
(c
m
)
0
25
50
75
100
125
150
175
200
225
Oxidation (C) Particulate (C) Oxidation (N) Particulate (N)
Methanol, k (d-1)
0.000 0.004 0.008 0.012 0.016
D
ep
th
(c
m
)
0
25
50
75
100
125
150
175
200
225
Oxidation (C) Particulate (C)
6th July 2007
Methanol, k (d-1)
0.00 0.01 0.02 0.03 0.04 0.05 0.06
D
ep
th
(c
m
)
0
25
50
75
100
125
150
175
200
225
Oxidation (N) Particulate (N) Oxidation (C) Particulate (C)
10th July 2007 8th July 2007
0.0 0.1 0.2 0.3 0.4 0.5
0 25 50 75 100 125 150 175 200 225
Oxidation (N)
(a) (b)
[image:4.595.128.465.63.482.2](c) (d)
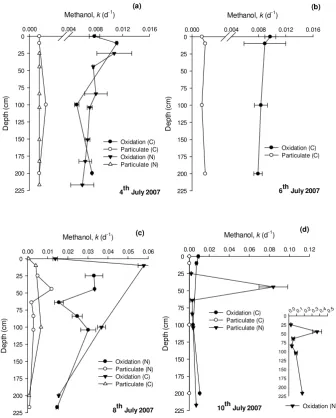
Fig. 2. Fine-scale variability in methanol oxidation and uptake into particles (k)in the top 2m of the water column as sampled by either the Near-surface Sampling Device (N) or the Catamaran (C) for profiles sampled on (a) 4 July, (b) 6 July, (c) 8 July and (d) 10 July 2007. The
error bars represent±1 standard deviation based on at least 3 replicates.
microlayer sample. Numbers of Synechococcus cells ranged between 0.9–5.5×10⁴and 0.7–5.5×10⁴cells ml−1in micro-layer and 10 cm-depth samples, respectively (Table 1), whilst picoeukaryotic cells ranged between 2.2–6.6×10³cells ml−1 (Table 1). In general, cell numbers showed no convincing dif-ferences or trends between microlayer and 10 cm samples.
Bacterial numbers (high and low DNA) ranged between 3.6–13.8×10⁵cells ml−1 and 4.7–12.1×10⁵cells ml−1 in microlayer and 10 cm-depth samples, respectively, and were highest in both during sampling times in June, compared to July (Table 1). However, there was no overall trend in bacte-rial numbers between the microlayer and 10 cm-depth sam-ples. There was however a greater number of bacteria (52– 64 %) containing a relatively low DNA content compared to
a high DNA content (as seen on the Flow Cytometer, Ta-ble 1) for all surface microlayer samples. Bacterial num-bers from 10 cm depth showed more variability in the pro-portion of low DNA-containing bacteria (44–71 %). Corre-lations showed statistically significant reCorre-lationships between both methanol oxidation and uptake into particles with the numbers of low DNA-containing heterotrophic bacteria in the microlayer samples (n=11, r=0.6189,p≤0.05 and
[image:5.595.312.544.64.348.2]
Figure 3
Fig. 3. Variability in bacterial leucine incorporation for microlayer,
10 cm, 1 and 2 m depths, where error bars denote±1 sd based on
three replicates.
3.2 Depth variability in the top 2 m
High depth-resolution sampling in the top 2 m of the wa-ter column often revealed significant differences in both methanol oxidation and uptake into particles between sam-ples that were as little as 25 cm depth apart (Fig. 2), illustrat-ing the heterogenic nature of microbial methanol use. Hot spots or peaks in activity were often seen at depths just be-low the surface≤50 cm, e.g. on 10 July 2007 (Fig. 2d). The average proportion of methanol used for energy compared to growth (E:G) in the top 2 m was 22, in agreement with more traditionally sampled surface (∼5 m) values. However, lower E:G values between 3–10 were sometimes observed between depths of 45–100 cm, e.g. on 8 July 2007 (N profile, Fig. 2c), indicating that on occasion relatively more methanol was used for growth. This ratio was more similar to that ob-served in coastal and shelf sea surface waters (Dixon et al., 2011b).
Bacterial leucine incorporation was also compared in surface microlayer (1–32 pmol l−1h−1), 10 cm (3– 34 pmol l−1h−1), 1 m (4–39 pmol l−1h−1), and 2 m (5– 20 pmol l−1h−1) depths (Fig. 3). Surface microlayer samples almost consistently showed values lower than samples from 10–100 cm, except for 4–5 July 2007, which showed no sta-tistically significant differences in the top 2 m.
3.3 Vertical profiles from 5–1000 m
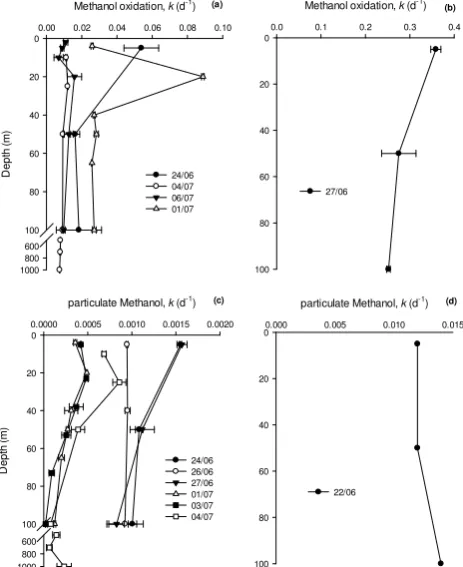
Depth profiles of methanol oxidation and uptake into cells showed considerable changes with depth, sometimes show-ing subsurface maxima between 20–30 m (Fig. 4). However, some of the biggest changes were shown between sampling days. For example, methanol oxidation rates generally var-ied between 0.007–0.09 d−1(Fig. 4a, average 0.02,n=22) between 5–1000 m, but on 27 June 2007 increased by over an order of magnitude to between 0.25–0.36 d−1 (average 0.30,n=3), with a surface maximum. Likewise incorpora-tion of methanol into cells for growth generally varied be-tween<0.001–0.0016 d−1(Fig. 4c, average 0.001,n=28),
Figure 4
Methanol oxidation, k (d-1)
0.00 0.02 0.04 0.06 0.08 0.10
D
ep
th
(m
)
0
20
40
60
80
100 600 800 1000
24/06 04/07 06/07 01/07
Methanol oxidation, k (d-1)
0.0 0.1 0.2 0.3 0.4
0
20
40
60
80
100
27/06
particulate Methanol, k (d-1)
0.0000 0.0005 0.0010 0.0015 0.0020
D
ep
th
(m
)
0
20
40
60
80
100 600 800 1000
24/06 26/06 27/06 01/07 03/07 04/07
particulate Methanol, k (d-1)
0.000 0.005 0.010 0.015 0
20
40
60
80
100
22/06
(a) (b)
(c) (d)
Fig. 4. Depth profiles of apparent rate constants (k)for (a and b) methanol oxidation and (c and d) uptake into the particulate phase.
but was more than one order of magnitude greater on 22 June 2007 with an average of 0.013 d−1(n=3). We do not have methanol oxidation rates on this day to compare with. These sporadic increases in rates are currently not understood. The average E:G over all depths was 106 (n=19, range 14–305), which decreased to an average of 85 (n=9, range 14–229) for samples from the top mixed layer varying between 30– 53 m, which is within the range previously reported (Dixon et al., 2011a and b).
For deep samples collected between 500–1000 m on 1 July 2007, methanol oxidation and uptake into particle rate constants were low and varied between 0.008±0.0002 and 0.0001±0.0001 d−1 (n=3), respectively, with an average energy to growth ratio of 70.
3.4 Diel variability
[image:5.595.50.285.66.194.2]Figure 5
6 8 10 12 14 16 18 20 22 0 2 4 6
M
et
ha
no
l,
k (h
-1 )
0 2 4 6 8 10 12
E
:G
0 10 20 30 40 50 60 particulate x10-5
oxidation x10-4
Ox/part ratio
S
F6
P
ea
k
ar
ea
0 5e+4 1e+5 2e+5 2e+5 3e+5 3e+5
C
el
ls
m
L
-1 o
r p
m
ol
le
u
L
-1 h
-1
2 4 6 8 10 12 14 16 Bacterial numbers x105
Bacterial production
C
el
ls
m
L
-1
0 2 4 6 8
10 Synecococcus x10
3
Prochlorococcus x104
Picoeukaryotes x103
(a)
(b)
(c)
(d)
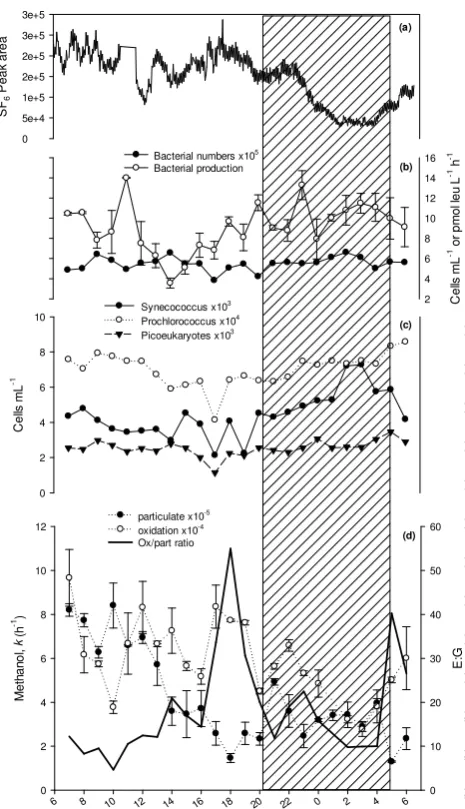
Fig. 5. Diel variability in (a) concentration of inert tracer SF6, (b)
bacterial leucine incorporation and numbers of bacteria, (c) num-bers of Synechococcus, Prochlorococcus and Picoeukaryotes and (d) apparent rate constant (k) of methanol oxidation and uptake into cellular material with the microbial E:G, where the hashed area indi-cates hours of darkness. Error bars are based on at least 3 repliindi-cates.
the latter could have been a result of spatial sampling vari-ability due to station drift. However, there was no consis-tent trend evident for methanol oxidation rates over the diel cycle, unlike microbial uptake of methanol into the particu-late phase, which showed a decreasing trend from 07:00 to 18:00 GMT during daylight hours (Fig. 5d). Methanol cellu-lar incorporation rates were approximately an order of mag-nitude lower than those for microbial methanol energy use, and varied between 1.3–8.4×10⁻⁵h−1. Maximum rates were shown at 10:00 GMT, and minimum rates just before dawn at 05:00 GMT, both 2–3 h after the respective methanol oxida-tion rates. The ratio of methanol used for microbial energy
compared to growth ranged between 5–55 over the diel cy-cle. Two maximums in this ratio were observed almost 12 h apart at 18:00 and 05:00 GMT.
Numbers of heterotrophic bacteria, picoeukaryotes, Prochlorococcus and Synechococcus cells ranged be-tween 3.8–6.6×10⁵, 1.1–3.5×10³, 4.1–8.6×10⁴ and 2.1–7.3×10³cells ml−1, respectively. In general, cell num-bers decreased during the day from 07:00 to a minimum at 17:00 GMT, and subsequently increased during the night (Fig. 5b and c). Bacterial leucine incorporation rates ranged between 3.6–14 pmol leu l−1h−1 and showed no obvious diel trends, although on average rates were slightly higher at night (10.3±1.6 pmol leu l−1h−1) compared to the day (8.4±2.6 pmol leu l−1h−1), although they are not statistically different. Because we suspect from the SF6data (Fig. 3a) that we drifted away from the assumed patch centre during the night, only times sampled during daylight hours (07:00–20:00 GMT, n=14) were included in subsequent statistical analysis. The only statistically significant rela-tionship observed was between the uptake of methanol into cellular biomass and the numbers of Prochlorococcus cells (n=14,r=0.7289,P ≤0.01).
3.5 Surface variability in methanol oxidation
Apparent rate constants for methanol oxidation in surface (5– 10 m) waters of the NE Atlantic ranged from 0.006–0.39 d−1 (average of 0.09 d−1, n=17, Fig. 6). The continuous sur-face fluorometer onboard the ship was not working during the cruise, so we do not have in situ chlorophyll a concentra-tions. However, surface estimates of<0.2 and between 0.3– 0.6 µg l−1 for the SF
6 patch area and higher chlorophyll a sampling regions, respectively, were obtained from a com-posite Aqua-MODIS image over the duration of the cruise from 16 June to 16 July 2007 (Fig. 1). The average methanol oxidation rate constant in the lower chlorophyll a sampling region was 0.065 d−1(n=13), which more than doubled to 0.17 d−1(n=4) in the higher chlorophyll area, although due to the large variability they are not statistically different. Bac-terial leucine uptake ranged over an order of magnitude be-tween 3.8–38.5 pmol l−1h−1(average of 11.6 pmol l−1h−1,
n=16, Fig. 8). Interestingly, some relatively high bacterial leucine activities up to 39 pmol l−1h−1 were found in the lower chlorophyll surface waters. Surface methanol oxida-tion was not statistically related to bacterial leucine incor-poration or the numbers of bacteria (5–107×105cells ml−1), Prochlorococcus (0.7–6.7×10⁴cells ml−1), or Synechococ-cus (0.9–5.9×10⁴cells ml−1).
4 Discussion
[image:6.595.52.285.60.465.2]Figure 6
oN
41.941.941.941.941.942.642.642.642.642.642.743.443.546.346.647.047.4
S ur fa ce m et ha no l o xi da tio n k (d -1) 0.0 0.1 0.2 0.3 0.4 0.5 B ac te ria l p ro du ct io n (p m ol L eu L
-1 h -1) 0 10 20 30 40 50
Fig. 6. (a) Spatial variability in methanol oxidation (apparent rate
constant,k)in surface (2–10 m) waters with corresponding
bacte-rial leucine uptake. The hashed bars indicate methanol oxidation
with surface concentrations<0.2 µg l−1(41–43◦N), and the open
bars chlorophyll a between 0.3–0.6 µg l−1 (46–47◦N). Error bars
are based on at least 3 replicates.
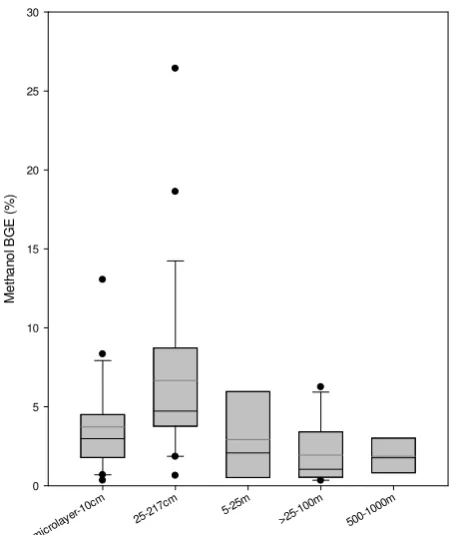
within the ranges previously reported (Dixon et al., 2011a and b), but are higher than those sometimes found in ultra-low chlorophyll a regions (0.003–0.006 µg l−1, 1–5 days) of the tropical North Atlantic (Dixon et al., 2011a). The ma-jority of methanol (92–99.8 %) in surface waters during the spatial survey was used as an energy source rather than a car-bon source for cellular growth, which is typical of more olig-otrophic North Atlantic waters (Dixon et al., 2011a). Bacte-rial growth efficiency for methanol (BGEm=G/(G+E)·100) is summarised as a function of depth in Fig. 8 and suggests that in the top 0.25–25 m of the sunlit part of the water column the average BGEmis approximately 6 % (0.4–26 %), which compares to a BGE of 5±1 % for open-ocean North Atlantic waters (Kirchman et al., 1991), 7±3 % for the Sargasso Sea (Hansell et al, 1995) and between 1–8 % for the Bay of Bis-cay (Gonz´alez et al., 2003). Generally BGEmdecreases with depth, in a similar pattern to that of BGE determined from bacterial production and respiration (e.g. Alonso-S´aez et al., 2007), which is normally considered a consequence of de-creasing bacterial production with depth (e.g. Barbosa et al., 2001) with relatively constant bacterial respiration (del Gior-gio et al., 2011). Although, the mean BGEmfor microlayer– 10 cm samples is less than that from the underlying 25– 217 cm layer, possibly implying that increasing environmen-tal stress, e.g. UV, results in cellular increases in mainte-nance and repair costs, e.g. energy (del Giorgio et al., 2011; del Giorgio and Gasol, 2008; Carlson et al., 2007). Obernos-terer et al. (2005) also reported enhanced community respi-ration rates in the surface microlayer compared to subsurface waters, whilst a depletion in dimethylsulfide at 10 cm depth compared to underlying waters was consistently reported by Zemmelink et al. (2005). Although, high outliers in BGEm of between 8–26 %, due to relatively high rates of methanol incorporated into cellular particulate material, suggest that hot spots of methylotrophic activity exist in the near-surface layers.
Figure 7
Prochlorococus (x105 cell mL-1)
0.0 0.2 0.4 0.6 0.8 1.0 1.2 1.4
pa rti cu la te M et ha no l, k (d -1) 0.000 0.002 0.004 0.006 0.008 0.010 0.012 0.014
Synecococcus (x103 cells mL-1)
0 2 4 6 8 10 12 14 16 18
0.000 0.002 0.004 0.006 0.008 0.010 0.012 0.014 pa rti cu la te M et ha no l, k (d -1) Stn 3 Stn 1 (a) (b)
Bacterial production (pmol leu L-1 d-1)
0 500 1000 1500 2000 2500 3000
pa rti cu la te M et ha no l,
k (d
-1) 0.000 0.002 0.004 0.006 0.008 0.010 0.012 0.014 (c)
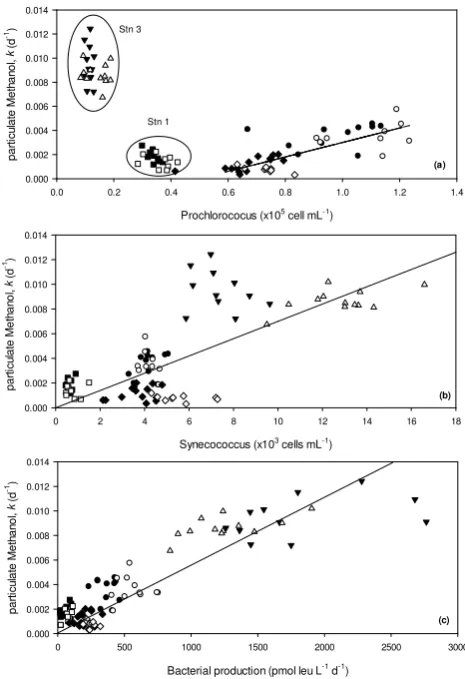
Fig. 7. Apparent rate constants (k) for methanol uptake into the par-ticulate phase as a function of the numbers of (a) Prochlorococcus and (b) Synechococcus cells for four spatially distinct diel
experi-ments carried out in the NE Atlantic (and♦this study,and
station 1,◦and•station 2,Hand4station 3, refer to Table 1),
where solid symbols denote day and open symbols night measure-ments.
Methanol oxidation rate constants from the diel exper-iment in this study are on average two orders of magni-tude lower compared to those in the subtropical NE Atlantic (Dixon et al., 2011a), which may help explain why a tempo-ral trend was not observed. In contrast, uptake into the partic-ulate phase was comparable, particularly between this study and station 1 in the oligotrophic NE Atlantic (see Table 1 and Dixon et al., 2011a). However for particulate diel of this study, rates decreased during the day in a similar fashion to oxidation rates in Dixon et al. (2011a), which at present we do not fully understand.
[image:7.595.310.543.61.401.2] [image:7.595.51.287.63.186.2]Table 2. Summary of diel stations.
Date Location Bacteria Synechococcus Prochlorococcus Bacterial production Chla
(×105cells ml−1) (×103cells ml−1) (×104cells ml−1) (pmol Leu l−1h−1) (µg l−1)
This study 12 July 2007 42.7◦N 16.1◦W 3.8–6.6 2.1–7.3 4.1–8.6 3.6–14 <0.20
Stn 1a 12 Dec 2007 26.1◦N 23.6◦W 2.5–4.0 0.5–1.5 2.8–4.2 0.8–4.7 0.06
Stn 2a 18 Nov 2007 17.7◦N 22.9◦W 6.0–10.3 3.3–5.1 6.7–12.3 9.9–32 0.10
Stn 3a 29 Nov 2007 16.0◦N 23.7◦W 5.0–10.0 5.9–16.6 0.8–1.9 36–118 0.22
aStations from Dixon et al. (2011b).
microla yer-10
cm 25-217
cm 5-25m >25-10
0m 500-10
00m
M
et
ha
no
l B
G
E
(%
)
0 5 10 15 20 25 30
Figure 8
Fig. 8. Methanol bacterial growth efficiency with depth, where the shaded box represents the 25th and 75th percentile, the black line the mean, and the grey line the median growth efficiency. The error
bars show the 10th and 90th percentile and (•) outlying points.
Zubkov and co-workers demonstrated that Prochlorococcus use organic nitrogen compounds, e.g. amino acids (Mary et al., 2008; Zubkov and Tarran, 2005; Zubkov et al., 2003, 2004), whilst sulphur uptake from dimethylsulfoniopropi-onate has also been demonstrated (Vila-Costa et al., 2006). The uptake of glucose by Prochlorococcus has also more re-cently been suggested by G´omez-Baena et al. (2008) as the first example of an organic molecule containing only car-bon skeletons, i.e. no N, P or Fe, being assimilated presum-ably for cellular structures and/or to obtain reducing power. However, the lack of a statistically significant relationship between methanol oxidation rates (rather than uptake) and the numbers of Prochlorococcus suggest that methanol is be-ing utilised for microbial growth and cellular incorporation rather than for energy generation. To test the robustness of
this relationship further, we included the results from three other diel experiments (see Table 2 for data summary) that we have performed in more tropical regions of the north-east Atlantic (Fig. 7a, the methanol data have previously been published in Dixon et al. (2011a) but not in combination with the supporting microbial composition data). When the diel data from the present study are combined with station 2 from the subtropical northeast Atlantic, then a statistically signifi-cant linear relationship is found between methanol used as a carbon source for cellular growth during light and dark hours, i.e. for particulate methanol, and the numbers of Prochloro-coccus cyanobacteria (y=0.006x−0.003, r=0.776, n=
45 forP =0.001, Fig. 7a). However station 1, which is more oligotrophic in nature than station 2 and this study (see Ta-ble 2), has a higher particulate methanol uptake rate than expected from this relationship. This could imply that cells other than Prochlorococcus, e.g. methylotrophs, are donating the uptake of methanol at this station, or perhaps mi-crobial resources are more scarce, leading to enhanced re-liance and uptake of methanol. Station 3 is located within the Cape Verde archipelago and is the most productive of these stations (see chlorophyll a concentrations and bacterial pro-duction in Table 2). It is thus conceivable that methanol up-take in the particulate phase is dominated by very different microbes in this environment, where numbers of Prochloro-coccus cells are very low and picoeukaryotic cells are more evident at 6–15×102cells ml−1. The observed relationship between methanol uptake into particles and the numbers of Synechococcus is shown in Fig. 7b, which shows a broad but shallow gradient positive trend (y=0.0007x+0.0005,
r=0.740,n=87 forP =0.001). There is significant scatter in the data evident, particularly for station 3, which shows a positive deviation from the trend during daylight hours. Per-haps the most convincing relationship, in terms ofr value, is observed between methanol uptake and bacterial produc-tion for all the diel data (Fig. 7c), wherey=6×10⁻⁶x,r=
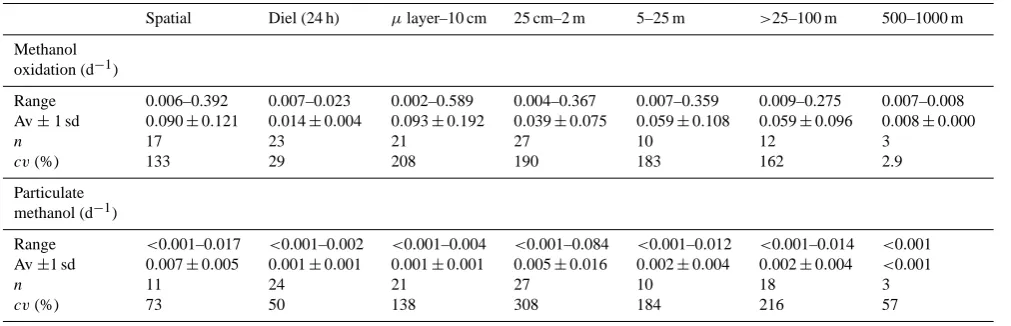
Table 3. Summary of microbial methanol uptake and oxidation.
Spatial Diel (24 h) µlayer–10 cm 25 cm–2 m 5–25 m >25–100 m 500–1000 m
Methanol
oxidation (d−1)
Range
Av±1 sd
n cv(%)
0.006–0.392
0.090±0.121
17 133
0.007–0.023
0.014±0.004
23 29
0.002–0.589
0.093±0.192
21 208
0.004–0.367
0.039±0.075
27 190
0.007–0.359
0.059±0.108
10 183
0.009–0.275
0.059±0.096
12 162
0.007–0.008
0.008±0.000
3 2.9
Particulate
methanol (d−1)
Range
Av±1 sd
n cv(%)
<0.001–0.017
0.007±0.005
11 73
<0.001–0.002
0.001±0.001
24 50
<0.001–0.004
0.001±0.001
21 138
<0.001–0.084
0.005±0.016
27 308
<0.001–0.012
0.002±0.004
10 184
<0.001–0.014
0.002±0.004
18 216
<0.001
<0.001
3 57
Duarte, 2002 “what are the sources of organic matter that fuel these relatively high rates of respiration in the surface waters of oligotrophic oceans?” could be partially addressed by looking at respiration of methanol and other biologically-reactive oxygenated volatile organic compounds, especially given the high nanomolar concentrations of methanol in the North Atlantic gyre (up to 429 nM, Beale et al., 2011; Dixon et al., 2011b). However what remains elusive is the source(s) of methanol in the North Atlantic gyre, given that the air-to-sea flux is estimated to be very low in these regions (Dixon et al., 2011b), and methanol oxidation rates are measurable below the mixed layer down to depths of 1000 m.
Some very high methanol oxidation rate constants of 0.5– 0.6 d−1 were sporadically found in the microlayer and im-mediately underlying waters (10 cm). These values compare favourably to a diel range of 0.3–0.8 d−1 reported for sur-face waters of a very oligotrophic station (chlorophyll a con-centration of 0.06 µg l−1) in the tropical North Atlantic (sta-tion 1, Dixon et al., 2011b). Methanol oxida(sta-tion rates in the sea surface microlayer exhibited the greatest heterogeneity of all samples, showing a ca. 300-fold difference between minimum and maximum values. This compares with a 3-fold difference shown in surface waters over the diel cy-cle, from a station with similar background biogeochemical characteristics (Fig. 1, SF6 patch area), and a 65-fold dif-ference between surface seawater of variable chlorophyll a concentrations (Fig. 6). Particulate methanol uptake into par-ticles in the microlayer was generally low at≤0.001 d−1, but also exhibited more heterogeneity compared to bulk surface (∼5 m) seawater over diel (Fig. 5) or spatial trends (Dixon et al., 2011b). This average methanol uptake into particles is lower than previously reported for surface waters (∼0.001– 0.012 d−1, Dixon et al., 2011b), although within the range reported in the diel experiment of the present study (Fig. 5). These results indicate that microbial use of methanol for incorporation into cellular structures in the microlayer was generally very low, but on occasion comparable to the
low-est low-estimated reports for surface waters (where chlorophyll a concentrations were<0.2 µg l−1).
Numbers of bacteria, Prochlorococcus and picoeukaryote cells in the microlayer and underlying layer (10 cm) were within ranges of our surface diel (Fig. 5) and spatial sur-vey (Fig. 6). Whilst the range in Synechococcus cell numbers in the microlayer and 10 cm layer agreed with surface water samples over a large spatial scale (Fig. 6), they were on av-erage higher than those reported during our diel experiment (Fig. 5).
Higher average microbial rates of methanol oxidation and uptake into particles were determined in surface waters sam-pled over a wide spatial range (Table 3, chlorophyll a rang-ing from<0.2–0.6 µg l−1) compared to diel sampling at one location (chlorophyll a <0.2 µg l−1), where for methanol oxidation tox=3.03 (t38=2.68 for P =0.01) and partic-ulate tpart=5.72 (t33=2.75 for P =0.01). Additionally, greater variability is evident over wider spatial sampling scales compared to diel sampling at one location, particularly for methanol oxidation (cv=133 % and 29 %, respectively, Table 1) (Fox=915 where F16,22=2.978, and Fpart=25 where F23,10=3.168 andP =0.01 for spatial compared to diel samples).
The average methanol oxidation and particulate rates de-termined in the microlayer–10 cm compared to the 0.25– 2 m depth were statistically the same (Table 3, tox=1.34, tpart=1.14, t46=2.75 andP =0.01), due to the large sam-ple variance. However for methanol oxidation a two-sided F-test (F = 6.55, F21,27=2.78,P =0.01) suggests that there is more variability in the microlayer–10 cm compared to 0.25– 2 m. In contrast, more variability in particulate methanol uptake rates was shown in the 0.25–2 m compared to the microlayer–10 cm sampling depths (F = 256, F20,26=2.78 forP =0.01).
2.75 andP =0.01, when comparing 0.25–2 m with 5–25 m rates (see Table 3). The only statistically significant differ-ence in variability was shown for the uptake of methanol into the particulate phase between the 0.25–2 m and 5–25 m depths (F =16, F26,9=3.18 forP =0.01). Methanol oxida-tion and uptake rate constants were notably low for deep-ocean samples between 500–1000 m compared to depths
≤100 m.
5 Conclusions
Average surface methanol oxidation rates range between 0.006–0.39 d−1 and agree with those previously published. Some relatively high methanol oxidation rate constants of 0.5–0.6 d−1 were sporadically found in the microlayer and immediately underlying waters (10 cm), although rates were highly variable. Methanol uptake into the particulate phase was exceptionally low in microlayer samples and at depths between 500–1000 m, suggesting that any methanol utilised by microbes in this environment is for energy generation. The microlayer and 10 cm depths showed a higher propor-tion of bacteria with a relatively low DNA content, and bac-terial leucine uptake rates in surface microlayer samples were either less than (for 6 out of 8 occasions) or the same as those in the underlying 10 cm layer. Statistically the aver-age methanol oxidation and particulate rates were the same throughout the water column, despite often demonstrating subsurface peaks, due to high variability in the data. Par-ticulate methanol uptake showed highest variability in the 0.25–2 m top layer compared to all other depths sampled. The statistically significant relationship between the uptake of methanol into particles and bacterial leucine incorpora-tion suggests that perhaps many heterotrophic bacteria can use methanol as a carbon source for cellular growth. On average, BGEm in the top 25 m of the water column is 6 % and decreases with depth. Although, for microlayer and 10 cm-depth samples, BGEm is less than the near-surface 25–217 cm, possibly reflecting increased environmental UV stress resulting in increased maintenance costs, i.e. energy required for survival. We conclude that microbial methanol use, i.e. loss of methanol from seawater, is highly variable, particularly close to the seawater surface, which could sig-nificantly impact upon seawater concentrations and hence the air–sea flux. Further investigations should focus on identify-ing what controls this variability and specifically understand-ing which marine organisms use methanol for energy and/or for carbon assimilation. We feel that this could be key to un-derstanding methanol loss patterns and even the magnitude and direction of the methanol flux across the sea surface.
Acknowledgements. We thank H. Zemmelink, J. Cluderay and H. Slagter from the Royal Netherlands Institute for Sea Research for the provision of seawater samples from their Catamaran near surface sampler, and the scientists, officers and crew of the RRS
Discovery for their help during the UK SOLAS research cruises DOGEE (Deep Ocean Gas Exchange Experiment). We also thank R. Beale for her help in sampling during the Diel experiment and G. Tarran for his help with the flow cytometry analysis. Satellite data were processed by the NERC Earth Observation Data Acquisition and Analysis Service (NEODAAS) at Plymouth Marine Laboratory (http://www.neodaas.ac.uk). This study was supported by the UK Natural Environmental Research Council (NERC) via UK SOLAS and Oceans 2025 funding for Plymouth Marine Laboratory.
Edited by: G. Herndl
References
Alonso-S´aez, L., Gasol, J. M., Ar´ıstegui, J., Vilas, J. C., Vaqu´e, D., and Duarte, C. M.: Large scale variability in surface bacterial carbon demand and growth efficiency in the subtropical northeast Atlantic Ocean, Limnol. Oceanogr., 52, 533–546, 2007.
Barbosa, A. B., Galv˜ao, H. M., Mendes, P. A., ´Alvarez-Salgado,
X. A., Figueiras, F. G., and Joint. I.: Short-term variability of heterotrophic bacterioplankton during the upwelling off the NW Iberian margin, Prog. Oceanogr., 51, 339–359, 2001.
Beale, R., Liss, P. S., and Nightingale, P. D.: First oceanic measure-ments of ethanol and propanol, Geophys. Res. Lett., 37, L24607, doi:10.1029/2010GL045534, 2010.
Beale, R., Liss, P. S., Dixon, J. L., and Nightingale, P. D.: Quan-tification of oxygenated volatile organic compounds in seawater by membrane inlet-proton transfer reaction/mass spectrometry, Anal. Chim. Acta, 706, 128–134, doi:10.1016/j.aca.2011.08.023, 2011.
Brooks, I. M., Yelland, M. J., Upstill-Goddard, R. C., et al. (54 au-thors): Physical exchanges at the air-sea interface, UK-SOLAS Field Measurements, B. Am. Meteorol. Soc., 5, 629–644, 2009. Carlson, C. A., del Giorgio, P. A., and Herndl, G. J.: Microbes and
the dissipation of energy and respiration: From cells to ecosys-tems, Oceanogr., 20, 61–73, 2007.
Carpenter, L. J., Lewis, A., Hopkins, J. R., Read, K. A., Longley, I. D., and Gallagher, M. W.; Uptake of methanol to the North Atlantic Ocean surface, Global Biogeochem. Cy., 18, GB4027, doi:10.1029/204GB002294, 2004.
Chistoserdova, L.: Modularity of methylotrophy, revisited,
Environ. Microbiol., 13, 2603–2622,
doi:10.1111/j.1462-2920.2011.02464.x, 2011.
Cunliffe, M., Salter, M., Mann, P. J., Whiteley, A. S., Upstill-Goddard, R. C., and Murrell, J. C.: Dissolved organic carbon and bacterial populations in the gelatinous surface microlayer of a Norwegian fjord mesocosm, FEMS Microbiol. Lett, 299, 248– 254, 2009.
del Giorgio, P. A. and Duarte, C. M.: Respiration in the open ocean, Nature, 420, 379–384, 2002.
del Giorgio, P. A. and Gasol, J. M.: Microbial ecology of the oceans, edited by: Kirchman, D. L., 2nd edition, Wiley, New Jersey, USA, 243–298, 2008.
Dixon, J. L., Beale, R., and Nightingale, P. D.: Microbial methanol uptake in northeast Atlantic waters, ISME J., 5, 704–716, 2011a. Dixon, J. L., Beale, R., and Nightingale, P. D.: Rapid biologi-cal oxidation of methanol in the tropibiologi-cal Atlantic: significance as a microbial carbon source, Biogeosciences, 8, 2707–2716, doi:10.5194/bg-8-2707-2011, 2011b.
Duarte, C. M., Agust´ı, S., Ar´ıstegui, J., Gonz´alez, N., and Anad´on, R.: Evidence for a heterotrophic subtropical northeast Atlantic, Limnol. Oceanogr., 46, 425–428, 2001.
Garrett, W. D.: Collection of slick-forming materials from the sea surface, Limnol. Oceanogr., 10, 602–605, 1965.
G´omez-Baena, G., L´opez-Lozano, A., Gil-Mart´ınez, J., Lucena, M. J., Diez, J., Candau, P., and Garc´ıa-Fern´andez, J. M.: Glucose up-take and its effect on gene expression in Prochlorococcus, PLoS ONE, 3, e3416, doi:10.1371/journal.pone.0003416, 2008. Gonz´alez, N. R., Anad´on, R., and Viesca, L.: Carbon flux through
the microbial community in a temperate sea during summer: role of bacterial metabolism, Aquat. Microb. Ecol., 33, 117–126, 2003.
Hansell, D. A., Bates, N. R., and Gundersen, K.: Mineralization of dissolved organic carbon in the Sargasso Sea. Mar. Chem., 51, 201–212, 1995.
Jacob, D. J., Field, B. D., Li, Q., Blake, D. R., de Gouw, J., Warneke, C., Hansel, A., Wisthaler, A., Singh, H. B., and Guenther, A.: Global budget of methanol: Constraints from atmospheric observations, J. Geophys. Res., 110, D08303, doi:10.1029/2004JD005172, 2005.
Kirchman, D. L., Suzuki, Y., Garside, C., and Ducklow, H. W.: High turnover rates of dissolved organic carbon during a spring phyto-plankton bloom, Nature, 352, 612-614, 1991.
Lewis, A. C., Hopkins, J. R., Carpenter, L. J., Stanton, J., Read, K. A., and Pilling, M. J.: Sources and sinks of acetone, methanol, and acetaldehyde in North Atlantic marine air, Atmos. Chem. Phys., 5, 1963–1974, doi:10.5194/acp-5-1963-2005, 2005. Mary, I., Tarran, G. A., Warwick, P. E., Terry, M. J., Scanlan, D.
J., Burkill, P. H., and Zubkov, M. V.: Light enhanced amino acid uptake by dominant bacterioplankton groups in surface 10 waters of the Atlantic Ocean, FEMS Microbiol. Ecol., 63, 36–45, 2008. Murrell, C. J. and McDonald, I. R.: Encyclopedia of Microbiology, edited by: Lederberg, J., 3, 245–255, Academic Press, London, UK, 2000.
Neufeld, J. D, Sch¨afer, H, Cox, M. J, Boden, R., McDonald, I. R., and Murrell, J. C.: Stable-isotope probming implicates Methy-lophaga spp abd novel Gammaproteobacteria in marine methanol and methylamine metabolism, ISME J., 1, 480–491, 2007. Neufeld, J. D., Chen, Y., Dumont, M. G., and Murrell, C. J.:
Ma-rine methylotrophs revealed by stable-isotope probing, multiple displacement amplification and metagenomics, Environ. Micro-biol., 10, 1526–1535, 2008.
Obernosterer, I., Catala, P., Reinthaler, T., Herndl, G. J., and Lebaron, P.: Enhanced heterotrophic activity in the surface mi-crolayer of the Mediterranean Sea, Aquat. Microb. Ecol., 39, 293–302, 2005.
Salter, M. E., Uptsill-Goddard, R. C., Nightingale, P. D., Archer, S. D., Blomquist, B., Ho, D. T., Huebert, B., Schlosser, P., and Yang, M.: Impact of an artificial surfactant release on air-sea gas fluxes during Deep Ocean Gas Exchange Experiment II, J. Geo-phys. Res., 116, C11016, doi:10.1029/2011JC007023, 2011.
Singh, H. B. Chen, Y., Tabazadeh, A., Fukui, Y., Bey, I., Yantosca, R., Jacob, D., Arnold, F., Wohlfrom, K., Atlas, E., Flocke, F., Blake, D., Blake, N., Heikes, B., Snow, J., Talbot, R., Gregory, G., Sachse, G., Vay, S., and Kondo, Y.: Distribution and fate of selected oxygenated organic species in the troposphere and lower stratosphere over the Atlantic, J. Geophys. Res., 105, 3795–3805, 2000.
Singh, H. B., Chen, Y., Staudt, A., Jacob, D., Blake, D., Heikes, B., and Snow, J.: Evidence from the Pacific troposphere for large global sources of oxygenated organic compounds, Nature, 410, 1078–1081, 2001.
Singh, H. B., Tabazadeh, A., Evans, M. J., Field, B. D., Jacob, D. J., Sachse, G., Crawford, J. H., Shetter, R., and Brune, W. H.: Oxygenated volatile organic chemicals in the oceans: In-ferences and implications based on atmospheric observations and air-sea exchange models, Geophys. Res. Lett., 30, 1862, doi:10.1029/2003GL017933, 2003.
Sinha, V., Williams, J., Meyerh¨ofer, M., Riebesell, U., Paulino, A. I., and Larsen, A.: Air-sea fluxes of methanol, acetone, acetalde-hyde, isoprene and DMS from a Norwegian fjord following a phytoplankton bloom in a mesocosm experiment, Atmos. Chem. Phys., 7, 739–755, doi:10.5194/acp-7-739-2007, 2007.
Smith, D. C. and Azam, F.: A simple, economical method for
mea-suring bacterial protein synthesis rates in seawater using 3
H-leucine, Mar. Microb. Food Webs, 6, 107–114, 1992.
Sun, J., Steindler, L., Thrash, J. C., Halsey, K. H., Smith, D. P., Carter, A. E., Landry, Z. C., and Giovannoni, S. J.: One carbon metabolism in SAR11 pelagic marine bacteria, PLoS ONE, 6, e23973, doi:10.1371/journal.pone.0023973, 2011.
Tilstone, G. H., Airs, R. L., Martinez-Vicente, V., Widdicombe, C., and Llewellyn, C.: High concentrations of mycosporine-like amino acids and coloured dissolved organic matter in the sea sur-face microlayer off the Iberian Peninsula, Limnol. Oceanogr., 55, 1835–1850, 2010.
Villa-Costa, M., Simo, R., Harada, H., Gasol, J. M., Slezak, D., and Kiene, R. P.: Dimethylsulfoniopropionate uptake by marine phy-toplankton, Science., 314, 652–654, 2006.
Williams, J., Holzinger, R., Gros, V., Xu, X., Atlas, E., and Wal-lace, D. W. R.: Measurements of organic species in air and sea-water from the topical Atlantic, Geophys. Res. Lett., 31, L23S06, doi:10.1029/2004GL020012, 2004.
Zemmelink, H. J., Houghton, L., Sievert, S. M., Frew, N. M., and Dacey, J. W. H.: Gradients in dimethylsulfide, dimethylsulfo-niopropionate, dimethylsulfoxide, and bacteria near the surface, Mar. Ecol. Prog. Ser., 295, 33–42, 2005.
Zubkov, M. V. and Tarran, G. A.: Amino acid uptake of Prochloro-coccus spp. in surface waters across the South Atlantic Subtrop-ical Front, Aquat. Microb. Ecol., 40, 241–249, 2005.
Zubkov, M. V., Fuchs, B. M., Tarran, G. A., Burkhill, P. H., and Amann, R.: High rate of uptake of organic compounds by Pro-chorococcus cyanobacteria as a key to their dominance in olig-otrophic oceanic waters, Appl. Environ. Microbiol., 69, 1299– 1304, 2003.