Can we Enhance Athletic Performance Using Non-Invasive Brain Stimulation?
Thesis supervised by Dr. Hakuei Fujiyama, Dr. Ann-Maree Vallence, and Dr Jeremiah Peiffer
Word Count – 9803 Murdoch University Bachelor of Science Honours
Justin Andre
This thesis is presented in partial fulfilment of the requirements for the degree of
Bachelor of Sciences (Honours), Murdoch University, 2017.
Declaration
I declare that this thesis is my own account of my research and contains as its main content work that has not previously been submitted for a degree at any tertiary educational institution.
Copyright Acknowledgement
I acknowledge that a copy of this thesis will be held at the Murdoch University Library.
I understand that, under the provisions of s51.2 of the Copyright Act 1968, all or part of this thesis may be copied without infringement of copyright where such a reproduction is for the purpose of study and research.
This statement does not signal any transfer of copyright away from the author.
__________________
Full Name of Degree: Bachelor of Science with Honours
Thesis Title: Can we Enhance Athletic Performance using Non-Invasive Brain Stimulation?
Author: Justin Francois Andre
Year: 2017
Table of Contents
Title Page .……….……. i
Declaration ……… ii
Copyright Acknowledgement ……….... iii Table of Contents ……….. List of Figures…..……….….. List of Tables…..………..….. Acknowledgements ……….….. List of Abbreviations……….…. Abstract...……… iv vi i vi ii ix x xi Introduction ………... Fatigue……….…… The relationship between RPE and fatigue……….…… The relationship between RPE and measures of performance (power output and time of completion), and heart rate………... Understanding How RPE Influences an Athlete’s Performance………….… Transcranial Direct Current Stimulation………. Primary Motor Cortex and Fatigue………. Dorsolateral Prefrontal Cortex and Fatigue……….……… Cyclists as a Population……….….. Importance of Study……….... The Present Study………....
1 1 2 3 4 4 5 7 8 9 10
Ethics Approval……….……….. Sampling Methodology………... Participants……….…. Inclusion criteria……….… Exclusion criteria……….…... Research Design……….. Procedures………... Session 1: graded exercise test……….…... tDCS time trials……….. Sessions 2 – 4 :tDCS……….……. Sessions 2 – 4: time trials……….….. Data Analysis……….….. Performance: power output……….…… HR and RPE……….…... Warm-up……… Time trial……….…... Sleep and tDCS sensation questionnaires……….…..
11 11 11 11 11 12 13 13 16 16 18 19 20 20 20 20 21 Results……….…....
Performance: Power Output………....… HR and RPE……….... Warm-up……… Time trial……….... Sleep and tDCS sensation questionnaires………...
21 21 22 22 23 24 Discussion ………..
Hypothesis Two: Effects of A-tDCS to M1 on HR and RPE………. Hypothesis Three: Effects of A-tDCS to DLPFC on Performance……… Hypothesis Four: Effects of A-tDCS to DLPFC on HR and RPE……….. Exercise Protocol Considerations………... tDCS Considerations………... Practical Recommendations and Future Directions……… Conclusion………...
27 29 30 31 32 34 36
References ……….………. 37
Appendix A – Ethics Approval Letter……….…... 49
Appendix B – Information Letter………..………. 51
Appendix C – Consent Form……….……. 54
Appendix D – tDCS-screening Questionnaire.……..………... 55
Appendix E – Par-Q+ Questionnaire………...……... Appendix F – Graded Exercise (GXT) Test: Headgear and Metabolic Cart…….. 56 58 Appendix G – Beam F3 Software………... 59
Appendix H – tDCS sensation questionnaire.…………...……….……. 60
Appendix I – Sleep Questionnaire………... 62
Appendix J – Project Summary……….………... 63 Appendix K – SPSS Output ………...
15
17
22 List of Figures
Figure 1 Equipment used in the Graded Exercise Test. Female riding a cycle ergometer (Velotron), while wearing the headgear…. Figure 2 Electrode placement of (a) F3 (left DLPFC). (b) Cz (M1) and
Oz (V1). (c) FP2 (right supraorbital region)………. Figure 3 Mean ± SD pattern of power output (PO) throughout the Time
23
24 25 List of Tables
Table 1 Participant Demographic……… 12 Table 2 Mean + SD HR and RPE Across Cortical Areas During 30% and
50% PPO Warm…….……… Table 3 Mean + SD HR and RPE Across Cortical Areas Every 4km
Acknowledgements
I first want to acknowledge all the wonderful friendships made during my undergraduate degree, and newly form friendships while undertaking Honours at Murdoch University. We provided each other with daily doses of laughter and motivation, and continuous support with our late night study sessions. This made my university experience more musical and enjoyable. I would also like to express my immense gratitude to my parents. Thank you for the constant reassurance and for believing in me. I am also hugely grateful to my supervisors: Dr. Hakuei Fujiyama, Dr. Ann-Maree Vallence, and Dr Jeremiah Peiffer. Thank you for imparting your wisdom, your guidance, and for you support throughout the year. I also want to give a huge shout out to the PhD students down at the exercise labs. Thank you for reassuring, communicating, and helping me. This made running my experiments down in the labs more enjoyable. Lastly, I would like to thank my dog, Mr Floop. Thank you for always staying by my side during my late nights.
Thank you all for believing in me. I could not have done this year without the wonderful
List of Abbreviations
Abstract
Recent research has shown athletic performance to be enhanced using non – invasive brain stimulation. One factor influencing an athlete’s performance is their perception of how hard an exercise task is, known as their rating of perceived exertion (RPE). Research has shown RPE to be modulated by fatigue. There is evidence to suggest that when fatigue occurs, there is reduced output from the primary motor cortex (M1) and the dorsolateral prefrontal cortex (DLPFC) to the muscles, which contributes to an increase in an athlete’s RPE. Therefore, using anodal transcranial direct current stimulation (A-tDCS) to increase cortical excitability could prolong the development of fatigue, and accordingly reduce RPE. If less effort is needed to perform the physical activity, then heart rate (HR) will decrease and performance will be enhanced. To test whether A-tDCS can enhance athletic performance and reduce RPE and HR, 10 athletic cyclists volunteered to complete four sessions. The first session was a Graded Exercise Test, and sessions two — four involved A-tDCS administered at one cortical site (M1, DLPFC, or Visual Cortex [control stimulation]) before participants completed a warm up, followed by a 16.1km Time Trial (TT). In each TT, HR, RPE, power output (PO), and time to complete the TT were recorded. Results showed no significant differences in RPE, HR, PO, or time to complete the TT between cortical sites. This study suggests that A-tDCS was unable modulate fatigue, and consequently, athletic performance, RPE, and HR remained unaffected. Reasons behind these findings are discussed, with suggestions for future research.
Can we Enhance Athletic Performance Using Non-Invasive Brain Stimulation? The world of sport acknowledges that athletes are constantly trying to reach optimal performance. Athletes frequently attest to the idea that perfect performances exist in sport, whether it is the perfect hit, jump, or run (Koivula, Hassme, & Fallby, 2002). Athletes are told continuously to increase their performance, and that ‘practice makes perfect’ (Koivula et al., 2002). When athletes are not able to achieve their optimal performance, they are at an elevated risk of being dropped from an elite squad, which in turn can affect their psychological and physical wellbeing (Hughes & Leavy, 2012). Therefore, finding ways to increase athletic performance is vital to athletes. One factor known to influence an athlete’s performance is their perception of how hard an exercise task is, known as their rating of perceived exertion (RPE). Research suggests that RPE is modulated by fatigue (Abbiss, Peiffer, Meeusen, & Skorski, 2015).
Fatigue
perceived exertion during physical exercise, consistent with current definitions in the exercise physiology literature (Abbiss & Laursen, 2005; Abbiss et al., 2015).
The relationship between RPE and fatigue. RPE is a subjective measure of intensity and fatigue experienced during physical activity (Abbiss et al., 2015). In the literature, fatigue is a factor known to influence RPE, and therefore, RPE can be used to investigate the development of fatigue (Abbiss et al., 2015; Berchicci, Menotti, Macaluso, & Di Russo, 2012; de Morree & Marcora 2013). Berchicci et al. (2012) used RPE and muscle force measures, i.e., maximal voluntary contraction (MVC), to investigate the development of fatigue during high intensity submaximal lower limb isometric contractions. Participants performed four blocks of the isometric exercise at 40% MVC, with each block consisting of 60 two-second contractions. RPE and MVC were measured before and in-between blocks of exercise. Compared to baseline, RPE significantly increased while MVC significantly decreased following the four exercise blocks. The authors suggested that the significant decline in MVC and increase in RPE indicated the development of fatigue. Furthermore, Berchicci and colleagues (2012) suggested that in the presence of fatigue, there is increased activation of the lower limb muscles needed to maintain the isometric contractions, consequently exacerbating RPE.
The relationship between RPE and measures of performance (power output
and time of completion), and heart rate. As described above, in this thesis, fatigue is defined as an increase in RPE and a loss of power output during physical exercise, where power output (PO) refers to the energy being created during performance (Abbiss & Laursen, 2005). In the literature, RPE has a strong relationship with PO (Cohen et al., 2013; de Koning et al., 2011; de Jong et al., 2015). In addition, RPE is strongly associated with other performance measures, such as time taken to finish an exercise task (Cohen et al., 2013; de Koning et al., 2011; de Jong et al., 2015; Faulker, Gaynor, Parfitt, & Eston, 2011; Tucker, 2009), as well as heart rate (HR) (Green et al., 2005; Green et al., 2006).
De Koning et al. (2011) investigated the influence of RPE on athletic performance. To accomplish this, de Koning and colleagues (2011) integrated performance and RPE data from nine separate experiments, where cyclists or runners had to complete a set distance in the shortest amount of time possible. After compiling the data, de Koning and colleagues (2011) found that RPE increased with remaining distance. Additionally, as RPE increased, PO decreased throughout the exercise. The authors suggested that if RPE were higher than expected, performance would diminish, i.e., lower PO and the time taken to complete an exercise task would increase (de Konining et al., 2011). Furthermore, as RPE increases, more effort is needed to maintain the exercise task, consequently increasing HR (Chen, Chen, Hsua, & Lin, 2013; Ekblom & Goldarg, 1971; Green et al., 2006; Pinto et al., 2015). In contrast, de Koning and colleagues (2011) suggested if RPE could be lowered, performance would be enhanced, i.e., increased PO and decreased time taken to complete a task. If less effort is needed to maintain the exercise task, then HR will subsequently decrease (Green et al., 2006).
As described above, high RPE is accompanied with inflated levels of fatigue (Berchicci et al., 2012). It is possible that performance is diminished, reflected by lower PO and increased time to complete a task, due to fatigue impairing the muscle’s ability to generate force (de Koning et al., 2011); consequently, more effort is needed to perform the same function and thus, HR increases (Green et al., 2006; Shortz et al., 2015). Alternatively, low RPE increased PO and decreased time taken to complete an exercise task, leading to enhanced performance (de Koning et al., 2011; Okano et al., 2013). It is plausible that a lower RPE is associated with lower levels of fatigue experienced during performance, and this resulted in less effort needed to maintain the physical task (Berchicci et al., 2012).
Transcranial Direct Current Stimulation
change the membrane potential, which increases or decreases the likelihood of neuronal firing (Cogiamanian et al., 2010; Nitsche & Paulus, 2000). Although tDCS is not entirely understood, tDCS functions by eliciting synaptic changes in the cortical area stimulated (Amadi, Ilie, Johansen-Berg, & Stagg, 2014; Boros, Poreisz, Munchau, Paulus, & Nitsche, 2008; Das, Holland, Frens, & Donchin, 2016; Raimundo, Uribe, & Brasil-Neto, 2012).
Application of tDCS for 10-20 minutes has been shown to induce changes in cortical excitability of the stimulated area (i.e. the area under the electrodes), and these changes in cortical excitability can persist for one hour or more (Lang et al., 2005; Nitsche & Paulus, 2001). Numerous studies have used tDCS to alter cortical excitability, and examined the influence of this on behaviour, such as psychomotor functions (Antal, Terney, Kunhl, & Paulus, 2010; Boggio et al., 2006; Fregni et al., 2005). Due to the potential benefits of transiently altering cortical excitability using tDCS, preliminary evidence suggests that tDCS might prolong the development of fatigue, which, in turn, could reduce RPE and enhance athletic performance (Lattari et al., 2016; Okano et al., 2013).
Primary Motor Cortex and Fatigue
After the initial increase in M1 activity, there is a decrease in cortical activity from M1 that results in reduced motor output to muscles, causing a decline in muscle activity (Hou et al., 2016; Liu et al., 2002). Therefore, a decrease in motor outputs is thought to contribute to the development of fatigue (Liu et al., 2002). If this reduction in output from the M1 contributes to fatigue, then an intervention that increases activity in this cortical area could plausibly reduce fatigue and RPE, enhancing performance (Angius et al., 2016; Williams et al., 2013).
performance and reducing RPE. However, this finding has not been consistent in the literature (Angius et al., 2015; Vitor-Costa et al., 2015).
Vitor-Costa et al. (2015) also investigated the effect of A-tDCS on TTF in a cycling task. Participants underwent A-tDCS to M1 for 13 minutes with the strength of the current set at 2.0 mA as well as a sham condition. After tDCS, participants completed a TTF cycling protocol at 80% PPO. During each TTF cycling protocol, RPE and HR were recorded. Results showed that TTF was significantly longer following A-tDCS compared to sham, but there was no significant difference in RPE and HR between A-tDCS and sham. Although the longer TTF indicated an improvement in athletic performance, tDCS did not influence perceptual and physiological variables (that is, RPE or HR). Vitor-Costa and colleagues (2015) suggested that improvements in athletic performance were due to an increased M1 excitability; enhancing motor outputs to the muscles needed to maintain physical activity. However, given that the tDCS parameters used in their study did not affect RPE, the authors suggested that future research is necessary to determine the stimulation intensity and stimulation location that affects RPE. There is some evidence to suggest that A-tDCS to M1 might be effective in reducing RPE and enhancing athletic performance (Angius et al., 2017). However, as presented above, results are inconsistent and warrant further investigation (Vitor-Costa et al., 2015).
Dorsolateral Prefrontal Cortex and Fatigue
2016; Tanaka, Ishii, & Watanabe, 2013). In line with this, if the excitability of the DLPFC is reduced, this could lead to a reduction in the output from DLFPC to M1, which in turn, might lead M1 to decrease outputs to the muscles resulting in fatigue (Tanaka et al., 2016; Tanaka et al., 2013). If a decrease in output from the DLPFC contributes to fatigue occurring, then an intervention that increases activity to this brain region could possibly reduce fatigue and RPE, enhancing performance.
To date, one study has examined the effect of A-tDCS applied to DLPFC on athletic performance and RPE (Lattari et al., 2016). Lattari et al. (2016) aimed to evaluate the efficacy of A-tDCS in enhancing performance. Participants underwent A-tDCS to the left DLPFC for 20 minutes with the strength of the current set at 2.0 mA as well as a sham condition. After A-tDCS, participants completed a fatiguing flexion exercise of the elbow, which involves participants lifting a barbell until fatigue. RPE and the total number of times the weight was lifted (repetitions) were recorded. Results showed a reduction in RPE and an increase in the number of repetitions following A-tDCS than following sham. The authors suggested that the decrease in RPE was due to A-tDCS modulating fatigue in the DLPFC (Tanaka, Hanakawa, Honda, & Watanabe, 2009). As only one study has investigated the effects of A-tDCS applied to the DLPFC in performance (Lattari et al., 2016), this warrants more research of using A-tDCS in another type of exercise protocol, and under a different intensity and stimulation.
Cyclists as a Population
whole body exercise protocols, such as cycling at a constant pace (70% or 80% PPO) and measuring TTF. When it comes to athletic performance, the sensitivity of a test to determine performance changes is affected by different types of exercise protocols (Hopkins, 2000). A cycling protocol, called a time trial (TT), consists of cyclists riding a fixed distance in the shortest amount of time possible, and is a well-established protocol that is sufficiently sensitive to detect changes in performance (Bellinger & Minahan, 2014; Paton & Hopkins, 2001; Sparks et al., 2016). Sparks et al. (2016) reported that the most frequently used distance in road-based TT competitions is 16.1km (kilometers), and suggested that a 16.1km TT should be used as an exercise performance criterion because it represents the most directly related and valid assessment of actual cycling performance. Additionally, a TT conducted in a controlled environment, such as in a laboratory, enables the control of potential confounding variables such as heat. In cycling research, many studies have noted the variation in results stemming from different temperatures (Peiffer & Abbiss, 2011). Exercising in hot (>30*C) or cold (<21*C) conditions can cause variation of results in TT, PO, HR, and RPE (Peiffer & Abbiss, 2011). Despite the high validity from cyclists being familiar with the distance and the ability to control the testing environment, the 16.1 km TT is rarely used in experiments (Jones et al., 2015; Williams et al., 2015), and has not been used on any studies examining the efficacy of tDCS to enhance performance.
Importance of Study
perceived exertion, potentially providing a way for cyclists to improve their performance in a TT. More importantly, this research is necessary as modern day technology is currently being marketed to cyclists, incorporating tDCS into headgear, similar to headbands worn at the gym or at training (Business Insider, 2017). However, the published scientific research that can support the use of tDCS in enhancing cycling performance is limited and conflicting (Angius et al., 2015; Angius et al., 2017;Vitor-Costa et al., 2015).
The Present Study
To date, studies have found the application of A-tDCS over the M1 or DLPFC reduced RPE and enhanced athletic performance (Angius et al., 2017; Lattari et al., 2016). However, there is limited evidence and some conflicting results regarding the efficacy of A-tDCS on performance, RPE, and HR (Angius et al., 2015; Lattari et al., 2016; Vitor-Costa et al., 2015). The aim of this study was to determine if A-tDCS to M1 or DLPFC affected athletic performance, RPE, or HR, applied before a set-intensity warm up and a 16.lkm cycling TT. In examining this, there are four hypotheses: the first hypothesis was that A-tDCS to M1 (but not Visual Cortex [V1]) will increase PO and decrease time of TT (Angius et al., 2017; Vitor-Costa et al., 2015); the second hypothesis was that A-tDCS to M1 (but not V1) will reduce RPE and HR during both set intensity warm-up and TT (Angius et al., 2017); the third hypothesis was that A-tDCS to DLFPC (but not V1) will increase PO and decrease time of TT (Lattari et al., 2016); and the fourth hypothesis was that A-tDCS to DLPFC (but not V1) will reduce RPE and HR during both set intensity warm-up and TT (Lattari et al., 2016).
Ethics Approval
Murdoch University’s Human Research Ethics Committee approved this study before data collection (2017/021) (refer Appendix A).
Sampling Methodology
Participants. Following a similar sample size used in previous research investigating the effect of tDCS on cycling performance (e.g., Angius et al., 2015; Angius et al., 2017 Vitor-Costa et al., 2015), 1 experienced trained female and 9 experienced trained male cyclists volunteered for this study. Participants’ demographic information obtained from the first session is presented in Table 1. Participants were recruited through the Cycling Time Trial Association Facebook group. Each participant was informed of the procedures, benefits, and risks (refer Appendix B) before giving written informed consent to participate in the study (refer Appendix C). Thirteen participants were initially recruited, but three participants were unable to complete all sessions. Outside of testing conditions, one of the participants injured their leg, and the other two became sick. Participants were instructed to avoid strenuous physical activity (i.e., interval training or time trailing) and to maintain a similar diet the day before and day of testing for all experimental sessions.
Inclusion criteria. This study had three inclusion criteria: Cyclists had to ride a minimum of 200km a week, have completed one TT in the past 12 months, and be aged between 18 – 50.
questionnaire. This study utilised a high-intensity cycling protocol, as such, cyclists with cardiovascular problems did not participate in this study (refer Appendix E).
Table 1
Participant Demographic
Research Design
This study used a repeated measures within-subjects design. The independent variable was the site of stimulation (V1, M1, or DLPFC), and the dependent variables were PO, RPE, HR, and time of completion. Using a repeated measures design would reduce individual differences that may contribute to type I or type II errors (Girden, 1992). Additionally, the allocation of stimulation site was counterbalanced to control for carryover effects that are enhanced by a repeated measures design. Cyclists were blinded to the type of stimulation in each session, and this will ensure a control effect. As the study required a specific population of cyclists, a repeated measures design reduces the amount of participants needed for the data to be valid (Girden, 1992).
In this study, cyclists completed four exercise sessions at Murdoch University’s exercise physiology laboratory, with a minimum of two days between each session. The first session was a graded exercise test (GXT), while the remaining three sessions were
Males Female
M SD M SD
Age (years) 36 6 34 0
Height (cm) 178 9 167 0
Weight (kg) 74 7 72 0
V02max (mL.kg -1.min-1)
57.60 5.57 43.20 0
tDCS time trials. In each of the three tDCS time trial sessions, participants underwent 20 minutes of A-tDCS applied at a moderate intensity, 1.5mA (Fujiyama et al. 2017), to one of the three target cortical regions: DLPFC, M1, or V1 (control site). After stimulation, participants completed a 10-minute standardised warm up on a cycle ergometer, and a 16.1km TT directly after. During the TT, RPE, PO, HR, and time to complete each TT was recorded.
Procedures
Prior to commencement of the experiment, the researcher (JA) obtained a first aid certificate to deal with any health concerns that could arise from cyclists participating in a high intensity exercises. After the certificate was obtained, recruitment of cyclists commenced.
Session 1: graded exercise test. Participants were sent an information letter that explained the study, and were required to answer two screening questionnaires, i.e., tDCS screening and Par-Q+. Before starting the GXT, the participant’s weight and height measurements were collected, and the electronically braked cycle ergometer (Velotron; RacerMate, USA) was modified to accurately match the dimensions of the road bicycle measurements of the participant.
using Parvo TrueOne metabolic cart (ParvoMedics; USA) (refer Appendix F). This type of metabolic cart has been shown to be valid and reliable (Crouter, Antczak, Hudak, DellaValle, & Haas, 2006; Macfarlane & Wu, 2013). Before each use, the metabolic cart was calibrated using gases of known concentration (4.0% CO2 and 16.0% O2), and through a range of flow rates using a Hans Rudolph 3L Syringe. Also, verbal encouragement was provided to the participants, and they were instructed to ride at a cadence above 60 Revolutions Per Minute (RPM). The test was terminated when the participant reached volitional fatigue, as indicated through cadence dropping below 60 RPM. After completion of the GXT, participants completed a ‘cool down protocol’ on the Velotron, where participants rode at a self-selected pace. The first session concluded with the participant being debriefed: answering any questions, ensuring the participant was in a stable condition, explaining confidentiality of results, and booking the next session.
Figure 1: Equipment used in the Graded Exercise Test. Female riding a cycle ergometer (Velotron), while wearing the headgear. (Image adapted from NyVelocity, 2007).
tDCS Time Trials.
Sessions 2 - 4: tDCS. The remaining three sessions were completed using identical methodology, except for the target tDCS site (DLPFC, M1, or V1), and was completed in a counterbalanced order. Upon arrival, participants were seated in the environmental chamber for 20 minutes, during which A-tDCS was administered at one of the target sites, with a standard current intensity of 1.5 mA (Fujiyama et al. 2017).
A-tDCS was delivered by a battery-driven Dual Channel Iontophoresis System (Chattanooga Ionto, USA). During sessions 2 – 4, a total of four electrodes were placed and attached with bandages on the participant’s head; however, only one cortical site was stimulated per session. This was to blind the participants to what area was being stimulated. Each electrode was wrapped in a sodium chloride (saline) soaked sponge, and was lined with conductive gel. In determining electrode positioning, the electroencephalogram electrodes 10–20 international systems were used (Klem, Luders, Jasper, & Elger, 1999). For M1 stimulation, the anode was placed over Cz; for DLPFC stimulation, the anode was placed over F3; and for V1 stimulation, the anode was placed over Oz. While each cortical area was being stimulated, the cathode was always placed on Fp2 (right supraorbital area) (see Figure 2).
common reference site for the cathode is the right supraorbital region, located above the left eye socket (Hsu, Zanto, & Gazzaley, 2015; Lattari et al., 2016).
Figure 2. Electrode placement of (a) F3 (left DLPFC). (b) Cz (M1) and Oz (V1). (c) Fp2 (right supraorbital region). (Image adapted from TotaltDCS, 2015).
Cz placement was chosen based on the chosen cycling exercise, since applying the large anode over Cz would stimulate the M1 representations of lower limb muscles in both hemispheres (Vitor-Costa et al., 2015). Furthermore, while stimulating M1 a common reference site for the cathode is the right supraorbital region. This type of electrode placement has been shown to increase motor output (Stagg & Nitsche, 2011).
V1 was located through Oz placement. V1 acted as the active control condition in this study. There is no evidence to suggest that V1 has a role in fatigue, and therefore, stimulation of V1 was not expected to induce any changes in RPE, PO, HR, or time of completion.
Immediately after the completion of the tDCS, participants completed a 10-minute standardised warm up on the Velotron cycle ergometer inside a heat chamber; the first 5-minutes was at 30%PPO and the next 5-5-minutes was at 50%PPO. The environmental chamber remained at a constant temperature of 24°C and 40% relative humidity. During the mid and end point of each 5-minute stage, RPE and HR was measured. HR and PO was recorded at a beat-by-beat frequency using a Garmin (model 500; USA). RPE was recorded using Borg’s (1990) Scale of Perceived Exertion (10-point scale; 1 = no exertion and 10 = maximal exertion). A meta-analysis showed this scale to have strong psychometric properties; the scale is valid and reliable in measuring perceived exertion in a healthy athletic population (Chen, Fan, & Moe, 2002), and across cultures (Leung, Chung, & Leung, 2002).
After completing the warm-up, participants immediately completed a 16.1 km TT on the same Velotron cycle ergometer; participants were instructed to complete the TT in the “shortest time possible.” The Velotron gears were standardised to start at 52/17, where the gears determined the amount of resistance applied to Velotron. After the TT began, participants were able to change gear intensity to their preference. When the TT commenced, a large fan placed directly in front of the participant was immediately started at the lowest power setting. During the TT, only feedback about the distanced completed was provided. At 4km intervals, average PO and average HR was collected from the Garmin, along with the participants’ RPE. Additionally, the mean PO of the TT and time to complete the 16.1km TT was extracted from the Garmin.
questionnaire has been used in tDCS research (Fujiyama et al., 2017; Vancleef, Meesen, Swinnen, & Fujiyama., 2016) to assess if performance is influenced by other variables, i.e., lack of sleep or tDCS sensations. Even though the psychometric properties of these questionnaires are unknown, these questionnaires have provided valid and reliable results in past research (Fujiyama et al., 2017; Vancleef et al., 2016). All data obtained from the TT was stored using Excel 2013 (Microsoft Corp., Redmond, Washington, USA). Once participants have completed all sessions, the summary of the project will be available online on the Murdoch University’s Library Research Repository for viewing (refer Appendix J).
Data Analysis
All analyses were performed using the Statistical Package for the Social Sciences (V.21.0, Chicago, USA), and significance was based on an alpha level of .05. For full SPSS output, refer to Appendix K. Significant main effects and interactions were further explored with post hoc analysis with Least Significant Difference corrections. Partial eta-squared (partial η2) values were provided as measures of effect sizes, with values of .01, .06, and .14 constituting small, medium, and large effects respectively (Cohen, 1988).
of variance was not violated. Furthermore, upon inspection, the assumption of normality was violated for RPE measures at 30% and 50%PPO warm-up, and RPE measures throughout the TT. However, a repeated measure ANOVA is robust against the violation of normality; this encroachment should not threaten the interpretation of analysis (Glass, Peckham, & Sanders, 1972; Harwell, Rubinstein, Hayes, & Olds, 1992).
Performance: power output. To determine the effect of A-tDCS to overall performance when applied before a 16.1km TT, one-way repeated measures ANOVAs were performed with a within-subject factor of CONDITION (three levels: V1, M1, DLPFC), with separate ANOVAs performed for PO and time to completion of the 16.1km TT. To further investigate the effect of tDCS on performance, mean PO was calculated across different points of the TT: 0 – 3 km, 4 – 7 km, 8 – 11 km, and 12 – 16 km. Two-way repeated measures ANOVAs were performed on the mean PO data with within subject factors of CONDITIONS (three levels: V1, M1, DLPFC) and TIME (four levels: 4km, 8km, 12km, 16km).
HR and RPE.
Warm-up. To determine the effect of A-tDCS on HR during the set-intensity warm-up, one-way repeated measures ANOVAs were performed with a within-subject factor of CONDITION (three levels: V1, M1, and DLPFC), with separate ANOVAs performed on mean HR for 30%PPO warm-up and mean HR for 50% PPO warm-up. To determine the effect of A-tDCS on RPE during the set-intensity warm-up, separate Friedman’s two-way ANOVAs were performed on mean RPE for 30%PPO warm-up and mean RPE for 50%PPO warm-up.
ANOVAs were performed on mean RPE and HR with within subject factors of CONDITIONS (three levels: V1, M1, DLPFC) and TIME (four levels: 4km, 8km, 12km, 16km).
Sleep and tDCS sensation questionnaires. To determine if sleep, caffeine, alcohol, and tDCS sensations influenced performance, the mean values for number of numbers of hours slept, sleep quality, alcohol consumed, caffeine intake, and tDCS sensations were analysed across stimulation conditions. Separate one way repeated measures ANOVAs were conducted to assess if CONDITIONS (three levels: V1, M1, and DLPFC) different significantly in the number of numbers of hours slept, sleep quality, tDCS sensations, alcohol consumed, and caffeine intake.
Results
Performance: Power Output
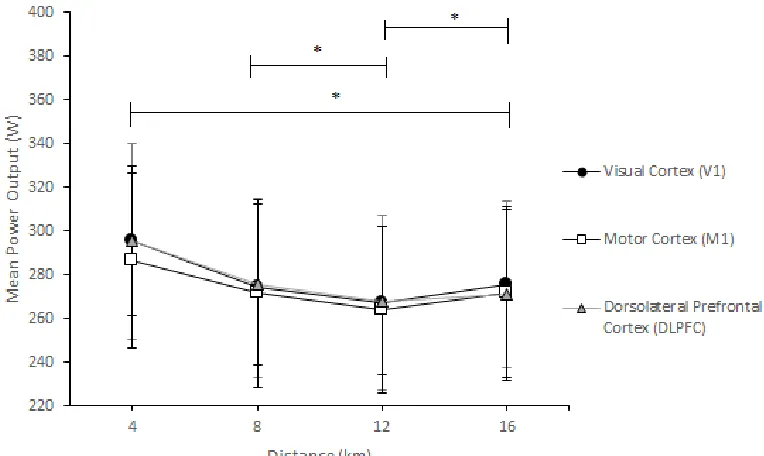
= 37.44), 12km (M = 266.50, SD = 34.01), and 16km (M = 272.76, SD = 39.12). Additionally, 8km PO was significantly greater than 12km PO. Lastly, 12km PO was significantly lower than 16km. There was no significant interaction of time and condition
F (6, 54) = .973, p= .451, partial η 2 =. 098.
Figure 3. Mean + SD pattern of power output (PO) throughout the Time Trial (TT) across
cortical areas: V1, M1, and DLPFC. *Significant differences in PO over time: PO greater at 4km than 8km, 12km, and 16km; PO greater at 8km than 12km; PO lower at 12km than 16km.
HR and RPE
Table 2
Mean + SD HR and RPE Across Cortical Areas During 30% and 50% PPO Warm-up
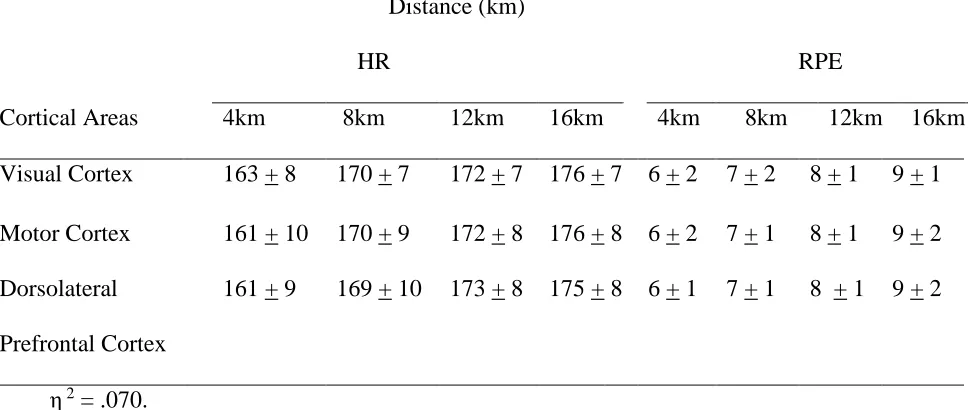
Time trial. Mean differences in RPE and HR between conditions and over the 16.1km TT are shown in Table 3. Mean HR and RPE increased throughout the TT. The repeated measures ANOVA showed a significant main effect for time on the measure of HR, F(1.452, 13.070) = 53.314, p< .001, with a medium effect size of partial η 2 =. 09. Pairwise comparisons further revealed that 4km HR (M = 161, SD = 8) was significantly lower than 8km (M = 169, SD = 7), 12km (M =172, SD = 8), and 16km (M = 175, SD = 8). Additionally, 8km HR was significantly lower than 12km and 16km. Lastly, 12km HR was significantly lower than 16km. Also, a significant main effect of time was
Warm-Up
30%PPO 50%PPO
Cortical Areas HR RPE HR RPE
Visual Cortex 113 + 19 2 + 1 135 + 14 3 + 1 Motor Cortex 110 + 12 2 + 1 136 +13 3 + 1 Dorsolateral
Prefrontal Cortex
observed for the measure of RPE, F(2.028,18.253) = 65.553, p<.001, with a large effect size of partial η2 =. 87. Pairwise comparisons further revealed that 4km RPE (M = 6, SD = 2) was significantly lower than 8km (M = 7, SD = 1), 12km (M = 8, SD = 1), and 16km (M = 9, SD = 2). Additionally, 8km RPE was significantly lower than 12km and 16km. The ANOVAs showed no significant main effect of conditions for either HR, F(2, 18) = .035, p = .965, partial η 2 =004, or RPE, F(2, 18) = .604, p = .558, partial η 2 = .063. Additionally, there were no significant interactions between time and conditions for either HR, F(6,54) = 1.154, p= .345, partial η 2 =. 114, or RPE, F(6,54) = .680, p = .666, partial
η 2 = .070. Table 3
Mean + SD HR and RPE Across Cortical Areas Every 4km throughout the 16.1km TT.
Sleep and tDCS Sensation Questionnaires
Table 4 shows the means and standard deviations for the units of caffeinated drinks consumed 12 hours, sleep quality, number of hours slept (night prior to testing session), units of alcohol consumed in the last 12 hours, and sensations from tDCS. There were no significant differences between conditions in terms of: (a) units of caffeinated drinks consumed, F(1.173, 10.560) = .796, p = .413, partial η 2 = .08; (b) sleep quality,
Distance (km) HR
RPE
Cortical Areas 4km 8km 12km 16km 4km 8km 12km 16km Visual Cortex 163 + 8 170 + 7 172 + 7 176 + 7 6 + 2 7 + 2 8 + 1 9 + 1 Motor Cortex 161 + 10 170 + 9 172 + 8 176 + 8 6 + 2 7 + 1 8 + 1 9 + 2 Dorsolateral
Prefrontal Cortex
F(2, 18) = .675, p = .521, partial η 2 = .07; (c) number of hours slept, F(2, 18) = .911, p
=. 420, partial η 2 = .420 (d) adverse sensations of tDCS, F(2, 18) = 1.00, p = .387, partial η 2 = .10, and (e) units of alcohol consumed.
Table 4
Scores for Sleep and tDCS sensation Questionnaires
Note. Mean scores for Adverse Sensations of tDCS can range from 1 – 4, with lower scores indicating weaker sensations felt during tDCS: tingling, burning-sensations, fatigue, un-comfortableness, or concentration problems.
Discussion
The aim of this study was to determine if A-tDCS to M1 or DLPFC affected athletic performance, RPE, or HR, applied before a set-intensity warm up and a 16.lkm cycling TT. The current study has two main results. First, the effect of A-tDCS applied to M1 or DLPFC on performance was not different to A-tDCS applied to V1 (control stimulation). Second, the effect of A-tDCS applied to M1 or DLPFC on RPE and HR was not different to tDCS applied to V1 (control stimulation). These results suggest
A-Cortical Areas
Visual Cortex Motor Cortex Dorsolateral Prefrontal Cortex Units of caffeinated drinks
consumed
3.00 + 2.00 2.66 + 1.32 2.77 + 1.30
Sleep quality 7.22 + .83 7.33 + .86 6.83 + 2.29 Number of hours slept 7.25 + .25 7.36 + .67 7.16 + .61
Units of alcohol consumed 0 0 0
tDCS to M1 or DLPFC was not able to enhance athletic performance, nor reduce perceptual and physiological variables.
Hypothesis One: Effects of A-tDCS to M1 on Performance
It was hypothesised that A-tDCS to M1 (but not V1) would increase PO and decrease time of TT. This hypothesis was not supported, as results from this present study showed mean PO and mean time to completion were non-significant between M1 and V1 during the TT. Furthermore, when PO was examined in 4km intervals throughout TT, results of this further analysis showed a normal distribution of power typically seen in a 16.1km TT (Atkinson & Brunskill, 2000; Jones et al., 2016). Specifically, during a 16.1km cycling TT, cyclists maintain a high PO for the first 4km, which is followed by a steady decline in PO typically observed at 8km and 12km, and an increase PO is typically observed in the last 4km to finish the 16.1km TT. This typical distribution of PO that was observed across the TT was not different for the M1 and V1 conditions, suggesting that A-tDCS to M1 does not enhance TT performance.
athletic performance, it is possible that neuronal excitability was not sufficiently altered following stimulation.
In the current study, we did not directly measure the excitability of M1 following A-tDCS. It has been suggested that stimulation of the leg representation of M1 might be less affected by tDCS than the upper limb representations in M1, because the leg representation is located deeper in the underlying brain tissues than the upper limb representations (Jeffery, Norton, Roy, & Gorassini, 2007). Therefore, it is possible that A-tDCS to M1 did not affect M1 output in this current study, which is essential for maintaining physical activity. Future research should directly measure the excitability of M1 following A-tDCS, which can be done using a non-invasive brain stimulation technique called transcranial magnetic stimulation.
After A-tDCS to M1, an alternative explanation of why there were inconsistent results in performance between this study and previous research can be due to the differences in samples. We used high-level athletic cyclists, while previous research (Anguis et al., 2017) used ‘healthy physically active’ participants. Athletic cyclists participated in this study as a high-intensity cycling protocol was used, and is this protocol is valid and reliable in assessing cycling performance within a cyclist population. However, it is possible that there was no effect of tDCS on performance because of a ceiling effect in the high-level cyclists recruited for this study; tDCS might not be able to improve performance because high-level cyclists might not have room to improve.
Hypothesis Two: Effects of A-tDCS to M1 on HR and RPE
50%PPO, and throughout the TT. Furthermore, after A-tDCS to M1 and V1, results of this current study showed HR and RPE to continue to increase throughout the set – intensity warm up and 16.1km TT. Irrespective of tDCS intervention, this is to be expected, as the literature shows RPE to rise with increasing HR (Green et al., 2005; Green et al., 2006). A higher RPE is due to fatigue impairing the muscles ability to generate force, requiring more effort to perform the same function (Berchicci et al., 2012), correspondingly increasing HR (Green et al., 2005; Green et al., 2006). Therefore, A-tDCS to M1 was not able to modulate RPE and HR.
Results of this study are inconsistent with previous research (Anguis et al., 2017), which showed after A-tDCS to M1, a reduction in RPE was observed compared to sham. The authors indicated that A-tDCS increased excitability of M1, which augmented the motor outputs to the working muscles. An increase in motor outputs to the muscles caused participants to use less effort, and this caused the task to be perceived as easier, decreasing RPE. Therefore, an increase in cortical activity of M1 after A-tDCS might have led to a reduction in perceived exertion throughout the exercise task (Anguis et al., 2017).
2002) and, therefore, did not change RPE. Additionally, if RPE remained unchanged, and given the positive association RPE has with HR within the literature (Green et al., 2005; Green et al., 2006), no change in HR would be observed. If perceived exertion cannot be reduced, another explanation for the lack of improvements in performance could be due to perceived exertion not being influenced throughout the set-intensity warm up and TT; accordingly, optimal performance cannot be achieved (de Koning, 2011; de Jong et al., 2015).
Hypothesis Three: Effects of A-tDCS to DLPFC on Performance
It was hypothesised that A-tDCS to DLFPC (but not V1) would increase PO and decrease time of TT. This hypothesis was not supported; after A-tDCS to DLPFC and V1, results from this study showed no significant changes in mean PO and mean time of TT completion. Additionally, when PO was examined in 4km intervals throughout TT, the normal distribution of power throughout the TT, i.e., a decrease and then final increase in PO, was present in the DLFPC condition (as well as V1 and M1 as described above). This typical distribution of PO that was observed across the TT was not different for the DLPFC and V1 conditions, suggesting that A-tDCS to DLPFC does not enhance TT performance.
DLPFC output, which is essential for maintaining physical activity and modulating fatigue.
Hypothesis Four: Effects of A-tDCS to DLPFC on HR and RPE
It was hypothesised that A-tDCS to DLPFC (but not V1) would reduce RPE and HR during both set intensity warm up and 16.1km TT. Results showed no significant differences in mean RPE and mean HR between DLPFC and V1 during set intensity warm-up or TT, rejecting the hypothesis proposed. Furthermore, after A-tDCS to DLPFC and V1, results of this current study showed that HR and RPE continued to increase throughout the set – intensity warm up and 16.1km TT. As described above between M1 and VI, irrespective of tDCS intervention, this is to be expected, as the literature shows RPE to rise with increasing HR (Green et al., 2005; Green et al., 2006). Therefore, results from this current study suggest that A-tDCS to DLPFC was unable to modulate RPE and HR.
Furthermore, if perceived exertion cannot be reduced, another explanation of why there were no improvements in performance may be due to perceived exertion not being influenced throughout the TT and set-intensity warm up; accordingly, optimal performance could not be achieved (de Koning, 2011; de Jong et al., 2015).
An alternative explanation for the lack of differences in RPE during the set-intensity warm up and TT might be due to DLPFC or M1 not being related in perceiving exertion. Instead of DLPFC or M1, Okano et al. (2013) suggested that the temporal cortex and insular cortex are areas related in perceiving exertion. They applied 20 minutes of A-tDCS to the temporal cortex, and reported a reduction in RPE and enhancements in athletic performance during an incremental cycling test, compared to sham. Their findings suggest that A-tDCS over the temporal cortex modulates perceived exertion and exercise performance. Future research should consider stimulating other cortical sites related to perceived exertion.
Exercise Protocol Considerations
environment (Peiffer & Abbiss, 2011). However, it is possible that divergent findings from the literature and this study could be due to different exercise protocols. Possibly, the effects of tDCS may only be exerted in strength and conditioning exercises and cycling at a constant pace, i.e., riding at 70%PPO until the cyclist become fatigued; and may be indiscernible where cyclists have the option to change the amount of power distributed throughout an exercise, also known as riding at a self-selected pace during the TT. As a result, it needs to be acknowledged that the differences in exercise tasks from the current study and the literature may be the cause of divergent findings.
tDCS Considerations
of tDCS intensity, i.e., cathodal stimulation of 1.0mA to 2.0mA, does not necessarily increase to efficacy of stimulation, but instead, shifts the direction of excitability (Batsikadze et al., 2013). Since the effects of tDCS intensity on cortical excitability are unclear, it is important for future research to examine the effects of tDCS using a range of stimulation intensities, on performance of a cycling TT.
It should also be acknowledged that tDCS could modulate neuronal activity in a relatively larger area than that directly targeted by the electrodes (Lang et al. 2005). Lang and colleagues (2005) examined if tDCS could alter regional neuronal activity in M1. Participants underwent anodal or cathodal stimulation to M1 for 10 minutes with the strength of the current set at 2.0mA as well as a sham condition. After tDCS, neuroimaging techniques, i.e., positron emission tomography, was used to observe changes in cerebral blood flow. Neuroimaging results showed that tDCS extended to other areas of the brain, known as a spatial effect. When compared to sham, anodal stimulation increased cerebral blood flow in cortical areas such as M1, sensory motor cortex, and somatosensory areas, and subcortical brain areas such as the red nucleus and reticular formation. Lang and colleagues (2005) concluded that tDCS provides localised changes under the area of the electrode, but also extends to other areas of the brain.
decreased cortical activity in this region. The right dorsolateral prefrontal cortex is involved in mood, emotion regulation and modulating fatigue, and accordingly is part of a system that regulates exercise tolerance and termination (Anguis et al., 2015). Possibly, an increase in cortical activity of M1 or left DLPFC from A-tDCS, which the literature has shown to reduce RPE and enhance athletic performance (Anguis et al., 2017; Lattari et al., 2016), could have been negatively counteracted by the placement of the cathode in this present study, decreasing excitability of the right dorsolateral prefrontal cortex. However, this study did not measure cortical excitability, and this is all speculative.
Practical Recommendations and Future Directions
Findings of this study have increased our understanding of the potential effect of tDCS to enhance cycling performance; based on the results of this study, do not support the use of tDCS in enhancing cycling performance (Business Insider, 2017). Furthermore, it is plausible to generalise the findings of this study to other athletic populations; however, this needs further testing. As acknowledged above, different types of exercises and tDCS protocols must be considered. Future research should explore whether tDCS applied to M1 and DLPFC for different durations and at different intensities affect cycling TT performance. Additionally, future research should consider other cortical areas possibly related to perceived exertion, and whether modulation of excitability in these areas with tDCS can affect athletic performance and RPE.
Additionally, this study speculated that tDCS could have spread to other areas of the brain, which may have counteracted effects on perceived exertion. The data obtained from this study cannot confirm whether this occurred, but the effects of tDCS onto other areas of the brain cannot be discounted. Future research should incorporate techniques such as neuroimaging techniques or transcranial magnetic stimulation, to determine if tDCS provided sufficient stimulation to the cortical areas targeted, or if tDCS migrated to other cortical areas. Secondly, it should be acknowledged that when tDCS is applied for longer than 10 minutes, changes in excitability occur up to an hour (Nitsche & Paulus, 2001). In this study, tDCS was applied prior exercise procedures and not during. If tDCS did modulate cortical excitability, it is possible that changes in cortical activity would not have lasted throughout the cycling 16.1km TT, since participants also had to complete a 10-minute warm-up prior cycling TT. Future studies should consider applying tDCS during the exercise protocol, rather than prior to the exercise protocol.
Lastly, it should be recognised that in examining athletic performance, we applied A-tDCS to M1 and DLPFC compared to an active control site, V1. When the goal is to demonstrate that stimulation of a cortical area induces a particular effect, an active control site is used; this is, stimulation over an area irrelevant for the task under study (Woods et al., 2015). However, previous research that examined athletic performance often used A-tDCS to M1 or DLPFC compared to sham. During sham, A-tDCS currents are passed through electrodes for a brief period, such as 30 seconds. This type of stimulation does not appear to alter the brains function and acts as a control condition (Nitsche et al., 2008). A sham condition provides a baseline to compare the effects from applying A-tDCS to M1 and DLPFC (Nitsche et al., 2008). Thus, future research should use a sham condition to examine the efficacy of tDCS, as well as an active control site.
References
Abbiss, C. R., & Laursen, P. B. (2005). Models to explain fatigue during prolonged endurance cycling. Sports Medicine, 35(10), 865-898. Retrieved from https://link.springer.com/journal/40279
Abbiss, C. R., Peiffer, J. J., Meeusen, R., & Skorski, S. (2015). Role of ratings of perceived exertion during self-paced exercise: What are we actually measuring?
Sports Medicine, 45(9), 1235-1243. doi:10.1007/s40279-015-0344-5
Amadi, U., Ilie, A., Johansen-Berg, H., & Stagg, C. J. (2014). Polarity-specific effects of motor transcranial direct current stimulation on fMRI resting state networks.
Neuroimage, 88(100), 155-161. doi:10.1016/j.neuroimage. 2013.11.037 Angius, L., Hopker, J. G., Marcora, S. M., & Mauger, A. R. (2015). The effect of
transcranial direct current stimulation of the motor cortex on exercise-induced pain. European Journal of Applied Physiology, 115(11), 2311-2319. doi: 10.1007/s00421-015-3212-y
Angius, L., Mauger, A. R., Hopker, J., Pascual-Leone, A., Santarnecchi, E., & Marcora, S. M. (2017). Bilateral extracephalic transcranial direct current stimulation improves endurance performance in healthy individuals. Brain Stimulation. doi:10.1016/j.brs.2017.09.017
Angius, L., Pageaux, B., Hopker, J., Marcora, S. M., & Mauger, A. R. (2016).
Transcranial direct current stimulation improves isometric time to exhaustion of the knee extensors. Neuroscience, 339, 363-375. doi:10.1016/j.neuro
science.2016.10.028
Antal, A., Terney, D., Kuhnl, S., & Paulus, W. (2010). Anodal transcranial direct current stimulation of the motor cortex ameliorates chronic pain and reduces short intracortical inhibition. Journal of Pain Symptom Management, 39(5), 890-903. doi:10.1016/j.jpainsymman.2009.09.023
Atkinson, G., & Brunskill, A. (2000). Pacing strategies during a cycling time trial with simulated headwinds and tailwinds. Ergonomics, 43(10), 1449-1460. doi: 10.1080/001401300750003899
Batsikadze, G., Moliadze, V., Paulus, W., Kuo, M.F., & Nitsche, M. A. (2013). Partially non-linear stimulation intensity-dependent effects of direct current stimulation on motor cortex excitability in humans. The Journal of Physiology, 591(Pt 7), 1987–2000. doi:10.1113/jphysiol.2012.249730
Beam, W., Borckardt, J. J., Reeves, S. T., & George, M. S. (2009). An efficient and accurate new method for locating the F3 position for prefrontal TMS
applications. Brain Stimulation, 2(1), 50-54. doi: 10.1016/j.brs.2008.09.006 Bellinger, P., & Minahan, C. (2014). Reproducibility of a laboratory based 1-km
wattbike cycling time trial in competitive cyclists. Journal of Science and Cycling, 3(3), 23–28. Retrieved from http://www.jsc-journal.com/ojs/
Berchicci, M., Menotti, F., Macaluso, A., & Di Russo, F. (2013). The neurophysiology of central and peripheral fatigue during sub-maximal lower limb isometric contractions. Frontiers in Human Neuroscience, 7, 135. doi:10.3389/fnhum .2013.00135
Borg, G. (1990). Psychophysical scaling with applications in physical work and the perception of exertion. Scandavian Journal of Work, Environment, and Health, 16(1), 55-58. Retrieved from http://www.sjweh.fi/
Boros, K., Poreisz, C., Munchau, A., Paulus, W., & Nitsche, M. A. (2008). Premotor transcranial direct current stimulation (tDCS) affects primary motor excitability in humans. European Journal of Neuroscience, 27(5), 1292-1300. doi:10.1111 /j.1460-9568.2008.06090.x
Borresen, J., & Lambert, M. I. (2009). The quantification of training load, the training response and the effect on performance. Journal of Sports Medicine, 39(9), 779-795. doi:10.2165/11317780-000000000-00000
Business Insider. (2017). America's top cyclist entering the Tour de France has been using a portable brain stimulator to try to gain an edge, and he says it actually
works. Retrieved from http://www.businessinsider.com/tour-de-france-cyclist-talansky-halo-neuroscience-headset-technology-2017-6/?r=AU&IR=T
Chen, M. J., Fan, X., & Moe, S. T. (2002). Criterion-related validity of the borg ratings of perceived exertion scale in healthy individuals: A meta-analysis. Journal of Sports Science, 20(11), 873-899. doi: 10.1080/026404102320761787
Chen, Y. L., Chen, C. C., Hsia, P. Y., & Lin, S. K. (2013). Relationships of Borg's RPE 6-20 scale and heart rate in dynamic and static exercises among a sample of young Taiwanese men. Perceptual Motor Skills, 117(3), 971-982. doi:10.2466 /03.08.PMS.117x32z6
Cogiamanian, F., Marceglia, S., Ardolino, G., Barbieri, S., & Priori, A. (2007).
Improved isometric force endurance after transcranial direct current stimulation over the human motor cortical areas. European Journal of Neuroscience, 26(1), 242-249. doi:10.1111/j.1460-9568.2007.05633.x
Cohen, J. (1988). Statistical power analysis for the behavioral sciences. New York, NY: Routledge Academic.
Cohen, J., Reiner, B., Foster, C., de Koning, J. J., Wright, G., Doberstein, S. T., & Porcari, J. P. (2013). Breaking away: Effects of nonuniform pacing on power output and growth of rating of perceived exertion. International Journal of Sports Physiology Performance, 8(4), 352-357.doi:10.1123/ijspp.8.4.352 Crouter, S. E., Antczak, A., Hudak, J. R., DellaValle, D. M., & Haas, J. D. (2006).
Accuracy and reliability of the parvomedics trueone 2400 and medgraphics VO2000 metabolic systems. European Journal of Applied Physiology, 98(2), 139-151. doi:10.1007/s00421-006-0255-0
Das, S., Holland, P., Frens, M. A., & Donchin, O. (2016). Impact of transcranial direct current stimulation (tDCS) on neuronal Functions. Frontiers in Neuroscience, 10, 550. doi:10.3389/fnins.2016.00550
de Jong, J., van der Meijden, L., Hamby, S., Suckow, S., Dodge, C., de Koning, J. J., & Foster, C. (2015). Pacing strategy in short cycling time trials. International Journal of Sports Physiology Performance, 10(8), 1015-1022. doi:
10.1123/ijspp.2014-009
de Koning, J. J., Foster, C., Bakkum, A., Kloppenburg, S., Thiel, C., Joseph, T., . . . Porcari, J. P. (2011). Regulation of pacing strategy during athletic competition.
PLoS ONE, 6(1), e15863. doi:10.1371/journal.pone.0015863
fatigue on pacing and time trial performance. European Journal of Applied Physiology, 113(9), 2371-2380. doi:10.1007/s00421-013-2673-0
de Morree, H. M., Klein, C., & Marcora, S. M. (2012). Perception of effort reflects central motor command during movement execution. Psychophysiology, 49(9), 1242-1253. doi:10.1111/j.1469-8986.2012.01399.x
Ekblom, B., & Goldbarg, A. N. (1971). The influence of physical training and other factors on the subjective rating of perceived exertion. Acta Physiologica Scandinavica, 83(3), 399-406. doi:10.1111/j.1748-1716.1971.tb05093.x Faulkner, J., Parfitt, G., & Eston, R. (2008). The rating of perceived exertion during
competitive running scales with time. Psychophysiology, 45(6), 977-985. doi: 10.1111/j.1469-8986.2008.00712.x
Fregni, F., Boggio, P. S., Nitsche, M., Bermpohl, F., Antal, A., Feredoes, E., . . . Pascual-Leone, A. (2005). Anodal transcranial direct current stimulation of prefrontal cortex enhances working memory. Experimental Brain Research, 166(1), 23-30. doi:10.1007/s00221-005-2334-6
Fujiyama, H., Hinder, M. R., Barzideh, A., Van de Vijver, C., Badache, A. C.,
Manrique-C, M. N., . . . Swinnen, S. P. (2017). Preconditioning tDCS facilitates subsequent tDCS effect on skill acquisition in older adults. Neurobiology of Aging, 51(1), 31-42. doi:10.1016/ j.neurobiolaging.2016.11.012
Gandevia, S. C. (2001). Spinal and supraspinal factors in human muscle fatigue.
Physiological Reviews, 81(4), 1725-1789. Retrieved from http://physrev. physiology.org/
Girden, E. R. (1992). ANOVA: Repeated Measures. Newbury, US: Sage Publications, Inc
assumptions underlying the fixed effects analyses of variance and covariance.
Review of Educational Research, 42(3), 237-288. doi:10.3102/003465430 42003237
Green, J. M., McLester, J. R., Crews, T. R., Wickwire, P. J., Pritchett, R. C., & Lomax, R. G. (2006). RPE association with lactate and heart rate during high-intensity interval cycling. Medicine Science of Sports Exercise, 38(1), 167-172.
doi:10.1249/01.mss.0000180359.98241.a2
Green, J. M., McLester, J. R., Crews, T. R., Wickwire, P. J., Pritchett, R. C., & Redden, A. (2005). RPE-lactate dissociation during extended cycling. European Journal of Applied Physiology, 94(1-2), 145-150. doi:10.1007/s00421-004-1311-2 Halper, J., Yagi, C., Manevitz, A., Nishimoto, K., & Onishi, A. Comparison of beam
technique and 5.5 centimeter rule for determing site of TMS stimulation for major depressive disorder. Brain Stimulation: Basic, Translational, and Clinical Research in Neuromodulation, 9(5), e3. doi:10.1016/j.brs.2016.06.012
Halson, S. L. (2014). Monitoring training load to understand fatigue in athletes. Sports Medicine, 44(Suppl 2), 139-147. doi:10.1007/s40279-014-0253-z
Harwell, M., Rubinstein, E., Hayes, W., & Olds, C. (1992). Summarizing monte carlo
results in methodological research: The one- and two-factor fixed effects
ANOVA cases. Journal of Educational Statistics,17(4), 315-339.
doi:10.2307/1165127
Hopkins, W. G. (2000). Measures of reliability in sports medicine and science. Sports Medicine, 30(1), 1-15. doi:10.2165/00007256-200030010-00001
Hou, L. J., Song, Z., Pan, Z. J., Cheng, J. L., Yu, Y., & Wang, J. (2016). Decreased activation of subcortical brain areas in the motor fatigue state: An fMRI Study.
Hsu, W. Y., Ku, Y., Zanto, T. P., & Gazzaley, A. (2015). Effects of noninvasive brain stimulation on cognitive function in healthy aging and Alzheimer's disease: A systematic review and meta-analysis. Neurobiological Aging, 36(8), 2348-2359. doi:10.1016/j.neurobiolaging.2015.04.016
Hughes, L., & Leavey, G. (2012). Setting the bar: Athletes and vulnerability to mental illness. British Journal of Psychiatry, 200(2), 95-96. doi:10.1192/bjp
.bp.111.095976
Jacobson, L., Koslowsky, M., & Lavidor, M. (2012). tDCS polarity effects in motor and cognitive domains: A meta-analytical review. Experimental Brain Research, 216(1), 1-10. doi:10.1007/s00221-011-2891-9
Jeffery, D. T., Norton, J. A., Roy, F. D., & Gorassini, M. A. (2007). Effects of
transcranial direct current stimulation on the excitability of the leg motor cortex.
Experimental Brain Research, 182(2), 281-287. doi:10.1007/s00221-007-1093-y Jones, H. S., Williams, E. L., Marchant, D. C., Sparks, S. A., Bridge, C. A., Midgley, A. W., & Mc Naughton, L. R. (2016). Deception has no acute or residual effect on cycling time trial performance but negatively effects perceptual responses.
Journal of Science Medicine Sport, 19(9), 771-776. doi:10.1016/j.jsams. 2015.12.006
Jones, H. S., Williams, E. L., Marchant, D., Sparks, S. A., Midgley, A. W., Bridge, C. A., & McNaughton, L. (2015). Distance-dependent association of affect with pacing strategy in cycling time trials. Medicine Science Sports Exercise, 47(4), 825-832. doi:10.1249/mss.0000000000000475
3-6. Retrieved from http://www.sciencedirect.com/science/journal/00134694 ?sdc=1
Koivula, N., Hassmén, P., & Fallby, J. (2002). Self-esteem and perfectionism in elite athletes: Effects on competitive anxiety and self-confidence. Personality and Individual Differences, 32(5), 865-875. doi:10.1016/S0191-8869(01)00092-7 Lang, N., Siebner, H. R., Ward, N. S., Lee, L., Nitsche, M. A., Paulus, W., . . .
Frackowiak, R. S. (2005). How does transcranial DC stimulation of the primary motor cortex alter regional neuronal activity in the human brain? European Journal of Neuroscience, 22(2), 495-504.
doi:10.1111/j.1460-9568.2005.04233.x
Lattari, E., Andrade, M. L., Filho, A. S., Moura, A. M., Neto, G. M., Silva, J. G., . . . Machado, S. (2016). Can transcranial direct current stimulation improve the resistance strength and decrease the rating perceived scale in recreational weight-training experience? Journal of Strength and Conditioning Research, 30(12), 3381-3387. doi:10.1519/jsc.0000000000001457
Leung, M. L., Chung, P. K., & Leung, R. W. (2002). An assessment of the validity and reliability of two perceived exertion rating scales among hong kong children.
Perception Motor Skills, 95(3), 1047-1062. doi:10.2466/pms.2002.95.3f.1047 Liu, J. Z., Dai, T. H., Sahgal, V., Brown, R. W., & Yue, G. H. (2002). Nonlinear
cortical modulation of muscle fatigue: A functional MRI study. Brain Research, 957(2), 320-329. doi:10.1016/S0006-8993(02)03665-X
Macfarlane, D. J., & Wu, H. L. (2013). Inter-unit variability in two parvomedics trueone 2400 automated metabolic gas analysis systems. European Journal of Applied Physiology, 113(3), 753-762. doi:10.1007/s00421-012-2483-9
Downar, J. (2015). Concordance between beamF3 and MRI-neuronavigated target sites for repetitive transcranial magnetic stimulation of the left
dorsolateral prefrontal cortex. Brain Stimulation, 8(5), 965-973. doi: 10.1016/j.brs.2015.05.008
Nitsche, M. A., & Paulus, W. (2000). Excitability changes induced in the human motor cortex by weak transcranial direct current stimulation. Journal of Physiology, 527 Pt 3, 633-639. Retrieved from http://physoc.onlinelibrary.wiley.com/hub/ journal/10.1111/(ISSN)1469-7793/
Nitsche, M. A., & Paulus, W. (2001). Sustained excitability elevations induced by transcranial DC motor cortex stimulation in humans. Neurology, 57(10), 1899-1901. doi:10.1212/WNL.57.10.1899
Nitsche, M. A., Cohen, L. G., Wassermann, E. M., Priori, A., Lang, N., Antal, A., . . . Pascual-Leone, A. (2008). Transcranial direct current stimulation: State of the art 2008. Brain Stimulation, 1(3), 206-223. doi:10.1016/j.brs.2008.06.004
NyVelocity. (2007). Lactate and Vo2 Max test at Cadence [photograph]. Retrieved from http://nyvelocity.com/articles/coachingfitness/lactate-and-vo2-max-test-at-cadence/
Okano, A. H., Fontes, E. B., Montenegro, R. A., Farinatti Pde, T., Cyrino, E. S., Li, L. M., . . . Noakes, T. D. (2015). Brain stimulation modulates the autonomic nervous system, rating of perceived exertion and performance during maximal exercise. British Journal of Sports Medicine, 49(18), 1213-1218. doi:10.1136/ bjsports-2012-091658
Paton, C. D., & Hopkins, W. G. (2001). Tests of cycling performance. Sports Medicine, 31(7), 489-496. doi:10.2165/00007256-200131070-00004
cycling time-trial performance. International Journal of Sports Physiology Performance, 6(2), 208-220. doi:10.1123/ijspp.6.2.208
Pinto, S. S., Alberton, C. L., Zaffari, P., Cadore, E. L., Kanitz, A. C., Liedtke, G. V., . . . Kruel, L. F. (2015). Rating of perceived exertion and physiological responses in water-based exercise. Journal of Human Kinetics, 49, 99-108. doi:10.1515 /hukin-2015-0112
Raimundo, R. J., Uribe, C. E., & Brasil-Neto, J. P. (2012). Lack of clinically detectable acute changes on autonomic or thermoregulatory functions in healthy subjects after transcranial direct current stimulation (tDCS). Brain Stimulation, 5(3), 196-200. doi:10.1016/j.brs.2011.03.009
Shortz, A. E., Pickens, A., Zheng, Q., & Mehta, R. K. (2015). The effect of cognitive fatigue on prefrontal cortex correlates of neuromuscular fatigue in older women. Journal of NeuroEngineering and Rehabilitation, 12, 115. doi:10.1186/s12984-015-0108-3
Sparks, S., Williams, E., Jones, H., Bridge, C., Marchant, D., & McNaughton, L. (2016). Test-retest reliability of a 16.1 km time trial in trained cyclists using the computrainer ergometer. Journal Of Science And Cycling, 5(3), 35-41. Retrieved from http://www.jscjournal.com/
Stagg, C. J., & Nitsche, M. A. (2011). Physiological basis of transcranial direct current stimulation. Neuroscientist, 17(1), 37-53. doi:10.1177/1073858410386614 Tabachnick, B. G., & Fidell, L. S. (2007). Experimental design using ANOVA. Belmont,
CA: Thomson, Brookes & Cole
Tanaka, M., & Watanabe, Y. (2012). Supraspinal regulation of physical fatigue.
Tanaka, M., Ishii, A., & Watanabe, Y. (2013). Neural mechanism of facilitation system during physical fatigue. PLoS ONE, 8(11), e80731. doi:
10.1371/journal.pone.0080731
Tanaka, M., Ishii, A., & Watanabe, Y. (2016). Roles of the right dorsolateral prefrontal cortex during physical fatigue: A magnetoencephalographic study. Fatigue: Biomedicine, Health & Behavior, 4(3), 146-157. doi:10.1080/216418 46.2016.1175179
Tanaka, S., Hanakawa, T., Honda, M., & Watanabe, K. (2009). Enhancement of pinch force in the lower leg by anodal transcranial direct current
stimulation. Experimental Brain Research, 196(3), 459–465. doi:10.1007/s 00221-009-1863-9
Taylor, J. L., & Gandevia, S. C. (2008). A comparison of central aspects of fatigue in submaximal and maximal voluntary contractions. Journal of Applied
Physiology, 104(2), 542-550. doi:10.1152/japplphysiol.01053.2007 TotaltDCS. (2015). tDCS Montage Guide [photograph]. Retrieved from
http://totaltdcs.com/
Tucker, R. (2009). The anticipatory regulation of performance: The physiological basis for pacing strategies and the development of a perception-based model for exercise performance. British Journal of Sports Medicine, 43(6), 392-400. doi: 10.1136/bjsm.2008.050799
Vancleef, K., Meesen, R., Swinnen, S. P., & Fujiyama, H. (2016). tDCS over left M1 or DLPFC does not improve learning of a bimanual coordination task. Scientific Report, 6(35739). doi:10.1038/srep35739