124
Volume-4, Issue-4, August-2014,
ISSN No.: 2250-0758
International Journal of Engineering and Management Research
Available at:
www.ijemr.net
Page Number: 124-129
Examination of Consumer Price Index in India – Rural versus Urban
Dipankar Das1, Rimu Chaudhuri2, Suman Kumar Bedajna3
1Lecturer, The Heritage Academy, Kolkata, INDIA 2
Assistant Professor, Heritage Business School, Kolkata, INDIA
3
Assistant Professor, The Heritage Academy, Kolkata, INDIA
ABSTRACT
For the last 66 years Indian economy has gone through many phases. The development of both rural and urban India has taken place indeed but the debate of rural versus urban or in other words India versus Bharat is still very relevant and contemporary. The Consumer Price Index (CPI) is an important economic indicator. In this paper, the authors have examined the CPI of India from January, 2011 to April, 2014 (40 months) to identify whether both rural and urban India exhibit the same economic pattern or not. The authors have observed that the distribution of CPI is different in rural and urban India in ‗recreation and amusement‘, ‗transport and communication‘ and ‗household requisites‘. It is well known that dual economy is an important theory in economics. The findings of this paper certainly spark the question in our minds – ―Are we living in a dual economy in India‖.
Keywords—Consumer Price Index, CPI, Non Parametric, Mann–Whitney U test, Rural, Urban.
I.
INTRODUCTION
There are always very close links between rural and urban areas. According to Pundir and Singh (2001), “Rural–urban linkages are both a cause and a consequence of socio–economic development.” [1]. Lesetedi (2003) stated, “Urban–rural linkages can be understood as the structural social relationships maintained between individuals in the urban environment and those in rural areas” [2]. Tacoli (1998) pointed out that there are two categories of rural–urban interactions – (i) linkages across space which means flow of people, money, goods, information & waste and (ii) sectoral interactions [3]. As per Tacoli (1998) sectoral interactions include, “rural activities taking place in urban areas (such as urban agriculture) or activities often classified as urban (such as manufacturing and services) taking place in rural areas” [3].
It is evident that rural–urban link plays an important role in the growth of the national economy
especially in the field of income and employment generation and thus creating wealth for the nation. As a nation, therefore it becomes an important and crucial task for us to properly nurture and balance this linkage for the development of the overall economy of the country. In today‟s date the big word is „Inflation‟. We all know when the overall price level of goods and services increases in the economy that‟s „inflation‟. Consumer Price Index (CPI) is one of the instruments for measuring inflation. In recent years, we have observed that the price of commodities be it essential or otherwise rose sharply across the nation affecting all of us.
In this study the authors have explored the Consumer Price Index (CPI) of India which is an important economic indicator to investigate the economic conditions of rural and urban India. We often ask a very common question – “Does both rural and urban India exhibit the same economic pattern”. In this paper the authors have examined and analyzed the monthly CPI data of different commodities using statistical measures to find the answer of the above question.
II.
RELATED WORK
According to Patnaik, Shah and Verones (2011), “The CPI reflects the consumption bundle of households, and is thus more relevant than any other measure of inflation” [4].
Brandt and Holz (2006) stated, “Prices differ across space: from province to province, from rural (or urban) areas in one province to rural (or urban) areas in another province, and from rural to urban areas within one province. Systematic differences in prices across a range of goods and services in different localities imply regional differences in the costs of living.” [5].
125
Ravallion and Datt (2002) pointed out, “Theelasticities of measured poverty to farm yields and development spending did not differ significantly across states. But the elasticities of poverty to (urban and rural) non-farm output varied appreciably, and the differences were quantitatively important to the overall rate of poverty reduction” [7].
Pons‟s (2011) study tries to find out “which households are the most vulnerable to rising food prices” [8]. According to Pons (2011) “there are differential impacts on different categories of households. Rural households are more vulnerable than urban households. In addition, the poorest households of both sectors are more penalized by rising food price than the richest households. The impact depends also on the commodity which price has increased.” [8].
Kumar and Boopathy (n.d.) stated, “Consumer Price Indices (CPI) released at national level are CPI for Industrial Workers (IW), CPI for Agricultural Labourers
(AL)/ Rural Labourers (RL) and CPI
(Rural/Urban/Combined)” [9]. According to Kumar and Boopathy (n.d.) for data collection of CPI (Rural), “From each district, two villages were selected. However, in case of some states with higher population but lesser number of districts, additional villages have been selected.” [9]. Kumar and Boopathy (n.d.) also stated for data collection of CPI (Urban), “All cities/towns having population (2001 Population Census) of more than 9 lakh and all state/UT capitals not covered therein were selected and other towns were selected randomly.” [9].
III.
OBJECTIVES OF THE STUDY
(i) To identify the products and items whose consumer price index (CPI) are same across sectors i.e. Rural and Urban India. (ii) To identify the products and items whose consumer price index (CPI) are different across sectors i.e. Rural and Urban India.
IV.
HYPOTHESIS
Null Hypothesis: The distribution of Consumer Price Index (CPI) of different products and items are same across categories of sectors i.e. Rural and Urban India.
Alternative Hypothesis: The distribution of Consumer Price Index (CPI) of different products and items are different across categories of sectors i.e. Rural and Urban India.
V.
RESEARCH METHODOLOGY
In this research we have analyzed the Consumer Price Index of different items in Rural and Urban India. We have used the monthly data from January, 2011 to April, 2014 (Total 40 months). The dataset is collected from Government of India website [10]. In this study we have selected twenty five (25) test variables and one
grouping variable. They are listed in the following tables (TABLE I & TABLE II).
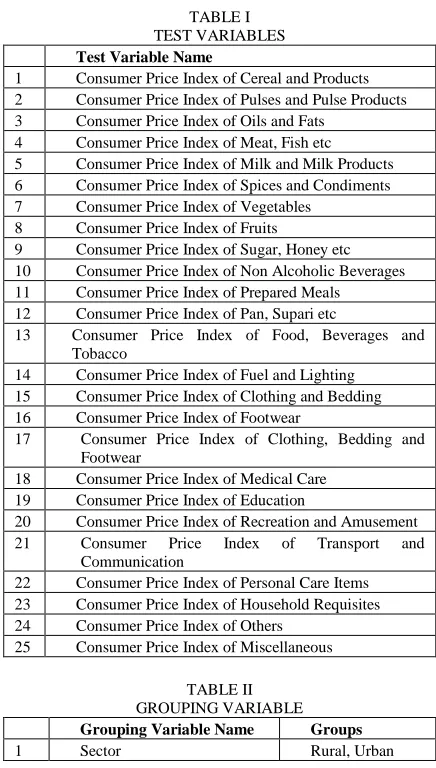
TABLE I TEST VARIABLES
Test Variable Name
1 Consumer Price Index of Cereal and Products 2 Consumer Price Index of Pulses and Pulse Products 3 Consumer Price Index of Oils and Fats
4 Consumer Price Index of Meat, Fish etc 5 Consumer Price Index of Milk and Milk Products 6 Consumer Price Index of Spices and Condiments 7 Consumer Price Index of Vegetables
8 Consumer Price Index of Fruits
9 Consumer Price Index of Sugar, Honey etc 10 Consumer Price Index of Non Alcoholic Beverages 11 Consumer Price Index of Prepared Meals 12 Consumer Price Index of Pan, Supari etc
13 Consumer Price Index of Food, Beverages and Tobacco
14 Consumer Price Index of Fuel and Lighting 15 Consumer Price Index of Clothing and Bedding 16 Consumer Price Index of Footwear
17 Consumer Price Index of Clothing, Bedding and Footwear
18 Consumer Price Index of Medical Care 19 Consumer Price Index of Education
20 Consumer Price Index of Recreation and Amusement
21 Consumer Price Index of Transport and
Communication
22 Consumer Price Index of Personal Care Items 23 Consumer Price Index of Household Requisites 24 Consumer Price Index of Others
25 Consumer Price Index of Miscellaneous
TABLE II GROUPING VARIABLE
Grouping Variable Name Groups
1 Sector Rural, Urban
For the purpose of data analysis we have used Mann–Whitney U test which is a non parametric method to determine whether any difference exists between two (2) independent groups. In this study the independent groups are „Rural‟ and „Urban‟ as shown in Table 2. We have calculated the Mann–Whitney U value, z–score and Asymptotic significance for each test variables. The significance level is .05. Using the z–score the effect size (r) is calculated using the formula [11] shown below.
Effect size, r = Z/√N, where N is the size of the study and Z is the z–score.
The decision rule is as follows: if |calculated z| ≥ z tabulated, then the null hypothesis is rejected otherwise the null hypothesis is retained [12]. In this study we have selected α=0.05 for which |z tabulated| is 1.96 [15]. As regards the effect size is concerned, the thumb rule of Cohel suggest that an effect size of |.1| represents a small effect, an effect size of |.3| represents a medium effect and an effect size of |.5| represents a large effect size [12][13][14].
126
VI.
DATA ANALYSIS & FINDINGS
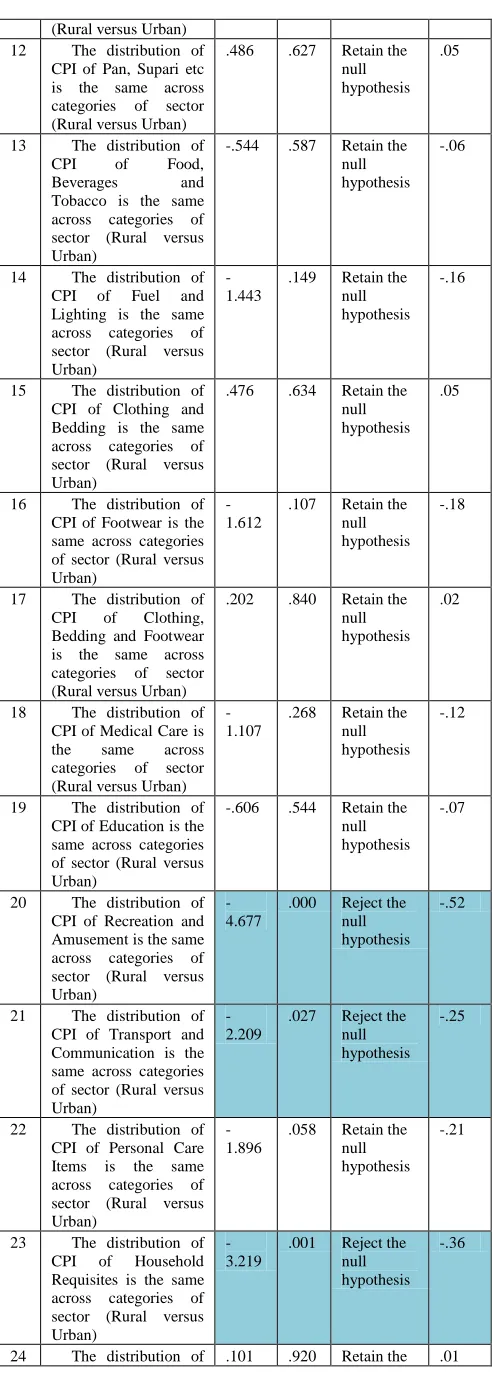
The hypothesis test summary and effect size is given in the following table (TABLE III) –
TABLE III
HYPOTHESIS TEST SUMMARY AND EFFECT SIZE
Null Hypothesis Z – score
Sig. Decision Effec t Size
1 The distribution of CPI of Cereal and Products is the same across categories of sector (Rural versus Urban)
-1.703
.088 Retain the null hypothesis
-.19
2 The distribution of CPI of Pulses and Pulse Products is the same across categories of sector (Rural versus Urban)
-1.068
.285 Retain the null hypothesis
-.12
3 The distribution of CPI of Oils and Fats is
the same across
categories of sector (Rural versus Urban)
1.400 .161 Retain the null hypothesis
.16
4 The distribution of CPI of Meat, Fish etc is
the same across
categories of sector (Rural versus Urban)
.024 .981 Retain the null hypothesis
.00
5 The distribution of CPI of Milk and Milk Products is the same across categories of sector (Rural versus Urban)
-1.314
.189 Retain the null hypothesis
-.15
6 The distribution of CPI of Spices and Condiments is the same across categories of sector (Rural versus Urban)
-.943 .346 Retain the null hypothesis
-.11
7 The distribution of CPI of Vegetables is
the same across
categories of sector (Rural versus Urban)
-1.371
.170 Retain the null hypothesis
-.15
8 The distribution of CPI of Fruits is the same across categories of sector (Rural versus Urban)
-.760 .447 Retain the null hypothesis
-.08
9 The distribution of CPI of Sugar, Honey etc is the same across categories of sector (Rural versus Urban)
-1.299
.194 Retain the null hypothesis
-.15
10 The distribution of CPI of Non Alcoholic Beverages is the same across categories of sector (Rural versus Urban)
-.019 .985 Retain the null hypothesis
.00
11 The distribution of CPI of Prepared Meals is the same across categories of sector
.284 .777 Retain the null hypothesis
.03
(Rural versus Urban) 12 The distribution of
CPI of Pan, Supari etc is the same across categories of sector (Rural versus Urban)
.486 .627 Retain the null hypothesis
.05
13 The distribution of
CPI of Food,
Beverages and
Tobacco is the same across categories of sector (Rural versus Urban)
-.544 .587 Retain the null hypothesis
-.06
14 The distribution of CPI of Fuel and Lighting is the same across categories of sector (Rural versus Urban)
-1.443
.149 Retain the null hypothesis
-.16
15 The distribution of CPI of Clothing and Bedding is the same across categories of sector (Rural versus Urban)
.476 .634 Retain the null hypothesis
.05
16 The distribution of CPI of Footwear is the same across categories of sector (Rural versus Urban)
-1.612
.107 Retain the null hypothesis
-.18
17 The distribution of CPI of Clothing, Bedding and Footwear is the same across categories of sector (Rural versus Urban)
.202 .840 Retain the null hypothesis
.02
18 The distribution of CPI of Medical Care is
the same across
categories of sector (Rural versus Urban)
-1.107
.268 Retain the null hypothesis
-.12
19 The distribution of CPI of Education is the same across categories of sector (Rural versus Urban)
-.606 .544 Retain the null hypothesis
-.07
20 The distribution of CPI of Recreation and Amusement is the same across categories of sector (Rural versus Urban)
-4.677
.000 Reject the null hypothesis
-.52
21 The distribution of CPI of Transport and Communication is the same across categories of sector (Rural versus Urban)
-2.209
.027 Reject the null hypothesis
-.25
22 The distribution of CPI of Personal Care Items is the same across categories of sector (Rural versus Urban)
-1.896
.058 Retain the null hypothesis
-.21
23 The distribution of CPI of Household Requisites is the same across categories of sector (Rural versus Urban)
-3.219
.001 Reject the null hypothesis
-.36
127
CPI of Others is thesame across categories of sector (Rural versus Urban)
null hypothesis
25 The distribution of CPI of Miscellaneous is the same across categories of sector (Rural versus Urban)
-1.939
.052 Retain the null hypothesis
-.22
(Asymptotic significances are displayed. The significance level is .05)
From the above table (TABLE III) we may observe that the Consumer Price Index (CPI) of „Cereal and products‟, „Pulses and Pulse Products‟, „Oils and Fats‟, „Meat, Fish etc‟, „Milk and Milk Products‟, „Spices and Condiments‟, „Vegetables‟, „Fruits‟, „Sugar, Honey etc‟, „Non Alcoholic Beverages‟, „Prepared Meals‟, „Pan, Supari etc‟, „Food, Beverages and Tobacco‟, „Fuel and Lighting‟, „Clothing and Bedding‟, „Footwear‟, „Clothing, Bedding and Footwear‟, „Medical Care‟, „Education‟, „Personal Care‟, „Others‟ and „Miscellaneous‟ items in Rural India did not significantly differ than in Urban India. However, the Consumer Price Index of „Recreation and Amusement‟ in Rural India (Median = 114) were significantly more than Urban (Median = 105.85) India, U
= 314.00, z = -4.677, p = .000, r = -.52. The Consumer Price Index of „Transport and Communication‟ in Rural India (Median = 121) were significantly more than Urban (Median = 116.65) India, U = 570.50, z = -2.209, p = .027,
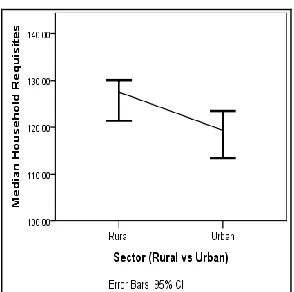
r = -.25. We also observe that the Consumer Price Index of „Household Requisites‟ in Rural India (Median = 127.55) were significantly more than Urban (Median = 119.35) India, U = 465.50, z = -3.219, p = .001, r = -.36.
This represents a small to medium effect for the Consumer Price Index of Transport and Communication (Effect size = -.25), a medium effect for the Consumer Price Index of Household Requisites (Effect size = -.36) and a large effect for the Consumer Price Index of Recreation and Amusement (Effect size = -.52).
The graphical representations of the items where Consumer Price Index (CPI) were significantly different across categories of sectors (Rural versus Urban) are illustrated below:
Figure 1: Mann – Whitney U test of CPI of Recreation and Amusement across categories of sector
Figure 2: Median of CPI of Recreation and Amusement across categories of sector
Figure 3: Mann – Whitney U test of CPI of Transport and Communication across categories of sector
Figure 4: Median of CPI of Transport and Communication across categories of sector
128
Figure 6: Median of CPI of Household Requisites acrosscategories of sector
VII. LIMITATIONS
In this research the authors have only explored the dataset of Consumer Price Index of different commodities in India and performed a well known non parametric test i.e. Mann–Whitney U test to identify the difference between rural and urban India. The results thus obtained no doubt give us a true insight into the story but we have not done any cause effect analysis in this study.
VIII. CONCLUSION
To conclude with we can say, the above results clearly show us that though for most of the commodities the distribution of Consumer Price Index (CPI) remain same across categories of sector i.e. rural and urban but there exists at least three (3) distinct areas where this is not so. In this study, the authors have found that for the given dataset the distribution of CPI is different in rural and urban India in the areas like „recreation and amusement‟, „transport and communication‟ and „household requisites‟. The study also reveals that in all these three (3) areas the Rural–CPI is significantly more than Urban–CPI.
These results again spark the age old debate of Rural versus Urban and to be very precise the more contemporary India versus Bharat debate. As a nation „We‟
need to progress and when we say „We‟ it means the entire
nation – both rural and urban India but when we cross examine the economic indicator CPI of India from January, 2011 to April, 2014 (40 months) we surprisingly found that the economic pattern in urban and rural India is not same in all the fields in this given time period. In this case, we have done our research work on 40 months data and our conclusions are based on the statistical tests of these observations only. We cannot draw a holistic conclusion from here but this work certainly gives us the direction for future research with larger dataset.
It is evident that all these have a certain affect on the overall economic condition of the country and gives rise to some of the very important questions like “why this is happening” and “are we living in a dual economy in
India”. Finding answers to these important questions will certainly be our future endeavor.
REFERENCES
[1] Pundir, RS., & Singh, K. (2001, September). Rural-Urban Linkages and Socio Economic Development: A Case Study of Two Villages in Gujrat. Retrieved July 2014, from Institute of Rural Management Anand - Research Papers:
https://www.irma.ac.in/ipublications/publicationdetail.php ?cid=1&pid=978
[2] Lesetedi, G. N. (2003). Urban-rural linkages as an urban survival strategy among urban dwellers in Botswana: the case of Broadhurst residents. Journal of Political Ecology, 10, 37-46. Retrieved July 2014, from http://jpe.library.arizona.edu/volume_10/Lesetedi2003.pdf [3] Tacoli, C. (1998). Bridging the Divide: Rural-Urban interactions and livelihood strategies (Vol. Gatekeeper Series No 77). London, UK: International Institute for Environment and Development. Retrieved July 2014, from International Institute for Environment and Development – Bridging the Devide: Rural-Urban interactions and livelihood strategies: http://pubs.iied.org/6144IIED.html [4] Patnaik, I., Shah, A., & Veronese, G. (2011). How Should Inflation Be Measured in India? Economic & Political Weekly, XLVI (16), 55-64. Retrieved July 2014, from http://macrofinance.nipfp.org.in/PDF/how-to-measure-inflation-in-india.pdf
[5] Brandt, L., & Holz, C. A. (2006, October). Spatial Price Differences in China: Estimates and Implications.
Economic Development and Cultural Change , 43-86.
Retrieved July 2014, from
http://www.jstor.org/discover/10.1086/505722?uid=2&uid =4&sid=21104529746833
[6] Saith, A. (2007). Production, prices and poverty in rural India. The Journal of Development Studies , 17 (2), 196-213. Retrieved July 2014, from
http://www.tandfonline.com/doi/abs/10.1080/0022038810 8421788#.U9UwH1fHrIX
[7] Ravallion, M., & Datt, G. (2002). Why has economic growth been more pro-poor in some states of India than others? Journal of Development Economics, 68 (2),
381-400. Retrieved July 2014, from
http://www.sciencedirect.com/science/article/pii/S0304387 802000184
[8] Pons, N. (2011). Food and Prices in India: Impact of Rising Food Prices on Welfare. Centre de Sciences Humaines (Delhi), Delhi, India. Retrieved july 2014, from http://www.isid.ac.in/~pu/conference/dec_11_conf/Papers/
NathaliePons.pdf
[9] Kumar, A., & Boopathy, G. M. (n.d.). National price indices and inflation during 2012. Retrieved july 2014, from
http://mospi.nic.in/Mospi_New/upload/price_stat_8mar13. pdf
129
2014, from data.gov.in - Open Government Data (OGD)Platform India: http://www.data.gov.in/catalog/all-india-consumer-price-index-
ruralurban#web_catalog_tabs_block_10
[11] Field, A. (2009). Discovering Statistics Using SPSS (and sex and drugs and rock 'n' roll). London: SAGE Publication Ltd.
[12] Nachar, N. (2008). The Mann Whitney U: A Test for Assessing Whether Two Independent Samples Come from the Same Distribution. Tutorials in Quantitative Methods for Psychology, 4(1), 13-20. Retrieved July 2014, from http://www.tqmp.org/Content/vol04-1/p013/p013.pdf [13] Effect sizes. (n.d.). Retrieved July 2014, from Statistics for Psychology:
http://staff.bath.ac.uk/pssiw/stats2/page2/page14/page14.ht ml
[14] Boduszek, D. (n.d.). Statistical Analysis. Retrieved July 2014, from Dr Daniel Boduszek: http://www.danielboduszek.com/statistical-analysis [15] ConfInt - ConfInt.pdf. (n.d.). Retrieved July 2014, from
http://people.wku.edu/david.neal/109/Unit4/ConfInt.pdf