ISSN: 2306-9007 Gharaibeh (2015) 121
I
www.irmbrjournal.com March 2015I
nternationalR
eview ofM
anagement andB
usinessR
esearchVol. 4 Issue.1
R
M
B
R
Interaction of Size and Momentum Effects in
Jordan Firms: 2005-2014
OMAR GHARAIBEH
Al albayt University Jordon Email: [email protected]
Abstract
This study sought to disentangle the effects of size and whether there are size and momentum effects on Jordan firm returns. Initial findings showed that size effect has important role in explaining returns. For momentum effect, while in general there is no momentum effect in Jordan firm market, the study results founds that there is a strong evidence of momentum for the large-sized portfolios at Jordan firm returns. There is interaction between size and momentum. Two key findings emerge. First, there is a strong evidence for size effect. Second, the momentum premium is only evident for the large-sized portfolios.
Key Words: Fama and French, Large-Sized Portfolios.
Introduction
Over the past two decades, size and momentum effect has been considered a big challenge to efficient market theory, since in efficient markets the investor cannot achieve profit in the long- term by investing in stocks that have done well recently. In other words, According to efficient markets theory, investors cannot achieve additional returns without bearing additional risk.
One of the great challenges to the CAPM was presented by (Banz, 1981). Banz (1981) described a size effect in stock prices whereby small companies seemed to provide significantly higher monthly returns than did large firms even after adjusting for risk. For the period 1926-1975, the CAPM could not explain the significant differences in the returns between small and large firms. This result suggested that the CAPM is misspecifed (Banz, 1981). Reinganum (1981) confirmed Banz’s (1981) results using daily data over the period 1963-1977, as did Brown, Keim, Kleidon and Marsh (1983). Later studies including Fama and French (1992, 1993) and Reinganum (1999) also observed a size effect that could not be explained by the CAPM. Recently, van Dijk (2011) argued that the size effect has not disappeared. He suggested that it is premature to conclude that the size effect has gone away. Chou, Ho and Ko (2012) reported that the size effect is only significant for firms whose size is less than their industry’s average size.
Jegadeesh and Titman’s (1993) study is considered very important in a momentum literature. They revealed that a strategy of selling past losers and buying past winners generate significant positive return over one year holding period. However, Jegadeesh and Titman (1993) suggest that either serial correlation in industry return components or covariation in firm specific component generate momentum. Although Jegadeesh and Titman’s (1993) findings are well accepted, the source of the profits and the explanation of the evidence are considerably debated.
ISSN: 2306-9007 Gharaibeh (2015) 122
I
www.irmbrjournal.com March 2015I
nternationalR
eview ofM
anagement andB
usinessR
esearchVol. 4 Issue.1
R
M
B
R
subsumed by earnings momentum. Rouwenhorst (1998) show a comparable pattern of intermediate-horizon price momentum in twelve other countries, proposing that the impact is not likely based on a data snooping bias. Conrad and Kaul (1998) suggest hypothesis that are based on idea that momentum strategies earn positive returns on average either the expected return on stocks or both irregular or constant over time. Conrad and Kaul (1998) propose that the momentum effect is generated by cross-sectional differences in the unconditional mean returns of individual securities. In particular, they demonstrate that most of the trading profits arise from the serial correlation in industry return and this finding is consistent with Jegadeesh and Titman (1993).
Daniel, Hirshleifer and Subrahmanyam (1998) present behavioural explanation of return persistence and reversals suggesting that investors display overconfidence and self-attribution biases, especially in certain kinds of industries over time. Overconfidence among investors may be generated by the difficulty in estimating the value of new or changing industries. These investors are simultaneously employed in these sectors or avocation associated with these sectors, which overstates industry mispricing. Hong and Stein (1999) present another behavioural explanation of return persistence and reversals pointing out that an initial under-reaction to news can be generated by disseminating slow information into prices, but the existence of momentum traders searching to utilize the slow price movement generates following reversals.
In the US stock market, Moskowitz and Grinblatt (1999) show a strong and prevalent momentum industry effect. Industry momentum investment strategies generate high profit even after controlling for the cross-sectional distribution in mean returns, individual stock momentum, size, book-to-market equity and potential microstructure influence. They find that momentum investment strategies are significantly less profitable after controlling for industry momentum. Moskowitz and Grinblatt (1999) find that the individual stock momentum strategy provide an annual six percent return, while Jegadeesh and Titman (1993) document larger return than Moskowitz and Grinblatt’s (1999) finding of about twelve percent per year. This larger return documented by Jegadeesh and Titman (1993) is attributed to using ten percent breakpoints and equal –weighted the stocks within their winner and loser portfolio. However, increasing the average return reported by Jegadeesh and Titman (1993) does not change Moskowitz and Grinblatt’s (1999) finding. Conversely, the evidence in Grundy and Martin (2001) suggest that cross-sectional variation in future returns or industry impact and time-varying factor exposures cannot explain momentum effects.
Using all companies listed on the NYSE and AMEX in the US market, Lee and Swaminathan (2000) improve the result of Datar, Narayan and Robert (1998) by re-investigating the relation between trading volume and price momentum in predicting cross-sectional returns. They confirm the results of Datar et al.(1998) and also provide additional evidence that is difficult to make consistent with the liquidity hypothesis. In addition, they provide a bridge between past studies and recent theoretical studies by linking overreaction and under-reaction in behavioural finance. They also integrate a striking pattern of price momentum in the intermediate horizon with the relation between trading volume and expected returns. Although previous theories behavior presented by Hong and Stein (1997), Daniel, Hirshleifer and Subrahmanyam (1998) and Barberis, Shleifer and Vishny (1998) are consistent with the Lee and Swaminathan’s (2000) findings in terms of initially under-reaction and ultimately overreacting to fundamental news. Their models lack including trading volume explicitly. Thus, they cannot interpret why trading volume is able to forecast the magnitude and persistence of expected price momentum. Lee and Swaminathan (2000) document the combined distribution of expected returns conditional on both past trading volume and past returns.
ISSN: 2306-9007 Gharaibeh (2015) 123
I
www.irmbrjournal.com March 2015I
nternationalR
eview ofM
anagement andB
usinessR
esearchVol. 4 Issue.1
R
M
B
R
entirely attributed to cross-sectional differences in expected returns more than to any predictable time-series differences in stock returns. They address these issues by estimating the post-holding period performance of momentum strategy in order to determine the source of the profitability momentum strategies.
Jegadeesh and Titman (2001) confirm the finding of Jegadeesh and Titman (1993) that momentum profits have continued and the past winners is the superior performance than past losers, recommending that the original findings were not a result of data snooping bias. They confirm that positive and strong momentum profits in the first one year (3 to 12 month) after formation period. The momentum strategy performance or cumulative return during the formation period from 13 to 60 months is negative. This finding is consistent with the behavioural theories but is inconsistent with the Conrad and Kaul (1998) hypothesis. However, this finding should be explained with caution because they show that return reversal is strong to small firms while it is somewhat weak to large firms. In addition, they show that the return reversal is strong during 1965 to 1982 while somewhat become weaker during 1982 to 1998 because the difference between the significance of the momentum profits in the two sub-periods or the magnitude cannot be distinguished. Regarding the previous studies, none of these studies have investigated the existence of size or momentum effect at the Jordan firms market. This study is motivated by the lack of Jordan research to date into the predictability of Jordan firm returns. This paper comprehensively investigates whether there is a momentum or size effects at the level of Jordan firms market. The reminder of this paper is organized as follows. The next section describes the data and the empirical methodology employed in this paper. Section 3 presents the main empirical results and robustness checks. Section 4 draws the conclusions from the results of the study.
Descriptive Statistics
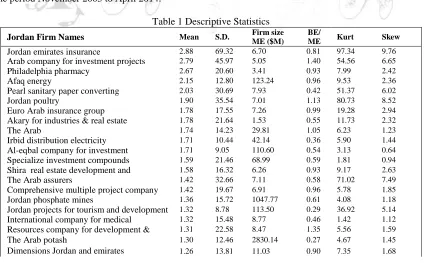
This table details the descriptive statistics for 185 Jordanian firms utilized in this research. The first column is the full industry name. This is followed by the average monthly percent returns, the standard deviation of monthly percent returns, average firm size (ME), average firm book-to- market equity (BE/ME), the kurtosis of monthly percent returns and finally the kurtosis and skewness of monthly percent returns over the period November 2005 to April 2014.
Table 1 Descriptive Statistics
Jordan Firm Names Mean S.D. Firm size ME ($M)
BE/
ME Kurt Skew Jordan emirates insurance 2.88 69.32 6.70 0.81 97.34 9.76 Arab company for investment projects 2.79 45.97 5.05 1.40 54.56 6.65 Philadelphia pharmacy 2.67 20.60 3.41 0.93 7.99 2.42
Afaq energy 2.15 12.80 123.24 0.96 9.53 2.36
Pearl sanitary paper converting 2.03 30.69 7.93 0.42 51.37 6.02 Jordan poultry 1.90 35.54 7.01 1.13 80.73 8.52 Euro Arab insurance group 1.78 17.55 7.26 0.99 19.28 2.94 Akary for industries & real estate
investment
1.78 21.64 1.53 0.55 11.73 2.32
The Arab 1.74 14.23 29.81 1.05 6.23 1.23
Irbid distribution electricity 1.71 10.44 42.14 0.36 5.90 1.44 Al-eqbal company for investment 1.71 9.05 110.60 0.54 3.13 0.64 Specialize investment compounds 1.59 21.46 68.99 0.59 1.81 0.94 Shira real estate development and
investments
1.58 16.32 6.26 0.93 9.17 2.63 The Arab assurers 1.42 32.66 7.11 0.58 71.02 7.49 Comprehensive multiple project company 1.42 19.67 6.91 0.96 5.78 1.85 Jordan phosphate mines 1.36 15.72 1047.77 0.61 4.08 1.18 Jordan projects for tourism and development 1.32 8.78 113.50 0.29 36.92 5.14 International company for medical
investment
1.32 15.48 8.77 0.46 1.42 1.12 Resources company for development &
investment
1.31 22.58 8.47 1.35 5.56 1.59 The Arab potash 1.30 12.46 2830.14 0.27 4.67 1.45 Dimensions Jordan and emirates
commercial investment
ISSN: 2306-9007 Gharaibeh (2015) 124
I
www.irmbrjournal.com March 2015I
nternationalR
eview ofM
anagement andB
usinessR
esearchVol. 4 Issue.1
R
M
B
R
Arab international for education & investment
1.13 10.16 128.46 0.48 17.78 3.29 Jordan electric power 1.11 12.60 256.00 0.43 22.89 3.79 Comprehensive leasing 1.03 8.78 13.08 0.71 1.01 -0.55 Al-safweh for financial investment 1.00 15.58 4.00 6.24 3.05 0.41 Ittihad schools 1.00 10.58 20.05 0.83 6.79 2.03 Union land development corporation 0.87 18.64 93.91 0.66 9.33 2.28 Jordan ceramic industry 0.78 19.52 4.62 1.64 3.12 1.33 Travertine company 0.76 14.49 5.08 1.10 20.95 3.12 Jordan industries& match 0.73 15.70 3.18 0.83 10.32 -0.68 Jordan Islamic bank 0.73 7.85 309.98 0.57 9.65 1.06 Jordan hotels & tourism 0.71 11.32 56.77 0.46 5.69 1.27 Offtec holding group 0.67 16.30 20.42 1.93 13.60 2.80 Jordan wood industry 0.64 10.80 15.35 0.75 6.01 1.25 The Islamic insurance 0.61 12.33 17.58 0.88 37.26 4.93 Arab orient insurance company 0.59 7.52 28.04 0.67 3.33 0.45 Bindar trading & investment company 0.58 16.65 24.56 0.93 3.02 0.41 Jordan petroleum refinery 0.55 10.84 208.92 0.45 3.73 0.83 Ready mix concrte & construction supplies 0.52 8.69 55.84 0.43 4.85 0.09 Contempro for housing projects 0.48 12.23 8.46 1.06 3.02 0.73 Alzarqa education & investment 0.45 7.63 30.88 0.55 2.30 0.04 Medical pharmacy & chemical industry&
multiple
0.43 12.51 26.89 0.39 2.68 0.10 Specialize trading & investment 0.42 15.65 3.45 1.00 8.69 2.06 Arab union international insurance 0.42 12.72 11.54 0.77 2.47 0.64 Arab pesticide & veterinary drugs
manufacturing company
0.41 10.33 16.26 0.88 24.75 3.43 Jerusalem insurance 0.41 5.17 16.87 0.63 8.23 1.75 Union investment corporation 0.40 21.47 90.35 0.73 12.06 2.45 Compre land development & investment 0.39 12.33 9.30 1.08 1.53 0.78 The Industrial commercial & agricultural 0.38 11.48 15.80 0.69 2.87 0.82 Deera investment & real estate development 0.37 7.63 32.09 2.18 1.52 0.65 Specialize Jordanian investment 0.35 15.55 9.72 1.01 3.88 0.46 Ad-dulayl industry park company 0.35 17.73 16.48 3.13 2.53 1.18 Ubour logistic services 0.32 21.67 3.86 0.83 2.03 0.55 The housing bank for trade & finance 0.32 6.83 2002.61 0.45 9.69 0.93 Hayat pharmacy industry 0.31 10.34 12.91 0.95 7.99 1.35 Jordan pipes manufacture 0.30 14.45 5.25 1.40 17.53 3.12 Arab aluminium industry 0.30 6.64 10.92 1.18 7.76 1.23 Jordon Decapolis properties 0.29 12.04 34.35 1.42 1.33 0.58 Arab Jordan investment bank 0.24 8.49 150.76 0.80 5.10 0.81 Arabian steel pipes manufacture 0.21 8.05 19.52 0.78 1.04 0.90 Jordan vegetable oil industries 0.19 14.49 6.70 0.80 10.80 1.96 The national insurance 0.18 10.76 8.13 0.73 2.98 0.27 Rum Aladdin industries 0.18 19.89 10.02 0.74 2.97 1.36 Cairo Amman bank 0.17 8.34 268.70 0.75 2.86 0.59 Al-nisr al-Arabia insurance 0.15 6.38 30.91 0.53 3.71 0.90 International brokerage & financial markets 0.13 25.70 19.50 1.65 18.87 3.18 Al-ekbal printing & packaging 0.12 9.20 6.69 1.29 11.43 2.48 Jordan Kuwait bank 0.11 6.18 438.54 0.73 1.88 0.50 Al manara insurance 0.10 21.90 13.48 1.18 36.27 5.38 Mediterranean tourism investment 0.08 5.55 92.91 0.54 2.57 0.70 Amad investment & real estate development 0.08 7.64 13.19 0.88 1.69 -0.06 Arab electronic industries 0.02 12.31 5.33 1.42 5.58 1.59 Al shamekha for real estate & financial
investment
0.01 14.18 2.46 0.83 13.49 2.27 Sura development & investment -0.07 12.84 5.63 1.31 3.32 1.52 Alentkaeya for investment real estate
development
-0.09 21.31 3.89 1.04 1.78 1.17 Darat Jordan holdings -0.11 12.06 9.33 1.78 0.48 0.74 Trust international transport -0.12 5.98 2.58 0.91 40.23 -0.61 Bank of Jordan -0.13 5.63 288.18 0.73 4.16 0.31 General investment -0.15 8.55 43.03 0.62 20.87 -0.60
ISSN: 2306-9007 Gharaibeh (2015) 125
I
www.irmbrjournal.com March 2015I
nternationalR
eview ofM
anagement andB
usinessR
esearchVol. 4 Issue.1
R
M
B
R
Capital bank of Jordan -0.16 7.23 232.15 0.88 1.77 0.68 Jordan clothing -0.17 19.82 4.37 0.87 5.51 2.17 Invest bank -0.17 7.97 132.87 0.88 5.52 -0.87 Amoun international for investment -0.18 13.26 7.59 1.47 5.00 1.54 Arab central for Pharmacy & chemical -0.18 11.47 10.73 0.10 0.72 0.26 Transport & investment barter -0.19 15.63 16.29 1.14 19.10 3.20 Jordan industrial resources -0.19 14.71 7.76 3.11 1.36 0.80 Al-tajamouat for touristic Projects -0.19 13.02 32.65 1.36 6.36 1.43 Jordan masaken for land & industrial
development
-0.19 11.90 10.55 1.24 2.60 0.96 Methaq real estate investment -0.21 11.68 14.87 0.91 3.20 0.70 Arab international hotels -0.21 6.26 62.63 1.00 3.69 1.02 National poultry -0.23 7.52 56.66 1.10 5.24 -0.09 Al-dawliyah for hotel & mails -0.24 7.07 49.86 1.17 5.88 1.53 Arab banking -0.25 5.94 105.99 1.01 2.94 -0.37 Jordan telecom -0.26 6.25 1265.39 0.33 1.42 -0.04 Al-tahdith for real estate investment -0.27 11.07 1.98 1.37 5.04 1.10 Zahrat alurdon real estate and hotels
investment
-0.28 12.68 1.17 1.01 11.75 1.17 Al-bilad medical services -0.29 6.56 23.54 0.86 0.32 0.09 Delta insurance -0.29 6.64 12.61 0.84 23.49 -0.83 Al-sanabel international for Islamic
financial investment
-0.32 13.26 15.70 1.38 3.10 1.31 First insurance -0.33 6.85 21.18 1.23 0.62 0.13 Jordan company for electricity & oil shale -0.37 13.23 4.11 0.65 3.47 0.52 Jordan worsted -0.38 6.10 73.83 1.04 1.40 0.27 Philadelphia insurance -0.39 4.14 5.13 0.82 7.33 -1.73 Emmar investment & real estate
development
-0.40 14.81 18.07 1.55 7.47 2.01 Jordanian expatriates investment holding -0.40 15.31 14.88 1.45 4.80 0.83
Universal -0.43 6.91 6.49 1.42 2.05 -0.02
Al-amin for investment -0.44 13.96 16.93 1.04 14.81 1.99
Arab bank -0.45 7.91 6438.43 0.89 2.01 1.08
Unified transport -0.45 12.11 7.80 1.29 5.57 1.17 Palaces real estate & development -0.46 11.81 6.84 1.12 3.87 0.67 Jordan national shipping lin -0.47 8.06 20.05 0.75 1.92 -0.11
Jordan dairy -0.48 4.34 7.54 0.95 2.23 0.32
Arab Jordanian insurance group -0.49 11.90 11.49 0.65 2.16 -0.09 Middle east insurance -0.51 7.69 42.73 0.83 1.08 0.10 Jordan chemical industry -0.51 6.85 5.04 0.69 0.31 0.49 Arabia insurance -0.51 9.41 5.94 1.60 4.63 1.27 Jordan commercial bank -0.55 6.37 126.63 0.77 1.69 -0.30 The Mediterranean & gulf insurance -0.55 8.96 16.22 0.54 3.30 0.99 Jordan Dubai Islamic bank -0.56 7.33 79.13 1.05 8.63 -1.45 The united insurance -0.56 7.60 9.97 1.24 2.34 0.74 Arab financial investment -0.56 9.77 34.07 0.86 15.29 2.06 Jordan steel -0.56 11.73 80.72 0.61 4.72 0.28 General mining -0.57 8.52 10.13 0.29 16.82 2.31 Jordan express tourist transport -0.60 6.72 23.44 0.80 2.56 0.45 Holy land insurance -0.61 7.53 4.66 0.53 4.37 -0.35 United financial investment -0.64 12.74 12.25 0.78 25.76 4.06 El-zay ready wear manufacturing -0.66 11.17 6.40 1.70 3.64 0.95 National aluminium industrial -0.67 9.27 9.98 1.42 8.86 2.41 United cable industries -0.68 10.15 31.30 1.52 24.16 3.68 Dar al dawa development & investment -0.75 6.98 75.42 0.80 14.99 2.11 Masafat for specialised transport -0.77 12.34 13.79 1.63 1.49 0.70 Int’l Arabian development & investment
trading company
-0.77 14.33 10.09 1.34 1.76 0.89 Jordanian real estate for development -0.77 12.98 31.79 1.29 3.57 0.16 The professional for real Estate investment
and housing
-0.78 7.76 32.45 1.81 0.62 0.80 Bank al Etihad -0.79 8.42 205.15 1.03 2.55 -0.30 Universal chemical industry -0.79 8.36 2.16 1.21 5.29 1.41 Middle east diversified investment -0.82 18.62 25.16 5.74 1.91 0.38
ISSN: 2306-9007 Gharaibeh (2015) 126
I
www.irmbrjournal.com March 2015I
nternationalR
eview ofM
anagement andB
usinessR
esearchVol. 4 Issue.1
R
M
B
R
Jordan insurance -0.84 7.52 85.93 0.52 1.39 0.51 Yarmouk insurance -0.84 7.02 9.50 1.06 3.96 -0.33
Tuhama for financial investment -0.85 18.10 95.16 5.31 0.46 0.17
Afaq holding for investment and real estate development
-0.87 7.75 181.96 0.61 61.88 -7.83 Jordanian pharmacy manufacturing -0.90 5.70 28.67 1.46 1.22 0.61 Arab life & accident insurance -0.90 11.45 10.84 1.09 6.51 1.59 Jordan Ahli bank -0.91 6.78 230.34 1.05 1.81 -0.24 First finance -0.92 8.26 36.22 1.26 5.70 0.88 High performance real estate -0.95 10.33 12.00 1.32 4.13 -0.11 Arab investors union for real estate
Development
-0.97 12.16 2.97 1.11 2.97 1.12 Jordan international insurance -0.97 7.71 15.37 1.50 8.65 1.77 Kafaa for finance & economy investment -0.98 13.58 5.76 0.94 6.08 -0.68 Ihdathiat co-ordinates -0.98 10.63 3.71 0.87 2.61 0.72 National chlorine industrial -1.01 5.68 10.26 1.14 13.70 2.24 The consultant & investment group -1.02 5.86 59.21 0.74 3.17 -0.50 Sabaek investment -1.03 9.32 8.99 2.51 0.56 0.40 Winter valley tourism investment company -1.05 13.85 5.99 1.14 4.91 0.97 First national vegetable industries -1.08 12.05 3.38 0.83 1.52 0.66 National cable wire manufacturing -1.10 9.87 17.95 1.57 1.73 0.66 Rum group transportation & tourism
investment
-1.16 8.86 11.10 1.06 2.00 1.12 South electronics -1.19 21.60 25.41 1.84 11.12 2.27 Middle east specialize cables -1.19 15.66 42.59 0.25 39.20 4.83 Salam international transport & trading -1.20 8.24 22.53 1.10 4.30 0.44 Assas for concrete products -1.22 11.65 7.04 2.19 12.39 2.15 First Jordan investment -1.24 14.63 57.74 2.20 2.76 1.14 Jordan press foundation -1.25 7.57 82.01 0.52 0.72 0.06
Nutri dar -1.30 9.36 16.02 0.41 4.73 -1.36
Future Arab investment -1.32 9.44 16.31 1.85 1.31 0.75 Alisraa for Islamic finance and investment -1.33 6.63 11.95 1.69 3.72 1.48 Arab east investment -1.35 11.02 76.12 1.58 0.69 0.33 Jordan paper & cardboard factories -1.39 9.14 12.16 1.13 7.38 -0.87 Intermediate petrochemicals industry -1.46 9.85 4.07 2.25 1.09 0.43 The real estate & investment portfolio -1.59 11.44 15.60 0.91 2.93 0.90 Ordan french insurance -1.60 12.34 7.28 1.19 33.55 4.29 The Jordan cement factories -1.67 9.69 392.32 0.65 8.62 1.73 Alia-the royal Jordanian airline -1.74 10.16 124.12 0.81 1.01 0.10 Arab east for real estate investment -1.74 11.92 52.28 1.10 5.16 0.79 Jordan press & publishing/ Ad-dustour -1.78 7.13 8.65 1.38 1.98 -0.16 Real estate development -1.93 12.34 56.13 2.49 0.77 0.21 Taameer Jordan holding public share
holding
-1.94 12.18 205.16 1.46 1.58 0.43 National portfolio securities -2.08 14.88 24.07 0.95 3.55 1.04 Amwal invest -2.10 11.14 42.10 2.05 2.91 0.39 Al-quds ready mix -2.17 11.64 10.69 1.47 0.92 0.44 Premier business & projects -2.24 9.17 7.40 0.72 4.14 0.83 Shareco brokerage -2.58 8.64 31.89 6.59 4.45 -0.51 Comprehensive multiple transportation -3.08 13.19 12.13 0.85 2.50 0.53
AVERAGE -0.16 12.25 115.34 1.15
Data and Methodology
ISSN: 2306-9007 Gharaibeh (2015) 127
I
www.irmbrjournal.com March 2015I
nternationalR
eview ofM
anagement andB
usinessR
esearchVol. 4 Issue.1
R
M
B
R
The monthly returns (denoted
R
mtm) of the market are the monthly returns of the Amman Stock Exchange market of Morgan Stanley Capital International (MSCI) Jordan index downloaded from Datastream.Additionally, the study uses the one to twelve-month Treasury bill rates as the risk-free rate (denoted
R
Ftm ) reported at the beginning of each month for the period from November 2005 to April 2014.All data is downloaded from data stream except of risk-free rate downloaded from Jordan central bank. The study commences from November 2005 because the Datastream has a less comprehensive coverage of ASE stocks prior to November 2005. The final sample is composed of 102 monthly returns on each firm, on the market index and the risk-free asset, together with observations on the firm size and firm book-to-market ratio of each firm.
Table 1 reports firm summary statistics over the period November 2005 to April 2014 for the 185 Jordan firms, showing the monthly average return, standard deviation, average firm size, average book-to-market ratio, last two columns represent Skewness and Kurtosis. There is a large variation in the mean and standard deviation of returns. Jordan emirates in, Jordan emirates insurance, Arab company for investment projects, Philadelphia pharmacy, Afaq energy and Pearl sanitary paper converting have the largest monthly averages (over 2% per month), while comprehensive multiple transportation has the lowest average at -3.08. The 185 Jordan firms have an average monthly return of -0.16% and an average standard deviation of 12.20%.
The purpose of this paper is to investigate whether there are size and momentum effects, and to investigate whether there is a large size momentum effect at the firm level in Jordan market. A description of these two strategies is presented next.
Size Strategy
The size portfolios are constructed as follows. At the beginning of each month t, all Jordan firm stocks in Table 1 are ranked into ten equal portfolios based on their size from small to large. The small size (S) portfolio comprises the 10% of firms that have the smallest size whereas the big size (B) portfolio comprises the 10% of firms that have the biggest size. The size strategy (S-B) buys the small size and sells the big size portfolio. Portfolios are held for K-month holding periods, where K= 1, 3, 6, 9 and 12 months. This study maintains a 1-month gap between the end of the month formation period and the beginning of the K-month holding period.
Momentum Strategy
This study uses the same process to form portfolios of the stocks in Jordan firms. At the beginning of each month t, the Jordan firms in Table 1 are ranked based on their past J-month returns (J = 3, 6, 9 or 12 months). For a given J, the short-term winner (SW) portfolio comprises the 10% of firms that have the highest past J-month returns whereas the short-term loser (SL) portfolio comprises the 10% of firms that have the lowest past J-month returns. The momentum strategy (SW-SL) buys the short-term winner and sells the short-term loser portfolio. Portfolios are held for K-month holding periods, where K= 1, 3, 6, 9 and 12 months. This study maintains a 1-month gap between the end of the J-month formation period and the beginning of the K-month holding period. A gap of one month is consistent with Jegadeesh and Titman (1993).
Momentum in Large-Sized Portfolio
ISSN: 2306-9007 Gharaibeh (2015) 128
I
www.irmbrjournal.com March 2015I
nternationalR
eview ofM
anagement andB
usinessR
esearchVol. 4 Issue.1
R
M
B
R
The large size Jordan companies group then are ranked into ten portfolios based on their past J-month returns (J = 3, 6, 9 or 12 months). For a given J, the short-term winner (SW) portfolio comprises the 10% of large firm size that have the highest past J-month returns whereas the short-term loser (SL) portfolio comprises the 10% of large firm size that have the lowest past J-month returns. The momentum strategy (SW-SL) buys the short-term winner and sells the short-term loser portfolio in regard to .40 large size firms. Portfolios are held for K-month holding periods, where K= 1, 3, 6, 9 and 12 months.
This study employs the same process used in large-sized momentum strategy in terms of maintains a 1-month gap between the end of the J-month formation period and the beginning of the K-month holding period. A gap of one month is consistent with Jegadeesh and Titman (1993).
Analysis of Results
Section 3.1 provides the findings of the size, momentum and large-sized momentum strategies for Jordan firms market. Section 3.2 presents the robustness checks of the large-sized momentum strategy in terms of the sub-period analysis while Section 3.3 shows the risk-adjustment regression.
The Size, Momentum and Large-Sized Momentum Strategies.
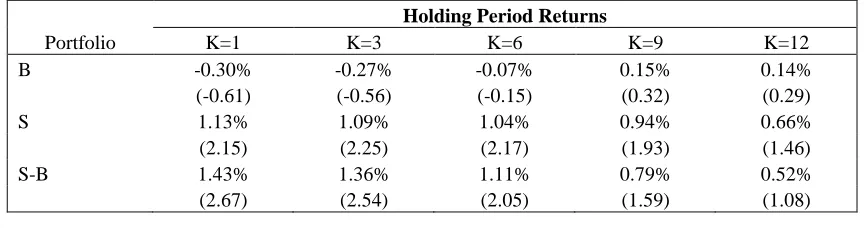
Table 2 reports the monthly holding period returns for the small, big and small-big portfolios of the size strategy when applied to the sample of 185 Jordan firms. Columns 2 through 6 list the equal-weighted monthly returns in percentages for the K-month holding periods (K= 1, 3, 6, 9 and 12 months).
The size strategy results in Table 2 indicate that the strategy profits (S-B) provide more than 0 .50% over all K-month holding periods. For example, for the 6-month holding period (K=6) case, the difference between the average monthly returns of the S portfolio and the B portfolio is 1.11% per month (t-stat 2.05), which is statistically significant. In short, the holding period returns in Table 2 give an indication of a size effect at the Jordan firm level. Although the size results are statistically insignificant for the K = 9 and 12 cases, the magnitudes of these unadjusted results are still relatively large, ranging from 0.52% per month to 0.79% per month.
Profitability of the Size Strategy
This table reports the average monthly holding period returns in percentages of the small, big and small-big portfolios of the size strategy. Portfolios are constructed as follows: At the beginning of each month t, stocks in each firm are assigned to ten equal size-sorted portfolios (from small to large) according to their monthly market value (stock price times number of shares outstanding million dollar). The small weighted portfolio (S) contains the 10% of portfolios with the smallest firm size returns, and the big equal-weighted portfolio (B) contains the 10% of portfolios with the biggest firm size returns. The strategy S-B longs the small size portfolio and shorts the big size portfolio to be held for K =1, 3, 6, 9 or 12 months. T-statistics presented in parenthesis are corrected for heteroskedasticity employing the White (2000) test.
Table 2: Profitability of the Size Strategy
Holding Period Returns
Portfolio K=1 K=3 K=6 K=9 K=12
B -0.30% -0.27% -0.07% 0.15% 0.14%
(-0.61) (-0.56) (-0.15) (0.32) (0.29)
S 1.13% 1.09% 1.04% 0.94% 0.66%
(2.15) (2.25) (2.17) (1.93) (1.46)
S-B 1.43% 1.36% 1.11% 0.79% 0.52%
ISSN: 2306-9007 Gharaibeh (2015) 129
I
www.irmbrjournal.com March 2015I
nternationalR
eview ofM
anagement andB
usinessR
esearchVol. 4 Issue.1
R
M
B
R
The results of the momentum strategies are presented in Table 3. It reports the average monthly US dollar of the short-term winner, short-term loser and arbitrage portfolios of the momentum strategy applied to the Jordan firms market returns. This table contains the results for the formation period lengths of J = 3, 6, 9, and 12 months.
Profitability of the Momentum Strategy
Table 3 refers that the momentum strategy is not successful. The K= 6 base case SW-SL loses -0.97% per month. In general, the findings in Table 3 reveal that in most cases the SW-SL strategy earns negative returns that are not statistically significant. This refers that the momentum strategy does not work in Jordan firms market returns.
Table 3: Profitability of the Momentum Strategy
Holding Period Returns
J Portfolio K=1 K=3 K=6 K=9 K=12
Momentum 3 SW -0.90 -0.68 -0.61 -0.43 -0.14
(-1.37) (-1.1) (-1.11) (-0.85) (-0.29)
SL 0.02 0.18 0.21 -0.01 0.09
(0.02) (0.27) (0.36) (-0.02) (0.16)
SW-SL -0.92 -0.86 -0.82 -0.42 -0.23
(-1.24) (-1.51) (-1.9) (-1.13) (-0.74)
6 SW -0.94 -0.66 -0.58 -0.10 -0.11
(-1.46) (-1) (-1.02) (-0.19) (-0.22)
SL 0.94 0.64 0.39 0.33 0.19
(1.32) (0.97) (0.62) (0.55) (0.34)
SW-SL -1.88 -1.30 -0.97 -0.43 -0.31
(-2.5) (-1.91) (-1.61) (-0.86) (-0.68)
9 SW -0.36 -0.39 -0.01 0.11 -0.08
(-0.53) (-0.65) (-0.01) (0.2) (-0.16)
SL 1.39 0.71 0.43 0.31 0.29
(1.77) (0.99) (0.67) (0.51) (0.47)
SW-SL -1.74 -1.10 -0.44 -0.21 -0.38
(-2.08) (-1.48) (-0.7) (-0.36) (-0.68)
12 SW 0.17 0.25 0.33 0.05 -0.18
(0.31) (0.46) (0.62) (0.1) (-0.35)
SL -0.02 -0.03 0.07 0.12 0.45
(-0.04) (-0.05) (0.13) (0.19) (0.68)
SW-SL 0.19 0.28 0.25 -0.07 -0.63
(0.29) (0.48) (0.47) (-0.12) (-1.07)
The problem appears to be that the SW is too loses. For example, portfolio SW has a large negative average return of -0.58% per month for the K= 6 case. This table reports the average monthly holding period returns in percentages of the winner, loser and winner-loser portfolios of the momentum strategy. Portfolios are constructed as follows: At the beginning of each month t, portfolios are ranked based on their past J-month formation period returns for J = 3, 6, 9 and 12 months.
ISSN: 2306-9007 Gharaibeh (2015) 130
I
www.irmbrjournal.com March 2015I
nternationalR
eview ofM
anagement andB
usinessR
esearchVol. 4 Issue.1
R
M
B
R
In contrast, the large-sized momentum strategy results reported in Table 4 refer that the large firm size momentum strategy SW-SL produces positive profits. For the K= 6 base case the large firm size momentum strategy has positive profits of 1.72% per month and statistically significant (t-value 2.09). In summary, the momentum strategy is not profitable for Jordan firms market returns, while the large-sized momentum strategy is statistically significant when K= 6 in most cases.
Profitability of the Large firm Size Momentum Strategy
This table reports the average monthly holding period returns in percentages of the winner, loser and winner-loser portfolios of the momentum strategy. Portfolios are constructed as follows: At the beginning of each month t, portfolios are ranked based on their past J-month formation period returns for J = 3, 6, 9 and 12 months.
Table 4: Profitability of the Large firm Size Momentum Strategy
Holding Period Returns
J Portfolio K=1 K=3 K=6 K=9 K=12
Momentum 3 SW 0.20 0.39 0.22 0.24 0.39
(0.2) (0.42) (0.24) (0.31) (0.53)
SL -0.99 -0.68 -0.81 -1.03 -0.85
(-1.14) (-0.92) (-1.41) (-1.84) (-1.54)
SW-SL 1.19 1.07 1.03 1.27 1.24
(1.14) (1.16) (1.34) (2.11) (2.31)
6 SW 0.80 0.97 0.86 1.01 0.70
(0.75) (0.92) (0.99) (1.28) (0.93)
SL -1.33 -0.62 -0.86 -0.98 -1.03
(-1.62) (-0.86) (-1.3) (-1.56) (-1.6)
SW-SL 2.13 1.59 1.72 1.99 1.73
(2.02) (1.59) (2.09) (2.85) (2.69)
9 SW 1.61 1.13 1.11 0.95 0.73
(1.5) (1.19) (1.4) (1.28) (1)
SL -0.32 -0.73 -1.07 -1.29 -1.34
(-0.4) (-0.94) (-1.54) (-1.82) (-1.9)
SW-SL 1.93 1.86 2.18 2.25 2.07
(1.73) (1.92) (2.8) (3.16) (3.06)
12 SW 0.69 1.02 0.87 0.71 0.42
(0.87) (1.44) (1.25) (1.03) (0.61)
SL -1.42 -1.19 -1.33 -1.40 -1.03
(-2.01) (-1.81) (-1.92) (-2.06) (-1.51)
SW-SL 2.11 2.20 2.20 2.11 1.45
(2.53) (3.24) (3.32) (3.23) (2.27)
The short-term winner equal-weighted portfolio (SW) contains the 10% of portfolios with the largest big firm size returns, and the short-term loser equal-weighted portfolio (SL) contains the 10% of portfolios with the lowest returns. The strategy SW-SL longs the short-term winner portfolio and shorts the short-term loser portfolio to be held for K =1, 3, 6, 9 or 12 months. The monthly return for each holding period comes from using O’Brien, et al (2010) methodology. T-statistics presented in parenthesis are corrected for heteroskedasticity employing the White (2000) test.
Cumulative Return of the Large-Sized Momentum Strategy.
ISSN: 2306-9007 Gharaibeh (2015) 131
I
www.irmbrjournal.com March 2015I
nternationalR
eview ofM
anagement andB
usinessR
esearchVol. 4 Issue.1
R
M
B
R
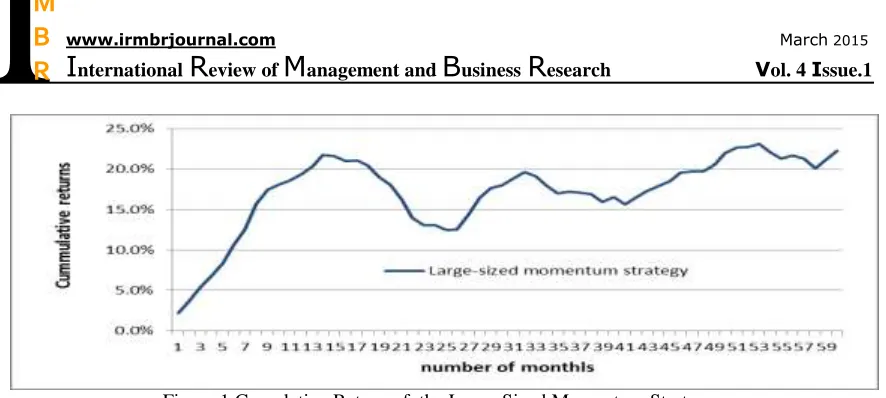
Figure 1 Cumulative Return of the Large-Sized Momentum Strategy.
Fig. 1 charts the cumulative returns of the large-sized momentum strategy with K=1 for the Jordan firms market for the first 60 months following the beginning of holding period. The graph confirms the results in Table 4. The profits in the Jordan firms market continue for the first 12-month then start declining until the second year.
Sub-Period Analysis
This section checks the consistency of the size and large-sized momentum strategies over time by examining the profitability of the strategy in two periods of approximately equal size. The first sub-period covers November 2005 to February 2010. The second sub-sub-period covers March 2010 to April 2014. Table 5 and 6 reports the profitability for both size and large-sized momentum strategies in these two sub-periods.
Profitability for the Size Firms in Sub-period
This table presents in Panel A the average monthly holding period returns in percentages for the first sub period of size portfolios for the period November 2005 to February 2010, while Panel B reports the second sub period of the average monthly holding period returns in percentages for size portfolios for the period March 2010 to April 2014for the 185 Jordan Firm. The way these portfolios are formed is described in Table 2 (for the size strategy). Holding period t-statistics are simple t-statistics.
Table 5: Profitability for the Size Firms in Sub-period
Holding Period Returns
Portfolio K=1 K=3 K=6 K=9 K=12
Panel A: Subperiod 1 (November 2005 to February 2010) 52 observations
B -0.69% -0.63% -0.24% 0.24% 0.22%
(-0.76) (-0.69) (-0.27) (0.26) (0.23)
S 0.62% 0.66% 0.62% 0.52% -0.05%
(0.8) (0.98) (0.91) (0.69) (-0.07)
S-B 1.31% 1.29% 0.87% 0.28% -0.26%
(1.61) (1.58) (1.01) (0.37) (0.34)
Panel B: Subperiod 2 (March 2010 to April 2014) 50 observations
B 0.08% 0.18% 0.28% 0.13% 0.15%
(0.2) (0.43) (0.65) (0.28) (0.31)
S 1.42% 1.40% 0.99% 1.27% 1.49%
(2.01) (1.98) (1.41) (1.84) (2.27)
S-B 1.33% 1.22% 0.71% 1.15% 1.34%
ISSN: 2306-9007 Gharaibeh (2015) 132
I
www.irmbrjournal.com March 2015I
nternationalR
eview ofM
anagement andB
usinessR
esearchVol. 4 Issue.1
R
M
B
R
Panel A reports the first sub-period findings and shows positive returns for all K holding period except holding period returns K=12. Although the first sub-period results are not statistically significant, these returns are still economically significant. They provide more than 0.1% returns for K= 1, 3 and 6. As is the case with the full sample findings, the size strategy profits in the first sub-period are all positive for Jordan firms returns except K = 12. Inspection of the second sub-period findings in Panel B reveals stronger results. The size strategy makes profits in all cases. Although the second sub-period size results are only weakly significant for the K = 1, 3 and 9 cases, the magnitudes of these unadjusted results are still economically large, ranging from 1.15% per month to 1.33% per month. In short, the size strategy produces strong profits in both sub-period periods except for the K = 12 in first sub-period. Overall, the sub-period results in Table 5 confirm the presence of size effect among Jordan firms.
Profitability for the Momentum in Large Size Firms in Sub-period
This table presents in Panel A the average monthly holding period returns in percentages for the first sub period of momentum portfolios (J = 6, K = 6) for the period November 2005 to February 2010, while Panel B reports the second sub period of the average monthly holding period returns in percentages for momentum portfolios (J = 6, K = 6) for the period March 2010 to April 2014for the 185 Jordan Firm. The way these portfolios are formed is described in Table 3 (for the momentum strategy). Holding period t -statistics are simple t-statistics.
Table 6: Profitability for the Momentum in Large Size Firms in Sub-period
Holding Period Returns
J Portfolio K=1 K=3 K=6 K=9 K=12
Panel A: Subperiod 1 (November 2005 to February 2010) 52 observations
Momentum 6 SW 0.99% 1.25% 1.16% 1.45% 1.09%
(0.52) (0.65) (0.68) (0.89) (0.66)
SL -2.26% -0.44% -1.01% -1.26% -1.43%
(-1.66) (-0.36) (-0.96) (-1.23) (-1.33)
SW-SL 3.25% 1.69% 2.17% 2.72% 2.52%
(1.82) (0.97) (1.47) (2.04) (1.95)
Panel B: Subperiod 2 (March 2010 to April 2014) 50 observations
Momentum 6 SW 0.91% 0.87% 0.61% 0.80% 0.83%
(0.73) (0.66) (0.61) (0.93) (1.03)
SL -0.42% -0.85% -0.72% -0.91% -0.58%
(-0.46) (-1.05) (-0.84) (-1.23) (-0.76)
SW-SL 1.33% 1.71% 1.33% 1.71% 1.42%
(1.05) (1.37) (1.3) (2.19) (2.04)
Table 6 presents the profitability of the large size momentum strategy in the same two sub-periods. Panel A reports the first sub-period findings and shows positive returns and provides more than 0.1% returns for all K. As is the case with the full sample findings, the large-sized momentum strategy profits in the first sub-period are all positive for Jordan firms returns. The second sub-sub-period findings in Panel B produce a comparable story: the large-sized momentum strategy makes profits in all cases. These sub-periods findings confirm the full sample large-sized momentum strategy findings early documented in this paper.
Risk-Adjusted Large-Sized Momentum Profits
one-ISSN: 2306-9007 Gharaibeh (2015) 133
I
www.irmbrjournal.com March 2015I
nternationalR
eview ofM
anagement andB
usinessR
esearchVol. 4 Issue.1
R
M
B
R
factor CAPM and three-factor time-series regression models employed by Sharpe and Lintner and Sharpe (1965; 1964) and Fama and French (1993).
The one-factor model which is the CAPM contains only Jordan market factor.
.
)
(
t iRft Rm p ft
pt
R
a
b
Rm
Rf
e
R
(1)The second model employed for risk adjustment is the Fama and French three-factor model:
i t hml t smb t
Rft Rm p rft
pt
R
a
b
Rm
Rf
b
SMB
b
HML
e
R
(
)
(2)Where the dependent variable
R
pt
R
ftis the monthly excess return of the firm of the value weighted portfolio p of interest,R
ptis the firm monthly return of portfolio p at time t, andR
ftrepresents the monthly risk-free rate at time t represented by the one-month Jordan T-bill return. The independent variables orfactors for the two models as follows:
(
Rm
Rf
t)
is the monthly excess market return for month t,t
SMB
andHML
tare the monthly Fama-French size and book-to-market factors at time t, respectively.The monthly market returns MSCI have been downloaded from the datastream. One-month T-bill risk-free rate covering the full sample period from November 2005 to April 2014 are downloaded from Jordan Central Bank Library.
The three-factor model covers the period from the period from November 2005 to April 2014. The
coefficients
b
RmRft,
b
smband
b
hmlare the regression loadings corresponding to the factors of the models, while the intercept
p(or simply alpha) represents the risk-adjusted abnormal returns of the portfolios over the estimation period. If alpha is statistically significantly different from zero, then this is evidence of abnormal profits. The t-values corresponding to the regression coefficients are corrected for heteroskedasticity using the White’s (1980) test.Risk-Adjusted Large Size Momentum Profits
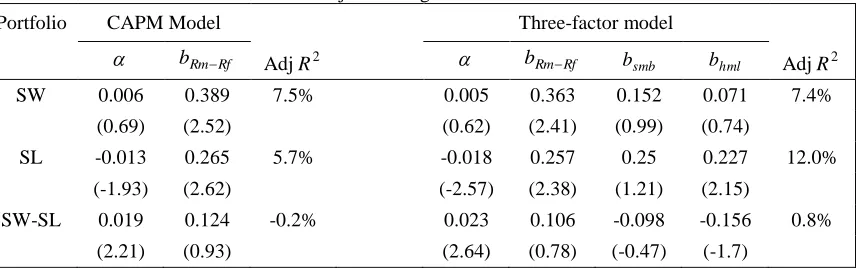
This table presents the CAPM and Three-factor regression results for monthly returns of the K=6 holding period for the large size firms momentum strategy. SW represents the portfolio composed of the 10% of firms that have the highest past six-month returns grouped in the Winner portfolio, while SL represents the portfolio composed of the 10% of firms that have the lowest past six-month returns grouped in the Loser portfolio. The arbitrage portfolio SW-SL is to be held for one, three, six, nine or 12 months. The CAPM regression is as follows: RptRft ap bRmRft(RmRft)ei, where Rpt – Rft is the portfolio’s excess return, bRmRf is the market factor represented by the return on the MSCI Jordan market index.
The three-factor regression is as follows: RptRrft apbRmRft bsmbSMBtbhmlHMLtei, where Rpt – Rft is the portfolio’s excess return, Rmt - Rft
ISSN: 2306-9007 Gharaibeh (2015) 134
I
www.irmbrjournal.com March 2015I
nternationalR
eview ofM
anagement andB
usinessR
esearchVol. 4 Issue.1
R
M
B
R
Table 7: Risk-Adjusted Large Size Momentum Profits
Table 7 presents the regression coefficients of the one-factor CAPM and three-factor models, as well as the related White-corrected t-statistics for the short-term winner, short-term losers and arbitrage portfolios for the K= 6 base case. The alpha of the one-factor CAPM and three-factor models is exhibited in columns 2 and 5, respectively.
The regression findings in the table refer positive and significant arbitrage alphas for both models (0.019 and 0.034 with corresponding t-value 2.21 and 2.64 for the one-factor CAPM and three-factor models is presented in columns 2 and 5, respectively). It is expected that risk adjustment for the SW-SL portfolio’s findings successes to show either significant alphas or at least positive alphas given that the corresponding unadjusted arbitrage profits finding in Table 4 is statistically significant positive. Interestingly, the short portfolios in one-factor CAPM has weakly significant alpha -0.019 per month (t-stat -1.93), and the short portfolios in three-factor model has statistically significant alpha -0.018 per month (t-stat -2.57). The short sides of the two models are relatively large. This gives an indication that the abnormal large size momentum profits may be driven by avoiding loses in reversal of short-term losers.
In summary, the two large size momentum results in Table 7 reveal that there is a large-sized momentum profits in Jordan firm returns that cannot be explained by the one-factor CAPM and Fama-French factor model. Although the CAPM presents alpha result marginally better than the alpha result of the factor model, the results in this paper raise the possibility that both the CAPM and the Fama-French three-factor model may have difficulty explaining the results of such a study.
Conclusion
This study has investigated whether there is the existence of size and momentum effects across Jordan firms and whether there is momentum in large-sized portfolio at the level of individual Jordan firms for the period from 2005-2014. The study finds a significant size effect. The size strategy introduced in this paper provides the largest returns, averaging 1.43% per month when applied to the Jordan firms.
This paper also answers the question that there is no momentum effect when applied to Jordan firms market. In contrast, this study documents strong evidence of momentum strategies in large-sized portfolio, meaning that there is a momentum strategy only across large size firms in Jordan. This result is consistent with the finding of O’Brien, et al.(2010).
These findings show that it is possible to predict the future performance of firms that have extreme ratios of market equity. Such predictability in firm returns has important implications for investors, fund managers and researchers alike. For investors, they should consider whether the stocks that they invest into size firm categories. There are also implications for academic research. Firstly, the returns of the firm size strategy cannot be explained by the Fama-French three-factor model. This means that the size effect at the Jordan
Portfolio CAPM Model Three-factor model
bRmRf AdjR2
bRmRf bsmb bhml AdjR2SW 0.006 0.389 7.5% 0.005 0.363 0.152 0.071 7.4%
(0.69) (2.52) (0.62) (2.41) (0.99) (0.74)
SL -0.013 0.265 5.7% -0.018 0.257 0.25 0.227 12.0%
(-1.93) (2.62) (-2.57) (2.38) (1.21) (2.15)
SW-SL 0.019 0.124 -0.2% 0.023 0.106 -0.098 -0.156 0.8%
ISSN: 2306-9007 Gharaibeh (2015) 135
I
www.irmbrjournal.com March 2015I
nternationalR
eview ofM
anagement andB
usinessR
esearchVol. 4 Issue.1
R
M
B
R
firm needs further investigation in order to understand what is driving the inter-firm size effect. Is the predictability of future firm returns the result of mispricing of firms or is it the result of changing fundamentals for the firms.
References
Banz, R. W. (1981). The relationship between return and market value of common stocks. Journal of Financial Economics, 9(1), 3-18.
Barberis, N., Shleifer, A., & Vishny, R. (1998). A model of investor sentiment1. Journal of financial economics, 49(3), 307-343.
Brown, P., Keim, D. B., Kleidon, A. W., & Marsh, T. A. (1983). Stock return seasonalities and the tax-loss selling hypothesis: Analysis of the arguments and Australian evidence. Journal of Financial Economics, 12(1), 105-127.
Chan, L. K. C., Jegadeesh, N., & Lakonishok, J. (1996). Momentum strategies. Journal of Finance-New York-, 51, 1681-1714.
Chou, P.-H., Ho, P.-H., & Ko, K.-C. (2012). Do industries matter in explaining stock returns and asset-pricing anomalies? Journal of Banking & Finance, 36(2), 355-370.
Conrad, J., & Kaul, G. (1998). An anatomy of trading strategies. Review of Financial Studies, 11(3), 489. Conrad, J., & Kaul, G. (1998). An anatomy of trading strategies. Review of Financial Studies, 11(3),
489-519.
Daniel, K., Hirshleifer, D., & Subrahmanyam, A. (1998). A theory of overconfidence, self-attribution, and security market under-and overreactions: Mitsui Life Financial Research Center, School of Business Administration, University of Michigan.
Datar, V., Narayan, N., & Robert, R. (1998). Liquidity and stock returns: An alternative test. Journal of Financial Markets, 1(2), 203-219.
Fama, E. F., & French, K. R. (1993). Common risk factors in the returns on stocks and bonds. Journal of Financial Economics, 33(1), 3-56.
Fama, E. F., & French, K. R. (1996). Multifactor explanations of asset pricing anomalies. The Journal of Finance, 51(1), 55-84.
Grundy, B. D., & Martin, J. S. (2001). Understanding the nature of the risks and the source of the rewards to momentum investing. Review of Financial Studies, 14(1), 29-78.
Hong, H., & Stein, J. C. (1997). A unified theory of underreaction, momentum trading and overreaction in asset markets: National Bureau of Economic Research Cambridge, Mass., USA.
Hong, H., & Stein, J. C. (1999). A unified theory of underreaction, momentum trading, and overreaction in asset markets. The Journal of Finance, 54(6), 2143-2184.
Jegadeesh, N., & Titman, S. (1993). Returns to buying winners and selling losers: Implications for stock market efficiency. Journal of Finance, 48(1), 65-91.
Jegadeesh, N., & Titman, S. (2001). Profitability of momentum strategies: An evaluation of alternative explanations. The Journal of Finance, 56(2), 699-720.
Lee, C., & Swaminathan, B. (2000). Price momentum and trading volume. The Journal of Finance, 55(5), 2017-2069.
Lintner, J. (1965). The valuation of risk assets and the selection of risky investments in stock portfolios and capital budgets. The Review of Economics and Statistics, 47(1), 13-37.
Moskowitz, T. J., & Grinblatt, M. (1999). Do industries explain momentum? The Journal of Finance, 54(4), 1249-1290.
O’Brien, M. A., Brailsford, T., & Gaunt, C. (2010). Interaction of size, book‐to‐market and momentum effects in Australia. Accounting & Finance, 50(1), 197-219.
Reinganum, M. (1981). Misspecification of capital asset pricing:: Empirical anomalies based on earnings' yields and market values. Journal of Financial Economics, 9(1), 19-46.
Reinganum, M. (1999). The significance of market capitalization in portfolio management over time. The Journal of Portfolio Management, 25(4), 39-50.
ISSN: 2306-9007 Gharaibeh (2015) 136
I
www.irmbrjournal.com March 2015I
nternationalR
eview ofM
anagement andB
usinessR
esearchVol. 4 Issue.1
R
M
B
R
Sharpe, W. F. (1964).Capital asset prices: A theory of market equilibrium under conditions of risk. The Journal of Finance, 19(3), 425-442.
van Dijk, M. A. (2011). Is size dead? A review of the size effect in equity returns. Journal of Banking & Finance, 35(12), 3263-3274.