http://www.sciencepublishinggroup.com/j/ogce doi: 10.11648/j.ogce.20170505.14
ISSN: 2376-7669(Print); ISSN: 2376-7677(Online)
Effect of Network Topology on Relative Permeability;
Network Model and Experimental Approaches
Walid Mohamed Mahmud
Department of Petroleum Engineering, Faculty of Engineering, University of Tripoli, Tripoli, Libya
Email address:
To cite this article:
Walid Mohamed Mahmud. Effect of Network Topology on Relative Permeability; Network Model and Experimental Approaches.
International Journal of Oil, Gas and Coal Engineering. Vol. 5, No. 5, 2017, pp. 90-96. doi: 10.11648/j.ogce.20170505.14 Received: January 1, 2017; Accepted: January 31, 2017; Published: October 24, 2017
Abstract:
The effect of topological properties on imbibition relative permeabilities and residual saturations was previously studied by utilizing quasi-static network model topologies extracted from actual sandstones 3D micro-tomographic images. Non-wetting fluid in imbibition displacements can be disconnected by snap-off as a result of swelling of wetting films in the corners of pores and throats. The findings showed that the effect of topology on imbibition relative permeabilities depends on the level of snap-off. For strongly wetting conditions where snap-off dominates the displacement the effect of network topology is significantly smaller than for weakly wet conditions where snap-off is suppressed. The findings were valid for random networks and for networks displaying short-range pore-throat and longer-range spatial correlations. The aim of this study is to validate network model findings by comparing them with laboratory measurements of relative permeabilities. Laboratory measured data include imbibition relative permeability for sandstones of similar petrophysical properties to Fontainebleau sandstone used to extract 3D micro-tomographic images. Laboratory measurements were made at ambient conditions on core samples of different diameters and different porosities and permeabilities. Experimental measurements were in good qualitative agreement with stochastic networks that match the full coordination number distribution and geometric properties of networks obtained from 3D micro-CT images. Experimental measurements were also in good agreement with networks displaying both short-range pore-throat correlations and longer-range spatial correlations.Keywords:
Two-Phase Flow, Relative Permeability, Network Models, Imbibition, Topology, Experimental Measurements1. Introduction
Network models, including those that utilize the quasi-static algorithm as in this study, are used to model multi-phase flow at small scale to predict macroscopic properties such as relative permeability, residual saturations and capillary pressure. However, network models require accurate descriptions of the morphology of the pore space so that realistic predictions can be produced. It was suggested that the computations of some petrophysical properties, such as permeability, formation factor and mercury injection capillary pressure, on digitized image of a small rock fragments cut from a core plug are consistent with laboratory measurements performed on the same plug or plugs of similar microstructure and petrophysical properties even though the computations and measurements are performed at significantly different scales [1, 2, 15]. Moreover, network model that employ the quasi-static algorithm are the most
computed relative permeability to topology is greatest for contact angles where snap-off is completely suppressed. For strongly wetting conditions where the displacement is dominated by snap-off the sensitivity of relative permeability to network topology is considerably reduced. This conclusion is valid for both random and correlated networks [3].
Micro-CT imaging is currently limited to small sample sizes much smaller than conventional core plug scale at which laboratory measurements are conducted. The purpose of this study is to compare between relative permeability curves computed directly from 3D micro- tomographic images (micro-CT) of Fontainebleau sandstone and laboratory measurements conducted on core plugs of similar petrophysical and microstructure properties to the Fontainebleau sandstone used to extract 3D micro-tomographic images.
2. Model Networks
2.1. Image Based Fontainebleau Networks
The networks represent four small cylindrical core plugs 4.52 mm in diameter and 2.91 mm long cut from a plug with a porosity of 22%. The plug was imaged at a resolution of 5.7
µm. The image was divided into four quadrants to give a total of four images of approximately 4003 voxels each. All samples were fairly uniform as they display only a small variation in porosity. Figure 1 shows a slice taken from the core plug [5]. More description of the network models of Fontainebleau sandstone considered in the present study can be found elsewhere [2, 3, 4]. The primary topological measure of the network is the coordination number, z. The coordination number distribution for the Fontainebleau network studied is well approximated by an exponential of up to a coordination number of around 10. The mean coordination number is 3.75. The two principle geometric properties, pore-size and throat-size distributions, determined from the images are reported by Lindquist et al. [5]. The networks were randomized to remove all the correlations in geometric properties by randomly assigning pore and throat sizes. It was previously shown that this randomization process results in smooth relative permeability data sets with little variability between individual samples [4]. Moreover, the computations were run at a contact angle of 45°, i.e. weakly water-wet conditions. For a contact angle of 45°, snap-off is completely suppressed and the displacement consists of a frontal invasion of pores and adjacent throats.
Figure 1. A slice taken from the core plug [5].
2.2. Lattice-Based Networks
Relative permeabilities on regular 3-D lattices with lower coordination numbers are considered, including the diamond lattice that has a coordination of 4 and ystar (Y*) lattice that has a coordination number of 3. This is because the average coordination number for the actual rock network is considerably smaller than the coordination of a cubic lattice that is 6.
2.3. Stochastic Networks
Rock networks exhibit wide distributions of coordination number; therefore, stochastic networks with similar coordination number distributions from highly coordinated regular networks are generated. This was done by using a bond dilution algorithm that allows both the mean coordination number and the coordination number distribution of the rock network to be matched [4].
3. Laboratory Measurements
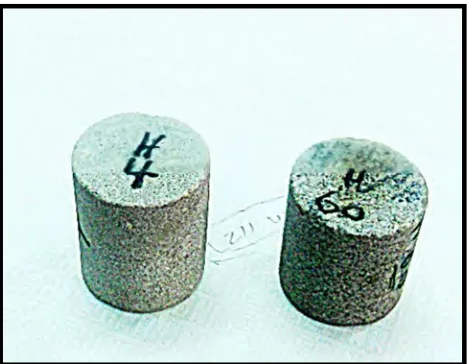
Two cylindrical sandstone core plugs; H4 and W60 as shown in Figure 2, were examined. Core plug H4 has a diameter of 37.85 mm and a length of 46.1 mm with porosity of 14.1% and permeability of 1018 mD. Core plug W60 has a diameter of 38.1 mm and a length of 40.8 mm with porosity of 9.97% and permeability of 181.9 mD. The two core plugs have much larger sizes than the network samples in order to minimize sample size effect. Moreover, the investigation is limited to what are usually considered to be homogeneous or model rock types. These are the rock types normally used to validate image-based calculations of a wide range of rock properties. The two core plugs are weakly water-wet and the displacement is predominantly frontal with little or no snap-off events. Dean Stark Method was used to clean the core plugs. Core plugs were placed in toluene for 24 hours to melt down and dissolve hydrocarbon content. Samples are then distilled with silver nitrate and methanol for 24 hours. Pink precipitate indicates that salts contents within the samples has not entirely been removed and the 24-hour toluene placement processes is repeated till the pink precipitate disappears. The core plugs were then fired at 70°C. This process was repeated several times to ensure that all hydrocarbons, salts and clay contents were removed and deactivated. Core plugs permeabilities and porosities were measured by nitrogen gas permeability and helium expansion methods, respectively.
Figure 2. Conventional sandstone core plugs used for the experiments.
4. Results and Discussion
4.1. Regular Lattices and Stochastic Networks
4.1.1. Cubic Lattice
A comparison between simulated relative permeability curves for a cubic lattice with a coordination number of 6 and laboratory measured relative permeability curves for sandstone is shown in Figure 3. The image-based simulations were carried out at weakly water-wet conditions at a contact angle of 45o that correspond to predominantly frontal displacement. Although the network and laboratory plugs have similar geometric properties they produce different relative permeability curves. The comparisons clearly show the importance of topology in determining relative permeability and residual saturation. For mixed-wet systems, network relative permeability curves and other two-phase petrophysical data may not be accurately predicted [16].
Figure 3. Comparison between simulated relative permeability curves for a cubic lattice with a coordination number of 6 and laboratory measured relative permeability curves for sandstone.
4.1.2. Y* and Diamond Lattices
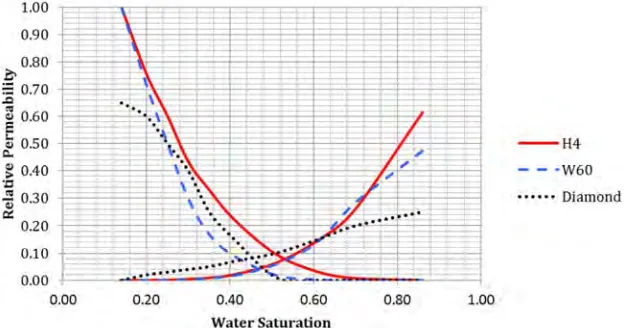
The Y* and Diamond lattices have coordination numbers of 3 and 4, respectively. The results of the comparison between simulated relative permeability curves of the Y* and Diamond lattices and laboratory measured relative permeability curves for the sandstone plugs is shown in Figures 4 and 5, respectively. Again, although the networks
have similar geometrical properties and similar coordination numbers the regular lattices provide a poor match to both laboratory measured sandstone relative permeability curves. Topological characteristic other than average coordination number are important in determining imbibition relative permeabilities.
Figure 5. Comparison between simulated relative permeability curves of the Diamond lattice and laboratory measured relative permeability curves for the sandstone plugs.
4.1.3. Matching Mean Coordination Number
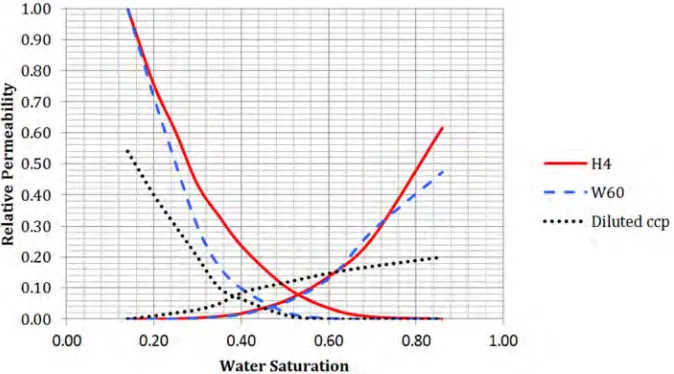
To further investigate the role of topology, the experimental relative permeability curves were compared with stochastic networks displaying increasing levels of topological complexity. Stochastic networks, matching the mean coordination number of the rock networks, were generated by diluting a regular cubic network (z=6) and a close packed cubic (ccp) lattice (z=12). The narrowest distribution, which matches the average coordination number of the rock network, is specified. Comparisons between
simulated relative permeability curves for the Fontainebleau diluted stochastic networks and laboratory measured relative permeability curves for the sandstone plugs are shown in Figures 6 and 7, respectively.
Although the diluted ccp lattice produces a somewhat better match to the rock data than the diluted regular cubic lattice, it is clear that topological characteristics other than mean coordination number are important in determining relative permeability and residual saturation.
Figure 6. Comparisons between simulated relative permeability curves for the Fontainebleau diluted cubic network and laboratory measured relative permeability curves for the sandstone plugs.
4.1.4. Matching Coordination Number Distribution
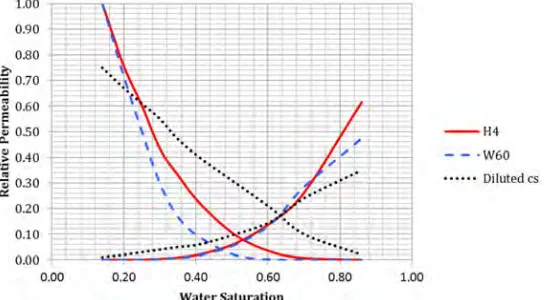
Sandstone rocks, including Fontainebleau, display a very wide distribution of coordination numbers. Therefore the effect of coordination distribution is examined by generating diluted stochastic networks from a ccp lattice (z=12) and a highly coordinated cubic star lattice (z=26) that closely matches the wide coordination number distributions of sandstone rocks. Figures 8 and 9 show that matching the
coordination number distribution produces a closer qualitative match to the laboratory measured relative permeability curves. The match is clearly better for the diluted cubic star network than for the diluted ccp network because the cubic star network can better match the full coordination number distribution of the rock network. This clearly demonstrates the important role of highly coordinated sites in determining relative permeability.
Figure 8. Comparisons between simulated relative permeability curves for the Fontainebleau diluted cs network that matches the coordination number distribution and laboratory measured relative permeability curves for the sandstone plugs.
Figure 9. Comparisons between simulated relative permeability curves for the Fontainebleau diluted ccp network that matches the coordination number distribution and laboratory measured relative permeability curves for the sandstone plugs.
4.2. Effect of Correlations; Local Pore-Throat Correlations and Longer-Range Spatial Correlation
All previous comparisons were made between experimentally measured relative permeability curves and simulated random networks where there are no correlations in geometric properties. Actual reservoir rocks, however, display local correlations in pore and throat sizes [5, 6] and longer-range spatial correlations [7]. Therefore, the role of network topology in locally and spatially correlated networks is examined to determine if the results for random networks remain valid in the presence of correlations. Local pore-throat correlations were generated by randomly assigning
spatially correlated diluted cubic star network with a coordination number distribution matched to the Fontainebleau rock network and the laboratory measured relative permeability curves. The spatial correlation used was very strong with a cut-off length scale of 0.75 the length of the network and the networks were also locally correlated. Given the greater variability expected with spatially
correlated networks [12, 13] and the presence of strong finite-size effects, the agreement between computed relative permeabilities for the locally and spatially correlated diluted cubic star network and the laboratory measured relative permeability curves is qualitatively good. This suggests that topology is also important in determining relative permeabilities for correlated networks.
Figure 10. Comparison between computed relative permeabilities for a locally and spatially correlated diluted cubic star network with a coordination number distribution matched to the Fontainebleau rock network and the laboratory measured relative permeability curves.
5. Conclusions
On the basis of the results of the present study, the following conclusions can be made:
Regular networks or stochastic networks with coordination numbers similar to the average coordination number and geometric properties of sandstone cannot reproduce the experimentally produced relative permeabilities.
Stochastic networks which match the full coordination number distribution and similar geometric properties to real sandstone rock produce relative permeabilities qualitatively similar to those experimentally measured. This conclusion is valid for both random correlated networks. Similar findings have also been reported for drainage displacement [4].
The microstructures between the extracted Fontainebleau networks and sandstone rock plugs are clearly different. Therefore, for a perfect match between relative permeability curves computed directly from 3D micro-tomographic images and laboratory measurements, the same core samples must be used.
References
[1] Olalekan, A. O., Sheppard, A. P., Arns, C. H., Sok, R. M., Cinar, Y., Knackstedt, M. A., Pinczewski, W. V.: “Experimental Investigation of Drainage Capillary Pressure Computed From Digitized Tomographic Images” SPE 99897 in proceedings of the SPE/DOE Symposium on Improved Oil Recovery. Tulsa, 22-26 April (2006).
[2] Mahmud, W. M., Arwini, S., Lalah, M.: “Experimental and Network Model Study on the Effect of Network Topology on Two-Phase Imbibition Relative Permeability”, The Thirteenth Mediterranean Petroleum Conference and Exhibition,
Istanbul, Turkey, 14-16 November (2014).
[3] Mahmud, W. M, Arns, J. Y., Sheppard, A., Knackstedt, M. A., Pinczewski, W. V.: “Effect of Network Topology on Two-Phase Imbibition Relative Permeability”, Transport in Porous Media, 66 (3), 481-493 (2007).
[4] Arns, J. Y., Robins, V., Sheppard, A. P., Sok, R. M., Pinczewski, W. V., Knackstedt, M. A.: ''Effect of Network Topology on Relative Permeability,'' Transport in Porous Media {1804}, 1-25, (2003).
[5] Lindquist, W. B., Venkatarangan, A., Dunsmuir, J., and Wong, T. F.: ''Pore and Throat Size Distributions Measured from Synchrotron X-ray Tomographic Images of Fontainebleau Sandstones,'' Journal Geophysical Research 105B, 21508 (2000).
[6] Ioannidis, M. A., and Chatzis, I.: ''A Mixed-Percolation Model of Capillary Hysteresis and Entrapment in Mercury Porosimetry,'' Journal of Colloid and Interface Science 161, 278-291 (1993).
[7] Knackstedt, M. A., Sheppard, A. P., and Pinczewski, W. V.: ''Simulation of Mercury Porosimetry on Correlated Grids,'' Physical Review E. American Institute of Physics (1999), USA, R6923-R6926, No. 58.
[8] Hewett, T. A.: ''Fractal Distributions of Reservoir Heterogeneity and Their Influence on Fluid Transport,'' paper SPE 15386 presented at the 1986 SPE Annual Technical Conference and Exhibition, New Orleans, 5-8 October.
[9] Knackstedt, M. A., Sheppard, A. P., and Sahimi, M.: ''Pore Network Modelling of Two-Phase Flow in Porous Rock: the Effect of Correlated heterogeneity,'' Advances in Water Resources 21, 257-277 (2001).
[11] Sok, R. M., Knackstedt, M. A., Sheppard, A. P., Pinczewski, W. V., Lindquist W. B., Venkatarangan, A., and Paterson, L.: ''Direct and Stochastic Generation of Network Models from Tomographic Images; Effect of Topology on Two Phase Flow Properties,'' Transport in Porous Media 46, 345-371 (2002).
[12] Paterson, L., Painter, S., Zhang, X., and Pinczewski, W. V.: ''Simulating Residual Saturation and Relative Permeability in Heterogeneous Formations,'' SPE Journal 211-218 (1998).
[13] Paterson, L., Scott Painer, Knackstedt, M., and Pincewski, W. V.: ''Patterns of Fluid Flow in Naturally Heterogeneous Rocks,'' Physica A 223, 619-628 (1996).
[14] Sheng, Q., K. E. Thompson, K. E., Fredrich, J. T. and Salino,
P. A.: ''Numerical Prediction of Relative Permeability from MicroCT Images: Comparison of Steady-State versus Displacement Methods,’’ SPE 147431 presented at the SPE Annual Technical Conference and Exhibition held in Denver, Colorado, USA, 30 October-2 November 2011.
[15] Mahmud, W. M.: “Experimental Validation of Two-Phase Imbibition Relative Permeability with a Stochastic Model Taking into Account the Effects of Correlations”, MOC - 8th Mediterranean Offshore Conference and Exhibition , Alexandria, Egypt, 19-21 April 2016.
![Figure 1. A slice taken from
the core plug [5].](https://thumb-us.123doks.com/thumbv2/123dok_us/9898973.1977357/2.595.115.219.633.744/figure-slice-taken-core-plug.webp)