VOLUME 41, ARTICLE 12, PAGES 331
-
366
PUBLISHED 25 JULY 2019
http://www.demographic-research.org/Volumes/Vol41/12/ DOI: 10.4054/DemRes.2019.41.12
Research Article
Impacts of education and immigration on the
size and skills of the future workforce
Samuel Vézina
Alain Bélanger
This publication is part of the Special Collection on “Drivers and the potential impact of future migration in the European Union,” organized by Guest Editors Alain Bélanger, Wolfgang Lutz, and Nicholas Gailey.
© 2019 Samuel Vézina & Alain Bélanger.
This open-access work is published under the terms of the Creative Commons Attribution 3.0 Germany (CC BY 3.0 DE), which permits use, reproduction, and distribution in any medium, provided the original author(s) and source are given credit.
1 Introduction 332
2 Theoretical framework 334
3 Data and research methods 336
3.1 The microsimulation projection models 336
3.2 Variable categories and conventions 338
4 Hypotheses and scenarios 339
5 Results 342
5.1 Projection results under the different immigration and education scenarios
342
5.2 Composition and skills of the future workforce 346
6 Discussion 348
7 Conclusion 351
8 Acknowledgements 352
References 354
Impacts of education and immigration on the size and skills of the
future workforce
Samuel Vézina1
Alain Bélanger2
Abstract
BACKGROUND
In most developed countries the demographic regime is characterised by low fertility, high immigration, and population ageing. This regime impacts on the size of the labour force population, the ethno-cultural composition, and potential productivity.
OBJECTIVE
We examine the prospective impacts of two sociodemographic changes, namely increasing education and increasing immigration levels, on the size and skills of the workforce aged 25 to 64 years old for the time period 2011–2061.
METHODS
We use microsimulation models to project the population of Austria and Canada by age, sex, and several other socioeconomic and ethno-cultural dimensions. Using ‘what-if’ scenarios, we measure the impact of different immigration rates and immigrant selection patterns on the size and average literacy skills of the projected workforce. We also examine the potential effects of different assumptions about future educational attainment on the projection outcomes.
RESULTS
The results show that the volume of immigration heavily influences the expansion of the workforce .In terms of education among the general population, the rise in educational attainment is positively correlated with higher skill levels. However, increased immigration can override the effect that increasing education levels have on advancing workforce skills.
CONTRIBUTION
This paper shows the extent to which Austria and Canada have adopted diametrically opposed strategies regarding the future development of their workforces. Assuming that
current policy goals hold true in the coming decades, Austria is likely to rely on a higher-skilled but declining (in size) workforce, whereas Canada will rely on a fast-growing but less-skilled and more culturally diversified workforce.
1. Introduction
In most developed countries, current immigration has reached historical levels: population growth is now mainly fuelled by immigration (Wilson et al. 2013). In the context of population ageing, where a growing number of people are about to withdraw from the labour market, pressures to keep immigration rates at high levels are likely to persist.
However, developed countries have different approaches to migration. On one hand, there are countries with a long history of immigration such as the United States, Canada, Australia, and New Zealand. Despite important variation over time, they have admitted record numbers of immigrants for centuries. The United States is still the OECD’s leading destination country, receiving about 20% of the global immigrant inflow, whereas Australia, New Zealand, and Canada have some of the highest proportions of foreign-born populations (OECD 2017a). These latter countries have a specific government-led selection system, with policies targeted to attract a larger share of higher-educated immigrants (Papademetriou and Sumption 2011).
In Western European countries migration issues have also been of great importance, but the immigrant-selection mechanisms and citizenship-granting philosophies are different. European policymakers have been challenged by issues resulting from geopolitical events such as the dissolution of the Soviet Union, European Union (EU) enlargement (and Schengen area implementation), and, most recently, the so-called refugee crisis, with millions of asylum seekers coming from the Middle East, Africa, and Asia. Since 2005 the European Commission has developed and implemented a Global Approach to Migration and Mobility to better manage migration through the development of ‘mobility partnerships’ with sending countries. The approach also aims to maximise the development impact of EU external migration and better address the issue of integrating the foreign-born into the labour force (Geddes and Scholten 2016).
(Barakat and Durham 2014; Meyer et al. 1977; Wils and Goujon 1998). Using projection scenarios, experts have shown how increased human capital (in terms of educational attainment) can influence the consequences of population ageing in terms of labour force population and public pensions and other health and social expenditures (Lutz, Butz, and KC 2014).
As both immigration and educational attainment are increasing, concerns about immigrant educational attainment and labour market integration have entered policy discussions. A large body of literature documents various aspects of the deteriorating economic outcomes among recent immigrants (Aydemir and Skuterud 2005; Borjas and Friedberg 2009; Clark and Drinkwater 2008; Rosholm, Scott, and Husted 2006). However, these studies mostly use standard educational attainment variables to assess the human capital of immigrants. The Organization for Economic Cooperation and Development’s (OECD) and its Programme for the International Assessment of Adult Competencies (PIAAC) has developed a more direct measure of skills, which assesses proficiency in key information-processing skills. Even though such an assessment does not reflect all human capital and skills (St. Clair 2012), the measure provides interesting insight into the human capital of the adult population, since it seems to better capture labour-market-relevant skills than standard measures of educational attainment (Bonikowska, Green, and Riddell 2008; Ferrer, Green, and Riddell 2006). In most OECD countries, immigrants have a lower literacy level but a higher overall education level than the native-born (Green and Riddell 2007; OECD 2016). This implies that the actual skills brought into labour markets through immigration are significantly lower than suggested by assessments based on immigrant level of education (Green and Worswick 2017).
Literacy proficiency varies across countries and across groups of individuals, and the determinants are numerous. Studies show that literacy declines with age (Desjardins and Warnke 2012; Green and Riddell 2013; Paccagnella 2016) but increases with education (Green and Riddell 2007; OECD 2016). Specific immigrant characteristics such as age at immigration (generation status), country of birth, mother’s education level, and the language spoken at home are all significant predictors of literacy proficiency.
defined as “the ability to access, use, interpret and communicate mathematical information and ideas, in order to engage in and manage the mathematical demands of a range of situations in adult life” (OECD 2012: 33). Thus, using numeracy instead of literacy skills would lead to very similar results.
With a specific focus on two developed countries, Austria and Canada, this research uses microsimulation models to assess how education and immigration levels impact the size of the future workforce and its average literacy skill level. Austria and Canada are two developed OECD member countries, yet they generally have different immigration traditions, policies, approaches. Comparing these two countries provides an understanding of how the determinants of literacy skills can vary from one country to another and how different contexts (e.g., migration) can influence the average literacy skill level of the future workforce. The study presents two microsimulation models (PÖB and LSD–C), which project the future population by many more dimensions than age and sex. The models incorporate immigration status, ethno-cultural variables, and many other dimensions that are either important determinants of demographic behaviours such as education, or are closely linked to sociodemographic characteristics such as labour force participation and literacy skill proficiency. Using ‘what-if' scenarios, the results disentangle potential impacts of likely sociodemographic changes – such as increasing education and immigration levels – on the overall literacy proficiency of the active population between 2011 and 2061. This research generates new knowledge relevant to policymaking on migration, social cohesion, and labour market needs and changes, as well as the needs involved in developing educational skills.
2. Theoretical framework
socioeconomic change (ranging from values and religions to skills and productivity of the labour force) using a demographic paradigm” (Lutz 2013: 283–284).
In conjunction with the aggregate-level changes predicted by Demographic Metabolism, individual behavioural shifts may also act as a source of macro-level social change. Therefore, the theoretical basis of our research programme links to multiple micro-level theories (Human Capital and New Home Economics, Social Capital, Life Course, etc.), on which the different simulated transitions are modelled. The specific theoretical framework underpinning the literacy skills analysis derives from approaches developed by Desjardins (2003a) and Barone and van de Werfhorst (2011). These researchers assert causal relationships between schooling, skills, and economic and social outcomes, which have been studied extensively in the scientific literature (Chesters, Ryan, and Sinning 2013; Green and Riddell 2003; Hanushek et al. 2015). Education is considered to be the main driver of literacy skill formation (Green and Riddell 2007; OECD 2016), triggering the development of skills and maintaining them over the life course (Desjardins 2003b). Our framework recognises the functional definition of Human Capital theory (Becker 1964) regarding the connection between schooling pathway and productivity, while also asserting the influence of social structure and learning context during childhood (cultural and social capital) on the schooling pathway and economic outcomes (Bourdieu 1979; Bynner and Parsons 2009; Gimenez-Nadal and Molina 2012; Hart and Risley 1995; Hassrick, Raudenbush, and Rosen 2017; Kerckhoff 1986). Aside from the schooling pathway, we recognise the importance of the learning context during childhood for cognitive skill acquisition and maintenance during adulthood (Dickinson and Neuman 2006). Finally, the Practice-Engagement theory (Reder 1994) asserts that observed skill level is a function of the use of skills (incidence, frequency, complexity) on a daily basis in everyday life. The analysis of the determinants of literacy skill proficiency is based on the concept that the practice of reading skills at home and at work (known as life-wide factors3) is a
pertinent dimension worth consideration.
Our analysis is further rooted in the Segmented Assimilation thesis (Portes and Zhou 1993). From the original assimilation perspective, acculturation occurs through a linear process by which diverse ethnic groups gradually change their behaviours to adopt those of the majority and eventually share its culture. Studies have shown that most of the demographic and socioeconomic behaviours of immigrants tend to converge more or less rapidly with the level of the native-born population as the duration of residence in the host country increases (Adserà et al. 2012; Bloom, Grenier,
3 Desjardins (2003b) differentiates lifelong learning from life-wide learning. Lifelong learning refers to
and Gunderson 1995; Borjas 1985; Chiswick 1978; Ford 1990; Kahn 1988). According to classical assimilation theory, immigrants of the 1.5 generation4 and the second
generation alike will integrate more rapidly and adopt mainstream values more easily because they are enrolled in the host country school system. Although the assimilation perspective has been challenged (le Grand and Szulkin 2002; Licht and Steiner 1994), it nevertheless underlines the importance of taking the year of immigration into account when studying and projecting the behaviours of newcomers (Duleep and Dowhan 2002; Hall and Farkas 2008; Hudson 2007; Powers and Seltzer 1998). Moreover, time does not seem to operate uniformly on all immigrants. Divergent outcomes have been observed across both cohorts of immigrants and ethnic minority groups (Causa and Jean 2007; Dustmann and Fabbri 2005; Lemos 2017; Poot and Stillman 2016). The New Labour Market Segmentation theory provides an interesting framework to view these divergent outcomes, as it accounts for the possibility of different minority groups being either permanently confined to the underclass or advancing rapidly economically.
In its empirical application, this theoretical framework requires a projection model that goes beyond age and sex and allows for the simultaneous projection of several variables. As shown in the above paragraphs, age at immigration, along with length of stay in the host country and generation status, are important variables to consider when studying ethno-cultural differences in demographic or socioeconomic behaviours. Accordingly, this paper uses microsimulation models (see Section 3 on data and method), which capture the effect of changes in population composition better than traditional cohort-component projection models.
3. Data and research methods
3.1 The microsimulation projection models
PÖB (Projektionsmodell der österreichischen Bevölkerung) and LSD–C (Laboratoire de simulations démographiques – Canada) are the two microsimulation models used in this research, which project the populations of Austria and of Canada respectively. These models project the total population by age, sex, immigrant status, country of birth, education status, labour force participation, literacy skills, and other variables related to immigrants such as age at immigration and length of stay in host country.
PÖB and LSD–C are built on a similar framework, with the shared broad objective of projecting ethno-cultural diversity and the future composition of the population and
labour force.5 They were developed using Modgen 12, which is a C++ based
microsimulation language developed and maintained by Statistics Canada6 (Statistics
Canada 2017). Both models are case-based in the sense that every individual is simulated separately from other individuals and no interactions between individuals are allowed (except for interactions between mother and children). PÖB and LSD–C are dynamic: they allow for changes in individual characteristics over the life course as well as for inter-generational transfers of some characteristics from mother to child.7
The models are in continuous time and characteristics of individuals are modified continuously in ‘real time’. The starting year for both models is 2011; the Austrian population is based on the Austrian Labour Force Survey (LFS) and the Canadian population on the 2011 National Household Survey public-use microdata file (NHS– PUMF).8 Individuals from the base population are simulated one by one and their
characteristics are modified through events determined by the values of their specific input parameters at any given time during the projection period.
PÖB and LSD–C are open to international migration, which has been a crucial component of population change in contemporary Western societies and is a driving factor in changing the stock of human capital. The immigration module includes all classifications, state variables, and parameters relevant to immigrants and immigration: immigration level and composition, immigrant status, age at immigration, duration since immigration, generation status, and place of birth. The module works as follows: in every projection year, a new immigrant cohort enters the simulation. All simulated immigrant cohorts from 2012 to 2061 have the characteristics of the recent immigrants as observed in 2011. These recent immigrants are defined as those having lived in the host country for less than 5 years. This method for generating immigrants implies that all immigrant cohorts have the same characteristics as recently observed immigrants. To allow for some variation, the individual weights are adjusted to match desired distributions. Thus, through re-weighting, it is possible to change the immigrant distribution according to age, education, and other variables. Finally, the volume of
5 For a thorough description of this framework, readers are invited to consult the publication Bélanger et al.
(2018). The Canadian model (LSD–C) projects the population by more variables than the Austrian model (PÖB). For example, LSD–C simulates internal migrations, and therefore projection results can be disaggregated by province of residence. LSD–C also projects the population by knowledge of official languages, visible minority group, country of highest diploma, and religion. In both microsimulation models the list of variables is kept relatively short, leading to aggregate projections that are generally similar to those obtained by traditional population projections, while adding valuable details.
6 Modgen and its documentation can be downloaded for free from the Statistics Canada’s website at:
http://www.statcan.gc.ca/eng/microsimulation/modgen/modgen.
7 For a more detailed introduction to microsimulation in the social sciences and population projections, see
van Imhoff and Post (1998).
8 At its point of departure in 2011, the age structure in Austria is slightly older than that in Canada. For
immigration, i.e., the number of immigrants entering the simulation each year, can be modified as well.
Demographic assumptions of future mortality and fertility are identical to the assumptions of the Medium (SSP2) scenario for Austria (Wittgenstein Centre for Demography and Global Human Capital 2015) and to the medium-growth (M1) scenario of most recent official Canadian projections (Statistics Canada 2015). In Canada, projections assume that the Total Fertility Rate (TFR) will remain at around 1.67 children per woman; in Austria, the TFR starts at 1.45 in 2011 and reaches 1.61 at the end of the projection in 2061. Regarding mortality, life expectancy at birth increases from 79 to 88 years for Canadian men and from 84 to 89 years for Canadian women. Assumptions are similar in Austria, although a little more optimistic: life expectancy is projected to increase from 79 to 89 years for men, and from 84 to 93 years for women.
All other parameters are derived from a variety of sources and methods: describing all of them is beyond the scope of this paper. In general, model parameters are estimated using logistic regressions from several data sources: censuses, vital statistics, social surveys, labour force surveys, and population estimates. For a more detailed description of the models, including methods and assumptions, see Bélanger et al. (2018). More details on the projections (parameters and methodology) of literacy skill proficiency are provided in the following section.
3.2 Variable categories and conventions
Despite the traditional definition of the workforce as encompassing the economically active population 15 years of age and over, the age range considered throughout this study is limited to persons aged 25 to 64 years old. The 15+ population is too heterogeneous in terms of age-specific participation rates, education level, and literacy skill proficiency to adequately tackle the research objectives of this paper. Instead the 25–64 years cut-off was selected in order to focus on the age range where individuals have the highest participation rates, with the assumption that by the age of 25 most people have completed their education pathway. In both Austria and Canada the retirement age is 65 years,9 justifying the other end of the range used. Finally, this
cut-off point is necessary, as data on adult literacy skills (PIAAC Survey) is not collected for persons older than 65 years.
Both microsimulation models have a literacy skills projection module. During the simulation, only the population aged 25 to 64 is assigned a literacy score. Literacy scores are updated whenever the characteristics of relevant actors undergo changes.
9 In Austria the normal pension age is 65 for men. The retirement age for women is currently 60 years, but
Parameters were assessed using the most recent cycle (2012) of PIAAC survey data. In this survey the respondents’ literacy proficiency is measured along a continuous scale ranging from 0 to 500, where a higher score indicates greater proficiency. The series of tasks used for assessing literacy range from reading a product label or locating a single piece of information, to reading newspaper article and distilling information. To help organize and interpret the scores, the scale is divided into proficiency levels. For example, Level 3 ranges between 276 and 325 points on the 0–500 literacy scale. At any given level, individuals can successfully complete certain types of task. For example, at Levels 1 and 2 respondents can read and understand relatively short texts, whereas Levels 4 and 5 require multistep operations to integrate, synthesise, and interpret information (OECD 2016). The international ranking shows that Canada (with an average literacy score of 273.5) remains close to the OECD average (272.8), behind countries such as Japan (296.4) and Finland (287.6), but ahead of countries such as France (262.1) and Italy (250.5). With an average literacy score of 269.5, Austria ranks just below Germany and the United States, which both have 269.8 points on average (OECD 2013a).
Regression analyses of the log10 scores were conducted and stratified by
immigration status in order to consider specific characteristics of the foreign-born population. Literacy proficiency depends on sociodemographic variables (age, sex), human capital variables (education level), socioeconomic variables (mother’s education level, labour force status), and life-wide factors, and on the variables linked to characteristics specific to immigrants, such as age at immigration, years in host country since migration, and country of birth.11 In the LSD–C, parameters for the literacy skills
module also vary by province of residence, mother tongue, language spoken at home, and country of highest diploma. In the Appendix we provide more details on our analyses, the factors linked to literacy proficiency, and our estimations of the projection parameters.
4. Hypotheses and scenarios
Projection scenarios are formulated according to specific sets of assumptions about both general-level phenomena and characteristic-specific differentials between
10 A simple logarithmic transformation is made on the dependent variable (literacy score) to ensure that the
linear regression model will not lead to an illogical predicted score (below 0) during the simulation.
11 In our analyses as well as in both microsimulation models, the country of birth variable has three
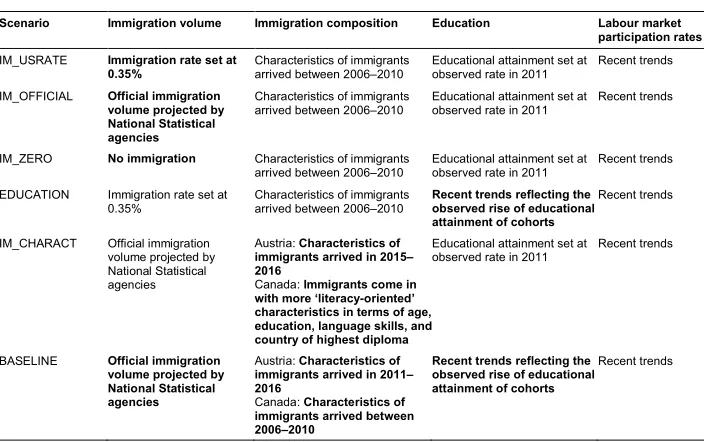
individuals with the likelihood of experiencing an event. For example, models allow for changes in total fertility level over time and fertility differentials linked to certain characteristics such as education level or immigration status. Table 1 sums up the underlying hypotheses of the different scenarios, designed according to immigration, education, and labour market participation rates.
Table 1: Summary of projection scenario assumptions
Scenario Immigration volume Immigration composition Education Labour market participation rates
IM_USRATE Immigration rate set at 0.35%
Characteristics of immigrants arrived between 2006–2010
Educational attainment set at observed rate in 2011
Recent trends
IM_OFFICIAL Official immigration volume projected by National Statistical agencies
Characteristics of immigrants arrived between 2006–2010
Educational attainment set at observed rate in 2011
Recent trends
IM_ZERO No immigration Characteristics of immigrants arrived between 2006–2010
Educational attainment set at observed rate in 2011
Recent trends
EDUCATION Immigration rate set at 0.35%
Characteristics of immigrants arrived between 2006–2010
Recent trends reflecting the observed rise of educational attainment of cohorts
Recent trends
IM_CHARACT Official immigration volume projected by National Statistical agencies
Austria:Characteristics of immigrants arrived in 2015– 2016
Canada:Immigrants come in with more ‘literacy-oriented’ characteristics in terms of age, education, language skills, and country of highest diploma
Educational attainment set at
observed rate in 2011 Recent trends
BASELINE Official immigration volume projected by National Statistical agencies
Austria:Characteristics of immigrants arrived in 2011– 2016
Canada: Characteristics of immigrants arrived between 2006–2010
Recent trends reflecting the observed rise of educational attainment of cohorts
Recent trends
Three scenarios were designed as variations in volume of immigration:
· IM_OFFICIAL: The absolute number of immigrants is set to the officially observed (2011–2015) and projected (2015–2061) numbers published by Statistik Austria (2016) and Statistics Canada (2015). In Canada the official targets correspond to an immigration rate of 0.75%. In Austria the immigration rate surpassed 1.3% in 2015, but is projected to drastically decrease to below 0.35% by 2026 and to remain constant at around 0.25% from then onward. These numbers reflect current official national immigration targets.
· IM_ZERO: The immigration rate is set to zero. This scenario is highly unrealistic but serves the purpose of measuring the range of influence that migration has over the projected outcomes.
In these scenarios the educational attainment of young adults is set to the level observed in 2011. However, historical data shows a steady increase in the educational attainment of cohorts over the past decades. Therefore, the following scenario was designed:
· EDUCATION: Designed to measure the impact of these trends on the projected outcomes. More specifically, the EDUCATION scenario assumes that the educational attainment of cohorts will continue to rise between 2011 and 2026 and will remain constant after 2026. The rise observed in recent decades was too substantial to be maintained for three more decades, i.e., between 2026 and 2061. Under this scenario the immigration rate is set at 0.35% between 2011 and 2061 for both models, as in the IM_USRATE scenario.
2015/2016. In the Canadian model, under the IM_CHARACT scenario, the simulated distribution of immigrant cohorts is slightly modified to reflect a plausible change in Canada’s immigrant selection policies that would foster the admittance of immigrants with even more ‘literacy-oriented’ characteristics (younger, more-educated, higher language skills, etc.). More precisely, the distribution of simulated immigrants is modified as follows: it has 5% more persons aged 0 to 30 years old, 5% more university graduates, 7% more individuals whose highest diploma was obtained in Canada, and 11% more people whose mother tongue is either French or English.
Finally, the most likely assumptions with respect to immigration and education in Austria and Canada were merged into one last scenario (BASELINE). More precisely, immigration volume is set according to the reference scenario of the most recent projections from the national statistical agencies (Statistics Canada 2015; Statistik Austria 2016), which reflect official national immigration targets. Regarding the composition of immigration, the simulated distribution of immigrant cohorts is modified to reflect the characteristics of the total immigrant population admitted to Austria during the 2011–2016 period. This distribution is therefore a blend of the pre-2015 flows and the pre-2015 refugee flow. In the Canadian model the hypotheses used in the BASELINE scenario expect that the characteristics of future immigrant cohorts will be similar to the characteristics of recent immigrants. Finally, the BASELINE scenario assumes that the educational attainment of future cohorts will continue to rise between 2011 and 2026, remaining constant after 2026. Indeed, experts have shown that the increases observed in the last decades are likely to hold in the future (Barakat and Durham 2014; KC et al. 2010; Lutz, Butz, and KC 2014).
No specific scenario was designed with respect to labour force participation rates, as it would fall beyond the scope of this paper. The reference hypotheses assume lower participation rates for foreign-born workers, increased female labour participation, and increased participation of the 55+ population. These hypotheses extrapolate from the most recent trends observed in both Austria and Canada (Loichinger 2015; Martel et al. 2011).
5. Results
5.1 Projection results under the different immigration and education scenarios
happen if the assumptions were proven correct. They should be considered as prospective exercises, designed to support decision-making and policy planning rather than to predict the future.
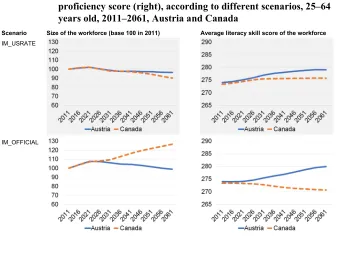
Figure 1 presents the projection results of all six scenarios for both countries. The projected size of the future workforce is illustrated on the left-hand side and the projected literacy proficiency on the right-hand side. The projected active population aged between 25 and 64 years old is expressed in terms relative to its 2011 size (base100
= 2011),12 and projected literacy proficiency is the mean score of the workforce aged 25
to 64 years old.
Figure 1: Projected size of the workforce (left) and its average literacy proficiency score (right), according to different scenarios, 25–64 years old, 2011–2061, Austria and Canada
Scenario Size of the workforce (base 100 in 2011) Average literacy skill score of the workforce
IM_USRATE
IM_OFFICIAL
12 Index numbers are used to express the difference between two measurements by designating one number as
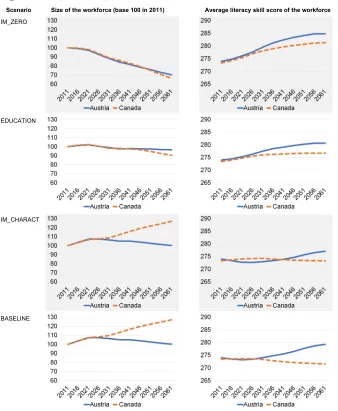
Figure 1: (Continued)
Scenario Size of the workforce (base 100 in 2011) Average literacy skill score of the workforce
IM_ZERO
EDUCATION
IM_CHARACT
BASELINE
2011 by 4% in Austria and by 10% in Canada. In other words, when keeping the immigration rate at 0.35% and assuming that educational attainment of future cohorts will not increase and will remain constant at the 2011 level, the projected workforce of both countries is likely to decrease in the coming decades. On the other hand, under this scenario the average literacy proficiency is likely to increase in both countries: we observe a 5-point increase in Austria from 274 to 279 and a 3-point increase in Canada from 273 to 276. This scenario reveals that under equivalent assumptions of immigration and education the general demographic dynamics are not favourable to growth of the active population, but it fosters increases in literacy skills proficiency.
In the IM_OFFICIAL scenario all hypotheses of the IM_USRATE scenario are kept the same, apart from the absolute number of immigrants, which is set to the drastically contrasting official national immigration targets of the two countries: between 2011 and 2061 Canada’s immigration intake objectives are twice as high as Austria’s. This difference has a clear impact of the projected workforce and their skills. The total active population projected in Austria by 2061 is close to the 2011 level, and there is a clear increase in average literacy skills proficiency. On the other hand, Canada’s high immigration rate – which is the highest by far among the G7 countries (OECD 2017b) – leads to a 27% increase in its active population between 2011 and 2061, growing from 15.2 to 19.2 million persons. Furthermore, the projected literacy score is likely to decrease in the next 50 years by almost 3 points on average.
The results obtained under the no-immigration scenario (IM_ZERO) amplify those of the IM_USRATE scenario. Over the 2011–2061 period the total workforce steadily decreases in both countries, by 30% in Austria and by 34% in Canada, while the average skill level increases by 11 points in Austria and 8 points in Canada. This scenario shows the extent to which the growth of the population is dependent on immigration intakes in both countries. On the skills side, this projection shows that despite the fact that the IM_ZERO scenario does not assume that the trend of increasing education will continue, there is already significant inertia in the demographic dynamic which fosters rising skills among the workforce. In both countries, retiring older workers are likely to be replaced by more-educated younger workers, regardless of immigration intakes, which increases the projected average skill level.
In the IM_CHARACT scenario all hypotheses of the IM_OFFICIAL scenario are kept the same, apart from the composition of the simulated newcomers. When playing with assumptions about the characteristics of future immigrants (and not the immigration level per se), we observe no significant impact on the projected size of the workforce. However, notable differences are observed in the skills of the projected workforce. In Austria the IM_CHARACT scenario assumes that immigrants have the characteristics of those who arrived during the 2015 ‘refugee crisis’ (not only the refugees, but all immigrants admitted in 2015 and 2016). Under this scenario the projected average skills proficiency declines between 2011 and 2021 but recovers in 2061, reaching 277 points. In Canada the IM_CHARACT scenario assumes that future admitted immigrants will have characteristics that foster higher literacy skills. The results suggest that changes to immigrant selection policies could prevent the projected skills decline of the Canadian workforce observed in the IM_OFFICIAL scenario while keeping its immigration targets at a very high rate. Indeed, under the IM_CHARACT scenario the projected average literacy score in 2061 is 273, which is equivalent to the 2011 level.
Finally, under the BASELINE scenario the total Austrian workforce is likely to remain more or less constant between 2011 and 2061. By 2061 the projected active population will increase by 0.1% of its 2011 level. On the other hand, high immigration targets in Canada lead to a 27% increase in its active population between 2011 and 2061, growing from 15.2 to 19.4 million persons. While the Canadian workforce is likely to increase due to its high immigration rate, the skills of its workforce are likely to decrease. The opposite effect is likely to be observed in Austria: the future Austrian workforce is likely to have higher literacy skills as the average rises from 274 in 2011 to 279 in 2061. With such a score, Austria would be pushed up to the level of the Scandinavian countries13 in international ranking , assuming that the average literacy
level in the other OECD countries remains at the 2012 level.
5.2 Composition and skills of the future workforce
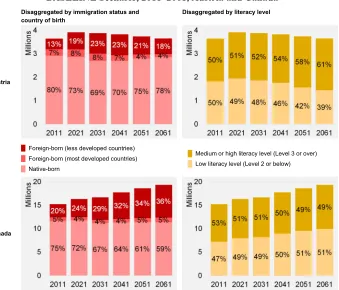
In this section we study the impact of likely sociodemographic changes on the composition and skills of the future workforce. Figure 2 shows the projection results obtained under the BASELINE scenario, disaggregated by immigration status (and country of birth) and literacy skill level. As explained in the appendix, immigrants born in the most developed (richest) countries of the world are grouped together and correspond to immigrants born in North American and Western European countries as well as Australia, Japan, New Zealand, Singapore, and South Korea. Immigrants born
in other countries fall into the category ‘Foreign-born (less developed countries)’. Regarding literacy level, individuals scoring level 3 or higher, i.e., 276 points or over on the literacy scale, are grouped together and are compared with those scoring below 276 points.
Figure 2: Projected workforce population aged between 25 and 64 years old, by immigration status (country of birth) and literacy level,
BASELINE Scenario, 2011–2061, Austria and Canada Disaggregated by immigration status and
country of birth
Disaggregated by literacy level
Austria
█ Foreign-born (less developed countries)
█ Foreign-born (most developed countries)
█ Native-born
█ Medium or high literacy level (Level 3 or over)
█ Low literacy level (Level 2 or below)
Canada
proportion of native-born Austrians among the 25–64 workforce is projected to decrease from 80% in 2011 to 69% in 2031, but rises up to 78% in 2061. If the assumptions about future Austrian immigration composition hold true, the share of foreign-born in Austria (from most-developed countries) is likely to decline by almost half (from 7% in 2011 to 4% in 2061). As for Canada, the proportion of foreign-born workers (regardless their country of birth) will increase from 25% to 41%. This proportion is almost twice as high as the proportion projected for Austria in 2061 (22%). The increase in Canada is fuelled entirely by immigrants coming from less-developed countries. As a result, the proportion of native-born Canadians in the 25–64 workforce decreases from 75% in 2011 to 59% in 2061. Interestingly, in both countries the absolute number of native-born workers is likely to remain quite stable over time. The projected number of immigrants (immigration volume) only impacts the relative prevalence of native-born workers among the total workforce.
When looking at these projections by literacy level, in Canada the distribution of the workforce remains fairly stable. The proportion of workers scoring level 3 or higher slightly decreases, from 53% in 2011 to 49% in 2061. In Austria the rise of the overall skill level of the workforce is clear. The proportion of workers scoring level 3 or higher increases from 50% in 2011 to 61% in 2061.
6. Discussion
With a specific focus on two developed countries, Austria and Canada, this research uses microsimulation models to assess how education and immigration levels impact workforce size and average literacy skill level. Comparing countries is not always an easy task. The use of different ‘what-if’ scenarios provides a basis for making such comparisons.
The IM_USRATE and the IM_ZERO scenarios reveal strong similarities between Austria and Canada regarding the demographic dynamic (population ageing) that drives the renewal of their workforces. Indeed, when immigration rates are kept constant at 0% or 0.35%, the projected workforce (expressed in relative terms) evolves in a similar manner for both countries. Under constant and comparable immigration assumptions, the results show that growth of workforce size relies heavily on immigration intake. Regarding education, whether or not increasing trends hold true in the future has very little impact on the projected expansion of the future workforce. On the other hand, rising educational attainment trends have a significant influence on the average literacy skills of the workforce and the overall adult population aged 25 to 64 years old.
have adopted different strategies regarding the future development of their workforces. Under actual Austrian immigration targets, the total workforce (25–64 years old) is likely to be the same size in 2061 as it was in 2011 (stable workforce population). This strategy appears to foster improvement in the skills of the active Austrian population. Again, these projections do not predict the future; official national immigration targets are likely to evolve and might in fact change rather quickly to better adapt to future socioeconomic contexts.
In Canada the growth of the workforce seems to be the most important objective, despite probable negative impacts on the average skills proficiency of the workers, and possibly on labour in general. While the contributions of immigration are still the subject of debate in public discourse, the current Canadian policy does not seem to be supported by evidence-based information but rather appears to be determined by faith in the long-term benefits of high immigration levels (Green and Green 2004; Romaniuk 2017). As Beaujot (2017) points out, admitting more people fuels Gross Domestic Product (GDP) growth in absolute terms but does not have a significant positive impact on GDP per capita. Moreover, immigration has no effect on employment, wages, innovation, or patenting (Green and Worswick 2017; Picot 2013). In our view, the persistent argument put forward since the late 1980s for ever-increasing immigration levels in Canada mostly relies on subjective arguments (related to nation-building and the place of Canada in the world) rather than scientific evidence on economic benefits for Canadians (GDP per capita growth).
In terms of immigration rate, the Austrian targets are close to most G7 and other developed countries (OECD 2017b). This might come with a certain macroeconomic price, as it will not foster sustained growth of the workforce. A stable workforce as opposed to a growing workforce might hinder long-term GDP growth in absolute terms, and thus general expansion of the national economy. However, a more productive workforce might mitigate this potential missed growth due to the increasing education level and average literacy. This strategy could in fact be beneficial in terms of GDP per capita, as a higher skilled population could result in increased productivity, particularly in the context of the knowledge economy and knowledge-based societies.
that it can also have negative economic and social effects (Collier 2013; Levy 2017; Patsiurko, Campbell, and Hall 2012; Portes and Vickstrom 2011).
Microsimulation models constitute innovative tools to better inform “the public, but also to provide the means for policy makers and advisors to assess the impacts of their policies and programmes and to increase their effectiveness and cost-efficiency” (Wolfson 2011: 3). The models and their projection results presented in this paper provide clear examples. They project the impacts of different plausible immigration policies regarding immigration volume and characteristics in conjunction with future demographic trends. Indeed, the models show the apparent relationship between immigration volume and population growth. The recent ‘refugee crisis’ has modified Austria’s immigration rate – momentarily – with a significant impact on its population structure. Results also show the extent to which the characteristics of newcomers can impact the literacy skills of the total workforce. In a simulation where the Canadian points-based system selects immigrants with higher language skills (the proportion of immigrants whose mother tongue is either French or English is increased by 11%), the projected skills decline of the Canadian workforce is completely mitigated, while immigration targets are kept relatively high (official targets).
On labour policies, the projections presented in this paper assess skills on the supply side. More detailed studies could analyse future potential shortages (or oversupply) in terms of number of workers, as well as in terms of skills and education level. Further policies and programmes targeting adult training or linguistic, economic, and social integration of immigrants can also be tested with our models.
However, the models have some limitations. First, the labour force participation module of both models derives participation rates to provide adequate aggregate cross-sectional descriptions. However, the module yields incoherent individual life courses, as there are no specific transition probabilities between the active and the inactive states. Indeed, individual actors are susceptible to changing their participation status from one year to another without any consideration in the calculation of the previous activity status. Further development of the models should introduce transition probabilities between states according to characteristics of the actor as well as according to duration in a given state.
Likewise, it would be interesting to have a dynamic projection module for literacy skills proficiency that could simulate the individual skill trajectories. The parameter estimations of the actual projection module provide some hint of the forces that underlie skill gain and loss for people aged between 25 and 64 years old. However, the model generates statically derived projections as it imputes a literacy score to individuals based on many characteristics. Longitudinal data on adult literacy skills14
would be needed to generate dynamic literacy projection results.
In the actual version of the models the projected variation of the literacy score is constrained by the regression models’ coefficients shown in the Appendix. Consequently, the models do not correctly account for variance observed in the PIAAC survey data. A component of uncertainty could be added in further development of the models, although the projection outcomes would not be substantially different. To test the extent to which different sociodemographic characteristics influence the literacy skills of the future workforce, the version of the models used in this study is convenient and generates pertinent results.
7. Conclusion
This paper shows that under a constant immigration rate of 0.35%, microsimulation models project a declining labour force population for both Austria and Canada between 2011 and 2061. They project that the active population aged 25 to 64 years old will decrease by 4% in Austria and by 10% in Canada during the period. Due to demographic ageing the overall participation rates (of the 15+ population) are also likely to decline. The rising trends in educational attainment are positively affecting the overall skill level of the workforce, but changes in immigration level can offset this effect. The projected labour force populations of Austria and Canada are different, mainly due to their divergent immigration contexts and targets. The two countries appear to have adopted diametrically opposed strategies with regards to the future development of their workforce: in the coming decades, Austria will rely on a higher-skilled workforce, whereas Canada will count on a fast-growing workforce. This research provides an analytical tool for understanding the evolution of skills in the Austrian and Canadian contexts based on foreseeable changes in population characteristics.
The methodology presented in this paper could easily be applied to other countries (or regions) that participated in the PIAAC survey.15 Information-processing skills such
as those measured in the PIAAC survey are important assets in contemporary society. There are numerous positive relationships between these skills and many indicators of wellbeing and labour market success (OECD 2016). Understanding better how and why there is a significant gap in literacy proficiency between the foreign- and native-born in the OECD countries is crucial. Immigrants’ lower literacy proficiency has important implications for the overall skills of the future workforce, since this gap is comparable in magnitude to the difference between respondents having upper secondary education or tertiary education (Bonikowska, Green, and Riddell 2008; OECD and European Union 2014).
Relationships between social and economic outcomes and policies are generally complex and multifactorial. Microsimulation models based on detailed microdata provide innovative tools to answer carefully constructed ‘what-if’ questions and to assess the specific impact of underlying processes on key outcomes. By comparing the outcomes of these scenarios with the baseline situation, it is possible to measure the influence of specific processes and dynamics. Microsimulation models that project the population (and its sociodemographic characteristics) can be developed and used to compare the impacts of different immigration histories, different foreign-born populations in terms of sociodemographic characteristics, different integration policies, and different educational systems. The projection methodology and models can always be further improved, elaborated, and above all adapted to country-specific contexts. Microsimulation models fed with PIAAC data can significantly help to address policy issues and tackle broad societal challenges in contemporary societies.
8. Acknowledgments
This research was supported by the Social Sciences and Humanities Research Council of Canada (SSHRC).
The literacy proficiency projection parameters were derived using confidential data at the Quebec Inter-University Center for Social Statistics (QICSS), a member of the Canadian Research Data Center Network.
The microsimulation models used in this research were created by theLaboratoire de simulations démographiques (LSD) located at the Institut national de recherche
scientifique (INRS) in Montreal, Canada. The authors would like to thank Dr. Patrick
Sabourin for his help and valuable contribution to the microsimulation models’
15 The Survey of Adult Skills (PIAAC) was conducted in over 40 countries and regions, including most
References
Adserà, A., Ferrer, A.M., Sigle-Rushton, W., and Wilson, B. (2012). Fertility patterns of child migrants: Age at migration and ancestry in comparative perspective.The Annals of the American Academy of Political and Social Science 643(1): 160– 189.doi:10.1177/0002716212444706.
Augustine, J.M. and Negraia, D.V. (2018). Can increased educational attainment among lower-educated mothers reduce inequalities in children’s skill development?Demography 55(1): 59–82.doi:10.1007/s13524-017-0637-4.
Aydemir, A. and Skuterud, M. (2005). Explaining the deteriorating entry earnings of Canada’s immigrant cohorts, 1966–2000. The Canadian Journal of Economics
38(2): 641–671.doi:10.1111/j.0008-4085.2005.00297.x.
Barakat, B. and Durham, R.E. (2014). Future education trends. In: Lutz, W., Butz, W.P., and KC, S. (eds.).World population and human capital in the twenty-first century. Oxford: Oxford University Press: 397–433. doi:10.1093/acprof:oso/ 9780198703167.003.0008.
Barone, C. and van de Werfhorst, H.G. (2011). Education, cognitive skills and earnings in comparative perspective. International Sociology 26(4): 483–502.
doi:10.1177/0268580910393045.
Beaujot, R. (2017). Canada: The case for stable population with moderately low fertility and modest immigration.Canadian Studies in Population 44(3–4): 185– 190.doi:10.25336/P6K90C.
Becker, G. (1964). Human capital: A theoretical and empirical analysis, with special
reference to education. New York: Columbia University Press.
Bélanger, A., Sabourin, P., Vézina, S., Marois, G., D’Ovidio, K., Pelletier, D., and Lafontaine, O. (2018). The Canadian microsimulation model (LSD–C): Content, modules, and some preliminary results. Montréal: Centre Urbanisation Culture Société, Institut National de la Recherche Scientifique (Working Paper 2018-01).http://espace.inrs.ca/6830/.
Bélanger, A., Sabourin, P., Marois, G., Van Hook, J., and Vézina, S. (2019). A framework for the prospective analysis of ethno-cultural super-diversity.
Demographic Research 41(11): 293‒330.doi:10.4054/DemRes.2019.41.11.
Bonikowska, A., Green, D.A., and Riddell, W.C. (2008). Literacy and the labour market: Cognitive skills and immigrant earnings. Ottawa: Statistics Canada (Catalogue 89-552-M No. 20).
Borjas, G.J. (1985). Assimilation, changes in cohort quality, and the earnings of immigrants.Journal of Labor Economics 3(4): 463–489.doi:10.1086/298065.
Borjas, G.J. and Friedberg, R.M. (2009). Recent trends in the earnings of new immigrants to the United States. Cambridge: National Bureau of Economic Research (NBER Working Paper 15406).doi:10.3386/w15406.
Bourdieu, P. (1979). Les trois états du capital culturel. Actes de la Recherche en Sciences Sociales 30: 3–6.doi:10.3406/arss.1979.2654.
Bynner, J. and Parsons, S. (2009). Insights into basic skills from a UK longitudinal study. In: Reder, S. and Bynner, J. (eds.).Tracking adult literacy and numeracy skills: Findings from longitudinal research. New York: Routledge: 27–58. Causa, O. and Jean, S. (2007). Integration of immigrants in OECD countries: Do
policies matter? Paris: OECD (OECD Economics Department Working Papers 564).
Chesters, J., Ryan, C., and Sinning, M. (2013). The returns to literacy skills in Australia. Adelaide: National Centre for Vocational Education Research. Chiswick, B.R. (1978). The effect of Americanization on the earnings of foreign-born
men.Journal of Political Economy 86(5): 897–921.doi:10.1086/260717.
Clark, K. and Drinkwater, S. (2008). The labour-market performance of recent migrants. Oxford Review of Economic Policy 24(3): 495–516. doi:10.1093/ oxrep/grn023.
Coleman, D. (2006). Immigration and ethnic change in low-fertility countries: A third demographic transition. Population and Development Review 32(3): 401–446.
doi:10.1111/j.1728-4457.2006.00131.x.
Coleman, D. (2009). The demographic effects of international migration in Europe.
Oxford Review of Economic Policy 24(3): 452–476.doi:10.1093/oxrep/grn027.
Collier, P. (2013). Exodus: How migration is changing our world. Oxford: Oxford University Press.
Desjardins, R. (2003a). Determinants of economic and social outcomes from a life-wide learning perspective in Canada. Education Economics 11(1): 11–38.
Desjardins, R. (2003b). Determinants of literacy proficiency: A lifelong-lifewide learning perspective.International Journal of Educational Research 39(3): 205– 245.doi:10.1016/j.ijer.2004.04.004.
Desjardins, R. and Warnke, A.J. (2012). Ageing and skills: A review and analysis of skill gain and skill loss over the lifespan and over time. Paris: OECD (OECD Education Working Papers 72).
Dickinson, D.K. and Neuman, S.B. (2006).Handbook of early literacy research. New York: Guilford Press.
Duleep, H.O. and Dowhan, D.J. (2002). Insights from longitudinal data on the earnings growth of US foreign-born men. Demography 39(3): 485–506. doi:10.1353/ dem.2002.0026.
Dustmann, C. and Fabbri, F. (2005). Immigrants in the British labour market. Fiscal
Studies 26(4): 423–470.doi:10.1111/j.1475-5890.2005.00019.x.
Ferrer, A., Green, D.A., and Riddell, W.C. (2006). The effect of literacy on immigrant earnings. The Journal of Human Resources 41(2): 380–410. doi:10.3368/jhr. XLI.2.380.
Ford, K. (1990). Duration of residence in the United States and the fertility of US immigrants. The International Migration Review 24(1): 34–68. doi:10.1177/ 019791839002400102.
Geddes, A. and Scholten, P. (2016). The politics of migration and immigration in
Europe. London: Sage.doi:10.4135/9781473982703.
Gimenez-Nadal, J.I. and Molina, J.A. (2012). Parents’ education as a determinant of educational childcare time. Journal of Population Economics 26(2): 719–749.
doi:10.1007/s00148-012-0443-7.
Green, A.G. and Green, D. (2004). The goals of Canada’s immigration policy: A historical perspective.Canadian Journal of Urban Research 13(1): 102–139. Green, D. and Riddell, W.C. (2003). Literacy and earnings: An investigation of the
interaction of cognitive and unobserved skills in earnings generation. Labour
Economics 10(2): 165–184.doi:10.1016/S0927-5371(03)00008-3.
Green, D. and Riddell, W.C. (2013). Ageing and literacy skills: Evidence from Canada, Norway and the United States. Labour Economics 22: 16–29. doi:10.1016/j. labeco.2012.08.011.
Green, D. and Worswick, C. (2017). Canadian economics research on immigration through the lens of theories of justice. Canadian Journal of Economics 50(5): 1262–1303.doi:10.1111/caje.12298.
Hall, M. and Farkas, G. (2008). Does human capital raise earnings for immigrants in the low-skill labor market? Demography 45(3): 619–639. doi:10.1353/dem. 0.0018.
Hanushek, E.A., Schwerdt, G., Wiederhold, S., and Wößmann, L. (2015). Returns to skills around the world: Evidence from PIAAC.European Economic Review 73: 103–130.doi:10.1016/j.euroecorev.2014.10.006.
Hart, B. and Risley, T.R. (1995).Meaningful differences in the everyday experience of
young American children. Baltimore: Brookes.
Hassrick, E.M., Raudenbush, S.W., and Rosen, L. (2017). The ambitious elementary school: Its conception, design, and implications for educational equality. Chicago: University of Chicago Press. doi:10.7208/chicago/9780226456799. 001.0001.
Hudson, K. (2007). The new labor market segmentation: Labor market dualism in the new economy. Social Science Research 36(1): 286–312. doi:10.1016/j.ss research.2005.11.005.
Kahn, J.R. (1988). Immigrant selectivity and fertility adaptation in the United States.
Social Forces 67(1): 108–128.doi:10.1093/sf/67.1.108.
KC, S., Barakat, B., Goujon, A., Skirbekk, V., Sanderson, W., and Lutz, W. (2010). Projection of populations by level of educational attainment, age, and sex for 120 countries for 2005–2050. Demographic Research 22(15): 383–472.
doi:10.4054/DemRes.2010.22.15.
Kerckhoff, A.C. (1986). Family position, peer influences, and schooling. In: Richardson, J.G. (ed.). Handbook of theory and research for the sociology of
education. Westport: Greenwood Press: 93–112.
le Grand, C. and Szulkin, R. (2002). Permanent disadvantage or gradual integration: explaining the immigrant–native earnings gap in Sweden.Labour 16(1): 37–64.
Lee, B., Martin, M., Matthews, S., and Farrell, C. (2017). A universal trend? State-level changes in US racial and ethnic diversity, 1980 to 2015.Demographic Research
37(33): 1031–1048.doi:10.4054/DemRes.2017.37.33.
Lemos, S. (2017). Mind the gap: A detailed picture of the immigrant-native earnings gap in the UK using longitudinal data between 1978 and 2006.Regional Science
and Urban Economics 63: 57–75.doi:10.1016/j.regsciurbeco.2016.11.001.
Levy, M. (2017). The effect of immigration from Mexico on social capital in the United States. International Migration Review 51(3): 757–788. doi:10.1111/imre. 12231.
Licht, G. and Steiner, V. (1994). Assimilation, labour market experience and earnings profiles of temporary and permanent immigrant workers in Germany.
International Review of Applied Economics 8(2): 130–156. doi:10.1080/
758539743.
Loichinger, E. (2015). Labor force projections up to 2053 for 26 EU countries, by age, sex, and highest level of educational attainment.Demographic Research 32(15): 443–486.doi:10.4054/DemRes.2015.32.15.
Lutz, W. (2013). Demographic metabolism: A predictive theory of socioeconomic change. Population and Development Review 38(S1): 283–301. doi:10.1111/j. 1728-4457.2013.00564.x.
Lutz, W., Butz, W.P., and KC, S. (2014). World population and human capital in the twenty-first century. Oxford: Oxford University Press. doi:10.1093/acprof:oso/ 9780198703167.001.0001.
Martel, L., Caron Malenfant, E., Morency, J.-D., Lebel, A., Bélanger, A., and Bastien, N. (2011). Projected trends to 2031 for the Canadian labour force. Canadian
Economic Observer 24(8).
Meyer, J.W., Ramirez, F.O., Rubinson, R., and Boli-Bennett, J. (1977). The world educational revolution, 1950–1970. Sociology of Education 50(4): 242–258.
doi:10.2307/2112498.
OECD (2012). Literacy, numeracy and problem solving in technology-rich environments: Framework for the OECD survey of adult skills. Paris: OECD.
doi:10.1787/9789264128859-en.
OECD (2013a). OECD skills outlook 2013: First results from the survey of adult skills. Paris: OECD.
OECD (2016). Skills matter: Further results from the survey of adult skills. Paris: OECD.doi:10.1787/9789264258051-en.
OECD (2017a). International migration outlook 2017. Paris: OECD.
OECD (2017b). Permanent immigrant inflows (indicator) [electronic resource]. Paris: OECD.https://data.oecd.org/migration/permanent-immigrant-inflows.htm. OECD and European Union (2014). Matching economic migration with labour market
needs. Paris: OECD.doi:10.1787/9789264216501-en.
Paccagnella, M. (2016). Age, ageing and skills: Results from the survey of adult skills. Paris: OECD (OECD Education Working Papers 132).
Papademetriou, D.G. and Sumption, M. (2011). Rethinking points systems and employer-selected immigration. Washington, D.C.: Migration Policy Institute. Patsiurko, N., Campbell, J.L., and Hall, J.A. (2012). Measuring cultural diversity:
Ethnic, linguistic and religious fractionalization in the OECD.Ethnic and Racial
Studies 35(2): 195–217.doi:10.1080/01419870.2011.579136.
Picot, G. (2013). Economic and social objectives of immigration: The evidence that informs immigration levels and education mix. Ottawa: Citizenship and Immigration Canada.
Poot, J. and Stillman, S. (2016). Skill composition of immigration flows and the measurement of education-occupation mismatch. IZA Journal of Migration
5(18): 1–28.doi:10.1186/s40176-016-0066-y.
Portes, A. and Vickstrom, E. (2011). Diversity, social capital, and cohesion. Annual
Review of Sociology 37: 461–479.doi:10.1146/annurev-soc-081309-150022.
Portes, A. and Zhou, M. (1993). The new second generation: Segmented assimilation and its variants. The Annals of the American Academy of Political and Social
Science 530(1): 74–96.doi:10.1177/0002716293530001006.
Powers, M.G. and Seltzer, W. (1998). Occupational status and mobility among undocumented immigrants by gender. The International Migration Review
32(1): 21–55.doi:10.1177/019791839803200102.
Rammstedt, B., Martin, S., Zabal, A., Carstensen, C., and Schupp, J. (2017). The PIAAC longitudinal study in Germany: Rationale and design. Large-scale
Reder, S. (1994). Practice engagement theory: A sociocultural approach to literacy across languages and cultures. In: Ferdman, B.M., Weber, R.-M., and Ramirez, A.G. (eds.).Literacy across languages and cultures. Albany: State University of New York Press: 33–74.
Romaniuk, A. (2017). Stationary population, immigration, social cohesion, and national identity: What are the links and the policy implications? With special attention to Canada, a demographer’s point of view. Canadian Studies in Population
44(3–4): 165–178.doi:10.25336/P6391D.
Rosholm, M., Scott, K., and Husted, L. (2006). The times they are a-changin’: Declining immigrant employment opportunities in Scandinavia. International
Migration Review 40(2): 318–347.doi:10.1111/j.1747-7379.2006.00019.x.
St. Clair, R. (2012). The limits of levels: Understanding the International Adult Literacy Surveys (IALS). International Review of Education 58(6): 759–776.
doi:10.1007/s11159-013-9330-z.
Statistics Canada (2015). Population Projections for Canada (2013 to 2063), provinces and territories (2013 to 2038). Ottawa: Statistics Canada (Catalogue 91-520-X). Statistics Canada (2017). Modgen (model generator) [electronic resource]. Ottawa:
Statistics Canada. http://www.statcan.gc.ca/eng/microsimulation/modgen/mod gen.
Statistik Austria (2016).Demographisches Jahrbuch 2015. Vienna: Statistik Austria. Statistik Austria (2017). Wanderungen mit dem Ausland (Außenwanderungen) 2007–
2016 nach Staatsangehörigkeit. Vienna: Statistik Austria.
van Imhoff, E. and Post, W. (1998). Microsimulation methods for population projection.Population: An English Selection 10(1): 97–138.
Vertovec, S. (2007). Super-diversity and its implications. Ethnic and Racial Studies
30(6): 1024–1054.doi:10.1080/01419870701599465.
Wils, A. and Goujon, A. (1998). Diffusion of education in six world regions, 1960–90.
Population and Development Review 24(2): 357–368.doi:10.2307/2807979.
Wilson, C., Sobotka, T., Williamson, L., and Boyle, P. (2013). Migration and intergenerational replacement in Europe. Population and Development Review
Wittgenstein Centre for Demography and Global Human Capital (2015). Wittgenstein Centre data explorer [electronic resource]. Vienna: Wittgenstein Centre for Demography and Global Human Capital. www.wittgensteincentre.org/data explorer.
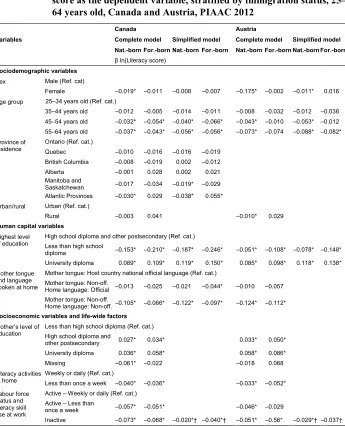
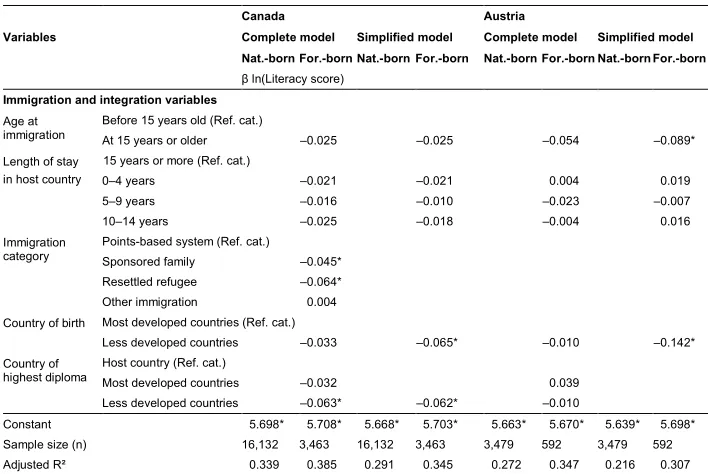
Appendix: The calculation of literacy skill module parameters
This section presents the regression analyses conducted to identify the determinants of literacy proficiency. The analyses are stratified by immigration status in order to consider variables specific to the foreign-born population, such as age at immigration, country of birth, etc. Based on both economic and sociodemographic literature and on our theoretical framework, the most pertinent independent variables fall into four categories:
1. Sociodemographic variables (age, sex, province, area of residence)
2. Human capital variables (education level, mother tongue, language spoken at home)
3. Socioeconomic variables and life-wide factors (mother’s education level,16
literacy skills used at home, at work (labour force status), and in everyday life17)
4. Variables linked with characteristics that are specific to immigrants, such as age at immigration, years in host country since migration, immigration category, country of birth, and country of highest diploma.18
Table A-1 presents the regression coefficients for both Austria and Canada. The complete model contains all pertinent independent variables, while the simplified model coefficients constitute the parameters used in the microsimulation models to derive literacy skills proficiency. Even though this simplified model does not include all significant variables from the complete model, notably mother’s education level and life-wide factors, the predictive power of the model is not substantially affected. More precisely, compared to the complete model the adjusted R² of the simplified models is reduced by four to five points.
16 Mother’s education level is also a measure of social and cultural capital, which directly and indirectly
impacts on children’s skill development and socioeconomic status. See Augustine and Negraia (2018).
17 Reading books at home; writing letters, memos, or emails at work.
18 The categories of both country of birth and country of highest diploma variables are defined in the same