ISSN: 2334-2986 (Print), 2334-2994 (Online) Copyright © The Author(s). All Rights Reserved. Published by American Research Institute for Policy Development DOI: 10.15640/jea.v3n1a10 URL: http://dx.doi.org/10.15640/jea.v3n1a10
Effectof Pit Sandon Compressive Strength of Coconut Shell Concrete
Lekan Makanju Olanitori
1& Olugbenga Joseph Oyedepo
2Abstract
The high and rising cost of building materials is one of the major factors affecting housing delivery in Nigeria. Therefore, there is the need to reduce the cost of building construction either through effective construction management or usage of alternative available local materials. Concrete is one of the most important building materials in Nigeria presently, however, one of its major disadvantage, is its high self-weight compared to other construction materials. Hence research focused towards producing a light-weight concrete from locally available material, which will reduce the total self-light-weight of the structure, with corresponding reduction in cost is of national interest. This work investigated the effect of pit sand on the mechanical properties of concrete produced using coconuts hells as a replacement for coarse aggregate. Two batches of concrete mix were produced using coconuts hells as aggregate, with mix ratios 1:2:4. One of the batches was produced using unwashed sand from borrowed pit, while the second batch was produced using washed sand respectively. From each batch of concrete mix, 20 concrete cubes of size 150 mm x 150 mm x 150mm were produced and cured by immersion in water in curing tanks. Cubes produced using unwashed sand were named specimen A, while that produced from washed sand were named specimen B. The research shows that there is increase in the compressive strength of concrete produced from washed sand over that produced using unwashed sand. Also, concrete produced by 25% partial replacement of crushed granite by coconut shell using unwashed sand and 25% to 75% partial replacement for washed sand, can be used for structural purposes.
Keywords: Concrete, Sand, Coconut shell, Compressive strength, Light weight concrete
Introduction
Concrete is the world’s most widely used construction material owing to its excellent versatility, availability and economy. Despite all advantages associated with the use of concrete in civil engineering infrastructures, its use is sometimes limited in some structures because of its high self-weight compared to other construction materials. Hence, the development of lightweight concrete (LWC) responds to some of the urgent needs of the construction industry (Kim; Choi and Lachemi 2009). One of the advantages of lightweight concrete is that, it can reduce the self-weight of structural members which can result in reduced member’s sections. Hence, lightweight concrete can save overall construction costs. The high demand for concrete in construction, using normal weight aggregate such as gravel and crushed granite drastically reduces the natural stone deposits and this has damaged the environment thereby causing ecological imbalance (Alengeram, Jumat and Mahmd, 2008), therefore, there is the need to explore other suitable materials that can replace natural stone as coarse aggregate either partially or wholly. Also, the need to reduce dead load, improved strength and reduce cost of production of concrete, necessitated research into the use of coconut shell as coarse aggregate for our conventional light weight concrete.
1
PhD, Department of Civil and Environmental Engineering, Federal University of Technology, Akure, Ondo State, Nigeria. Phone: +2348037145525. E-mail: [email protected]
2
With the aim of producing low cost construction materials, there has been growing interest in utilizing natural fibers. Various research papers indicated various advantages in the use of natural fibers in cement composites, among them are: increased density, flexural strength and compressive strength (Toledo et al., 2003; Asasutjaritet al., 2007). Studying the ‘effects of palm fiber on the mechanical properties of lightweight concrete crushed brick’, Ramli and Dawood (2010) also noted that the use of palm fiber with lightweight crushed brick concrete enhances the mechanical properties of the concrete and the optimization of the palm fiber fractions is required to get the best performance. Olanipekun (2006) investigated the properties of coconut shells (CCS) and palm kernel shells (PKS) as coarse aggregates in concrete. The CCS were crushed and substituted for conventional coarse aggregates in gradations of 0%, 25%, 50%, 75% and 100%. Two mix ratios (1:1:2) and (1:2:4) were used respectively. He noted that the compressive strength of the concrete decreased as the percentage of the shells increased in the two mix ratios. However, concrete obtained from CCS exhibited a higher compressive strength than PKS concrete in the two proportions. His results also indicated a 30% and 42% cost reduction for concrete produced from coconut shells and palm kernel shells respectively. He concluded that coconut shells were more suitable than palm kernel shells when used as substitute for conventional aggregates in concrete production. In his study, Olutoge (2010) noted that increase in percentage of sawdust or palm kernel shells in concrete led to a corresponding reduction in both flexural and compressive strength values. At a low replacement value of 25%, sawdust and PKS can produce lightweight reinforced concrete slabs which could be used where low stress is required at reduced cost. A weight reduction of 14.5% and 17.9% was achieved for sawdust and PKS replacement slabs respectively. It is also seen that the reduction in cost up to 7.43% can be achieved for every cubic meter of slab production with use of sawdust or palm kernel shell.
The use of LWAC instead of normal weight concrete (NWC), as a floor slab in a multi-story building, depends on the relative costs and the potential savings that can occur by the use of a lighter material. LWAC is about 25% lighter than normal concrete and, in a design where the dead load is equal to the live load, a saving of 15% in steel reinforcement can be achieved. Equal or greater savings are achieved in columns and footings. For long-span bridges, the live load is a minor part of the total load and a reduction in density is translated into reductions in not only mass, but also in section size [Min and Gjorv., 1990; Waldron, 2005 and Meyer, and Khan, 2002]. Carrying out research on the properties of LWC using locally available Scoria lightweight aggregates and specific blends of silica fume and fly ash, Shannag et al(2014), the test results indicated that developing structural lightweight concretes (SLWC) using the locally available aggregates is feasible. The stress-strain diagrams plotted for the structural LWC mixes developed in their investigation were comparable to a typical stress-strain diagram for normal weight concrete with relatively larger strain capacity at failure in case of LWC. Despite the high interest in the production of lightweight concrete from coconut shells, no work in literature has been done to investigate the effect our locally available fine aggregate has on the strength of coconut shell lightweight concrete. For concrete produced using 1:2:4 mix ratio, the maximum percentage clay/silt of content of sand for which the compressive concrete strength will not be less than 21N/mm2 is 3.4% (Olanitori and Olotuah, 2005). For sand with percentage clay/silt
contents of 5% and 6% will produce concrete with compressive strengths of 17.7N/mm2 and 16.3 N/mm2
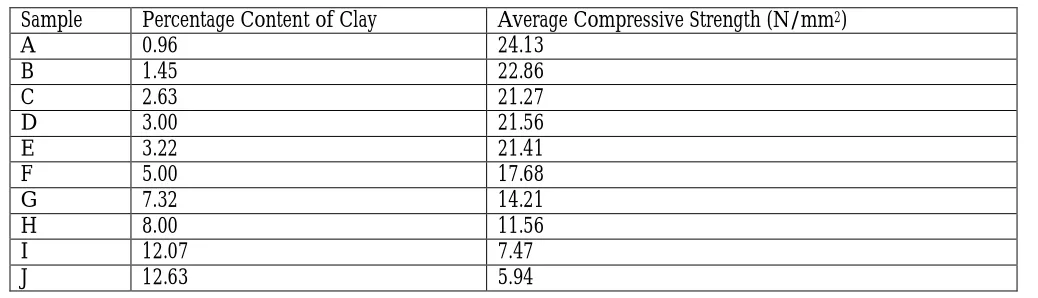
respectively, and the higher the percentage of clay/silt in sand the lower the concrete strength (Olanitori and Olotuah, 2005). It is very important to control the quality of the aggregate to be used in concrete making. Most importantly, the effect of the clay/silt content of sand on the compressive strength of concrete must be controlled. Table 1(Olanitori and Olotuah, 2005), shows the variation of strength against the percentage content of clay/silt in the sand.
In terms of particle size as used by geologists, sand particles range in diameter from 0.0625 mm (or 1⁄ 16 mm)
to 2 mm. An individual particle in this range size is termed a sand grain. Sand grains are between gravel (with particles ranging from 2 mm up to 64 mm) and silt (particles smaller than 0.0625 mm down to 0.004 mm), while sand grain less than 0.004mm is termed clay. International standard organisation (ISO) 14688 (2002 and 2004) grades sands as fine, medium and coarse with ranges 0.063 mm to 0.2 mm to 0.63 mm to 2.0 mm. In the United States, sand is commonly divided into five sub-categories based on size: very fine sand (1⁄16 – 1⁄8 mm diameter), fine sand (1⁄8 mm – 1⁄4 mm),
medium sand (1⁄4 mm – 1⁄2 mm), coarse sand (1⁄2 mm – 1 mm), and very coarse sand (1 mm – 2 mm). These sizes are
Moderate fines contents are useful for cohesion and finishability of concrete. Excessive fines contents increase water demand and may interfere with the aggregate–cement paste bond (Lay, J., 2003), hence in Table 6 of BS 882 (1992) limits are put unto the percentage of fines that can pass through 0.075mm sieve, and this ranges from 2% to 16% depending on aggregate type. However, it is noted in the code (BS 882, 1992), that the nature of the fines can vary between different aggregates. The limits given in Table 6 of BS 882 (1992) are appropriate for most aggregates found in the UK. Evidence of performance in use or the result of trial mixes may be used to justify the adoption of higher or lower limits. Hence, this work investigated the effect of locally available pit sand on the mechanical properties of concrete produced using coconut shells as a replacement for coarse aggregate.
Table 1: The Variation of Strength against Percentage Content of Clay
Sample Percentage Content of Clay Average Compressive Strength (N/mm2)
A 0.96 24.13
B 1.45 22.86
C 2.63 21.27
D 3.00 21.56
E 3.22 21.41
F 5.00 17.68
G 7.32 14.21
H 8.00 11.56
I 12.07 7.47
J 12.63 5.94
Source: Olanitori and Olotuah, 2005.
To mitigate the effect of clay/silt content of sand on the strength of concrete produced from it, there is need to increase the cement content of the concrete, depending on the clay/silt percentage or by washing the sand to reduce its percentage content of clay/silt. (Olanitori, 2006). Olanitori (2012) determines the cost implication of mitigating the effect of clay/silt content of sand using mathematical models.
Materials and Methods
Results and Discussion
The results of the sieve analysis of both the unwashed sand and coconut shell are shown in Tables 2 and 4. Taking sand with diameter lesser than 0.15mm to be silt, then from Table 2, the percentage content of silt in the unwashed sand is 8.08%, which is greater than 3.4%, in order to achieve concrete with compressive strength not less than 21N/mm2 (Olanitori and Olotuah, 2005).In Table 3, the results of the sieve analysis of the washed sand were
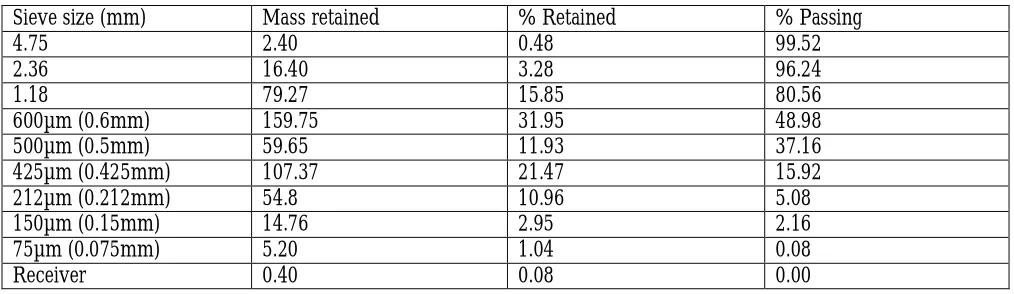
presented. From Table 3, the percentage silt content of washed sand is 2.16%, which is less than 3.4% recommended by Olanitori and Olotuah (2005). This shows a 73% reduction in the silt content in the unwashed sand due to washing.
Table 2: Sieve Analysis of Unwashed Sand
Sieve size (mm) Mass retained % Retained % Passing
4.75 2.25 0.45 99.55
2.36 15.41 3.08 96.47
1.18 73.66 14.73 81.74
600µm (0.6mm) 148.45 29.69 52.05
500µm (0.5mm) 55.43 11.09 40.96
425µm (0.425mm) 99.78 19.96 21.00
212µm (0.212mm) 50.92 10.18 10.82
150µm (0.15mm) 13.72 2.74 8.08
75µm (0.075mm) 9.77 1.95 6.13
Receiver 30.61 6.12 00
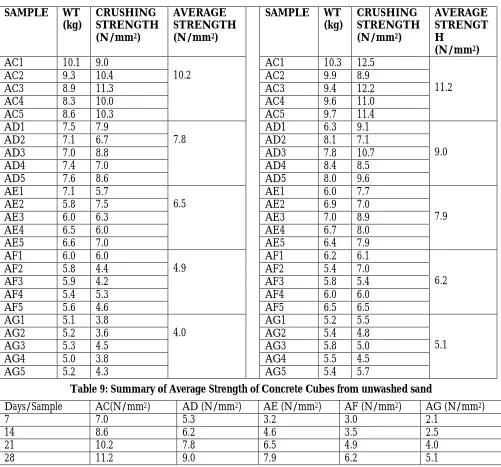
Tables 5 to 8 presented the results of the compressive strength tests for the concrete produced from unwashed sand sample A, for 7, 14, 21 and 28 days age respectively. From Table 5 the average compressive strengths of concrete at the age of 7 days are 7.0N/mm2, 5.2N/mm2, 3.2N/mm2, 3.0N/mm2 and 2.1N/mm2 respectively for
samples AC, AD, AE, AF and AG. Also, from Table 6 the average compressive strength of concrete at the age of 14 days are 8.6N/mm2, 6.2N/mm2, 4.6N/mm2, 3.5N/mm2 and 2.5N/mm2 respectively for samples AC, AD, AE, AF
and AG. From Table 7 the average compressive strength of concrete at the age of 21 days are 10.2N/mm2,
7.8N/mm2, 6.5N/mm2, 4.9N/mm2 and 4.0N/mm2 respectively for samples AC, AD, AE, AF and AG. Also from
Table 8 the average compressive strength of concrete at the age of 28 days are 11.2N/mm2, 9.0N/mm2, 7.9N/mm2,
6.2N/mm2 and 5.1N/mm2 respectively for samples AC, AD, AE, AF and AG. Table 9 shows the summary of the
average compressive strength of concrete cubes produced from unwashed sand for samples AC, AD, AE, AF and AG at the ages of 7, 14, 21 and 28 days respectively. Tables 5 to 8 show that as the percentage content of coconut shell increases, the compressive strength of the concrete reduces.
Table 3: Sieve Analysis of Washed sand
Sieve size (mm) Mass retained % Retained % Passing
4.75 2.40 0.48 99.52
2.36 16.40 3.28 96.24
1.18 79.27 15.85 80.56
600µm (0.6mm) 159.75 31.95 48.98
500µm (0.5mm) 59.65 11.93 37.16
425µm (0.425mm) 107.37 21.47 15.92
212µm (0.212mm) 54.8 10.96 5.08
150µm (0.15mm) 14.76 2.95 2.16
75µm (0.075mm) 5.20 1.04 0.08
Table 4: Sieve Analysis of Coconut Shells
Sieve size (mm) Mass retained % Retained % Passing
28 0 0 100
20 6850 29.46 70.54
14 4450 19.14 57.54
10 4800 20.65 30.75
6.3 5050 21.72 9.03
2.86 1800 7.74 1.29
Receiver 300 1.29 0
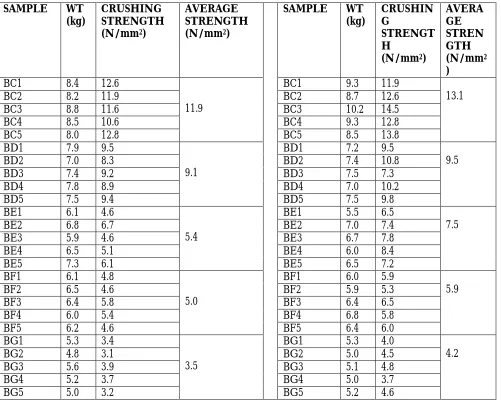
Tables 10 to 13 presented the results of the compressive strength tests for the concrete produced from washed sand sample B for 7, 14, 21 and 28 days age respectively. From Table 10, the average compressive strength of concrete at the age of 7 days are11.9N/mm2, 9.1N/mm2, 5.4N/mm2, 5.0N/mm2 and 3.5N/mm2 respectively for
samples BC, BD, BE, BF and BG. Also, from Table 11 the average compressive strength of concrete at the age of 14 days are 13.1N/mm2, 9.5N/mm2, 7.5N/mm2, 5.9N/mm2 and 4.2N/mm2 respectively for samples BC, BD, BE, BF
and BG. From Table 12 the average compressive strength of concrete at the age of 21 days are 13.6N/mm2,
11.9N/mm2, 9.9N/mm2, 7.5N/mm2 and 6.3N/mm2 respectively for samples BC, BD, BE, BF and BG. Also from
Table 13 the average compressive strength of concrete at the age of 28 days are 17.1N/mm2, 14.0N/mm2,
11.9N/mm2, 9.6N/mm2 and 7.9N/mm2 respectively for samples BC, BD, BE, BF and BG. Table 14 shows the
summary of the average compressive strength of concrete cubes produced from washed sand for samples BC, BD, BE, BF and BG at the ages of 7, 14, 21 and 28 days respectively.
Tables 10 to 13 show that as the percentage content of coconut shell increases, the compressive strength of the concrete reduces; while Table 15 shows the increase in cube strength of concrete produced from washed sand over that of unwashed sand. For concrete sample C, there is an increment by 70%, 52.3%, 33.3% and 52.7% for ages 7, 14, 21 and 28 days respectively. For concrete sample D, there is an increment in strength by 71.7%, 553.2%, 52.6% and 55.6% respectively for ages 7, 14, 21 and 28 days. Also, for concrete sample E, we have increment of 68.8%, 63.4%, 52.3% and 50.6% for ages 7, 14, 21 and 28 days respectively. For concrete sample F, there is an increment of 66.7%, 68.6%, 53.1% and 54.8% respectively for ages 7, 14, 21 and 28 days. Finally, for concrete sample G, there is an increment of 66.7%, 68.0%, 57.5% and 54.9% for ages 7, 14, 21 and 28 days respectively. Also from Table 15, the compressive strength of concrete sample AD is 9.0N/mm2. This value compares favourably with that of sample AC
which is 11.2N/mm2, which is about 20% higher. The compressive strength of sample BD is 14.0N/mm2, which is
20% greater than that of AC. Also, compressive strength of concrete samples BE and BF compare favourably with that of sample AC. Compressive strength of sample BE which is 11.9N/mm2 is about 6.0% greater than that of AC,
while compressive strength of BF which is 9.6N/mm2 is about 17% lesser than that of AC. Compressive strength of
Table 5: 7th Day crushing test result for Table 6: 14th Day crushing test result for
Concrete with unwasheds and Concrete with unwashed sand
concrete withunwashed
sandSAMPLE
WT (kg)
CRUSHING STRENGTH (N/mm2)
AVERAGE STRENGTH (N/mm2)
SAMPLE WT
(kg)
CRUSHING STRENGTH (N/mm2)
AVERAGE STRENG TH (N/mm2)
AC1 8.4 7.5
7.0
AC1 9.3 7.2
8.6
AC2 8.2 6.8 AC2 8.7 7.9
AC3 8.8 6.8 AC3 10.2 10.6
AC4 8.5 6.4 AC4 8.5 7.5
AC5 8.0 7.6 AC5 8.8 9.7
AD1 7.9 5.6
5.3
AD1 7.2 5.6
6.2
AD2 7.0 5.0 AD2 7.4 8.6
AD3 7.4 5.5 AD3 7.5 4.4
AD4 7.6 5.2 AD4 7.4 6.0
AD5 7.0 5.5 AD5 7.5 6.4
AE1 6.1 2.8
3.2
AE1 5.5 3.7
4.6
AE2 6.8 4.2 AE2 7.0 4.5
AE3 5.9 2.7 AE3 6.7 5.5
AE4 6.4 3.0 AE4 6.0 4.8
AE5 6.6 3.5 AE5 6.5 4.5
AF1 6.1 3.0
3.0
AF1 6.0 3.6
3.5
AF2 6.5 2.6 AF2 5.9 3.3
AF3 6.4 3.4 AF3 6.4 3.7
AF4 6.1 3.2 AF4 5.5 3.3
AF5 6.3 2.8 AF5 6.5 3.6
AG1 5.3 2.0
2.1
AG1 5.3 2.4
2.5
AG2 4.8 1.8 AG2 5.0 2.6
AG3 5.6 2.3 AG3 5.1 2.6
AG4 5.0 2.2 AG4 5.0 2.2
Table 7: 21stDay Crushing Test Result for Table 8: 28th Day Crushing test Result for. Concrete with
Unwashed sand Concrete with Unwashed sand
SAMPLE WT
(kg)
CRUSHING STRENGTH (N/mm2)
AVERAGE STRENGTH (N/mm2)
SAMPLE WT
(kg)
CRUSHING STRENGTH (N/mm2)
AVERAGE STRENGT H
(N/mm2)
AC1 10.1 9.0
10.2
AC1 10.3 12.5
11.2
AC2 9.3 10.4 AC2 9.9 8.9
AC3 8.9 11.3 AC3 9.4 12.2
AC4 8.3 10.0 AC4 9.6 11.0
AC5 8.6 10.3 AC5 9.7 11.4
AD1 7.5 7.9
7.8
AD1 6.3 9.1
9.0
AD2 7.1 6.7 AD2 8.1 7.1
AD3 7.0 8.8 AD3 7.8 10.7
AD4 7.4 7.0 AD4 8.4 8.5
AD5 7.6 8.6 AD5 8.0 9.6
AE1 7.1 5.7
6.5
AE1 6.0 7.7
7.9
AE2 5.8 7.5 AE2 6.9 7.0
AE3 6.0 6.3 AE3 7.0 8.9
AE4 6.5 6.0 AE4 6.7 8.0
AE5 6.6 7.0 AE5 6.4 7.9
AF1 6.0 6.0
4.9
AF1 6.2 6.1
6.2
AF2 5.8 4.4 AF2 5.4 7.0
AF3 5.9 4.2 AF3 5.8 5.4
AF4 5.4 5.3 AF4 6.0 6.0
AF5 5.6 4.6 AF5 6.5 6.5
AG1 5.1 3.8
4.0
AG1 5.2 5.5
5.1
AG2 5.2 3.6 AG2 5.4 4.8
AG3 5.3 4.5 AG3 5.8 5.0
AG4 5.0 3.8 AG4 5.5 4.5
AG5 5.2 4.3 AG5 5.4 5.7
Table 9: Summary of Average Strength of Concrete Cubes from unwashed sand
Days/Sample AC(N/mm2) AD (N/mm2) AE (N/mm2) AF (N/mm2) AG (N/mm2)
7 7.0 5.3 3.2 3.0 2.1
14 8.6 6.2 4.6 3.5 2.5
21 10.2 7.8 6.5 4.9 4.0
Table 10: 7thDay Crushing Test Result for Table 11: 14th Day crushing test Result for. Concrete with Washed
sand Concrete with washed sand
SAMPLE WT
(kg)
CRUSHING STRENGTH (N/mm2)
AVERAGE STRENGTH (N/mm2)
SAMPLE WT
(kg)
CRUSHIN G
STRENGT H
(N/mm2)
AVERA GE STREN GTH
(N/mm2
)
BC1 8.4 12.6
11.9
BC1 9.3 11.9
13.1
BC2 8.2 11.9 BC2 8.7 12.6
BC3 8.8 11.6 BC3 10.2 14.5
BC4 8.5 10.6 BC4 9.3 12.8
BC5 8.0 12.8 BC5 8.5 13.8
BD1 7.9 9.5
9.1
BD1 7.2 9.5
9.5
BD2 7.0 8.3 BD2 7.4 10.8
BD3 7.4 9.2 BD3 7.5 7.3
BD4 7.8 8.9 BD4 7.0 10.2
BD5 7.5 9.4 BD5 7.5 9.8
BE1 6.1 4.6
5.4
BE1 5.5 6.5
7.5
BE2 6.8 6.7 BE2 7.0 7.4
BE3 5.9 4.6 BE3 6.7 7.8
BE4 6.5 5.1 BE4 6.0 8.4
BE5 7.3 6.1 BE5 6.5 7.2
BF1 6.1 4.8
5.0
BF1 6.0 5.9
5.9
BF2 6.5 4.6 BF2 5.9 5.3
BF3 6.4 5.8 BF3 6.4 6.5
BF4 6.0 5.4 BF4 6.8 5.8
BF5 6.2 4.6 BF5 6.4 6.0
BG1 5.3 3.4
3.5
BG1 5.3 4.0
4.2
BG2 4.8 3.1 BG2 5.0 4.5
BG3 5.6 3.9 BG3 5.1 4.8
BG4 5.2 3.7 BG4 5.0 3.7
Table 12: 21stDay Crushing test Result for Table 13: 28th Day crushing test Result for Concrete with Washed
sand Concrete with Washed sand
SAMPLE WT
(kg)
CRUSHING STRENGTH (N/mm2)
AVERAGE STRENGTH (N/mm2)
SAMPLE WT
(kg)
CRUSHING STRENGTH (N/mm2)
AVERAGE STRENGT H
(N/mm2)
BC1 10.1 14.0
13.6
BC1 10.3 18.8
17.1
BC2 9.3 15.6 BC2 9.9 13.8
BC3 8.9 17.0 BC3 9.4 18.3
BC4 8.5 16.0 BC4 9.4 17.6
BC5 9.0 15.5 BC5 9.0 17.1
BD1 7.5 11.9
11.9
BD1 6.3 14.6
14.0
BD2 7.1 10.8 BD2 8.1 11.4
BD3 7.0 13.2 BD3 7.8 16.1
BD4 7.8 10.5 BD4 8.4 12.8
BD5 7.4 13.3 BD5 7.6 15.2
BE1 7.1 8.8
9.9
BE1 6.0 11.6
11.9
BE2 5.8 11.3 BE2 6.9 10.5
BE3 6.0 9.8 BE3 7.0 13.4
BE4 6.8 9.3 BE4 6.8 12.0
BE5 6.5 10.5 BE5 6.8 12.0
BF1 6.0 9.0
7.5
BF1 6.2 9.8
9.6
BF2 5.8 7.0 BF2 5.4 10.5
BF3 5.9 6.5 BF3 5.8 8.4
BF4 5.2 8.2 BF4 5.5 9.0
BF5 5.6 6.9 BF5 5.7 10.1
BG1 5.1 6.1
6.3
BG1 5.2 8.5
7.9
BG2 5.2 5.8 BG2 5.4 7.2
BG3 5.3 6.8 BG3 5.8 8.0
BG4 5.0 6.1 BG4 5.0 7.2
BG5 5.3 6.7 BG5 5.2 8.6
Table 14: Summary of Average Strength of Concrete Cubes from washed sand
Days/Sample BC (N/mm2) BD (N/mm2) BE (N/mm2) BF (N/mm2) BG (N/mm2)
7 11.9 9.1 5.4 5.0 3.5
14 13.1 9.5 7.5 5.9 4.2
21 13.6 11.9 9.9 7.5 6.3
28 17.1 14.0 11.9 9.6 7.9
Table 15: Increase in cube Strength of Concrete Produced from Washed sand over that of unwashed sand
D/S C D E F G
(N/mm2) %IN (N/mm2) %IN (N/mm2) %IN (N/mm2) %IN (N/mm2) %IN
AC BC AD BD AE BE AF BF AG BG
7 7.0 11.9 70 5.3 9.1 71.7 3.2 5.4 68.8 3.0 5.0 66.7 2.1 3.5 66.7 14 8.6 13.1 52.3 6.2 9.5 53.2 4.6 7.5 63.0 3.5 5.9 68.6 2.5 4.2 68 21 10.2 13.6 33.3 7.8 11.9 52.6 6.5 9.9 52.3 4.9 7.5 53.1 4.0 6.3 57.5 28 11.2 17.1 52.7 9.0 14.0 55.6 7.9 11.9 50.6 6.2 9.6 54.8 5.1 7.9 54.9
Conclusion
This research shows that there is increase in the compressive strength of concrete if the sand used for the concrete production is washed compared with that produced from unwashed sand. The result show that, for concrete produced from unwashed sand, there could be 25% partial replacement of crushed granite by coconut shells, while for washed sand, crushed granite could be partially replaced by coconut shells from 25% to 75%.
Recommendation
Research should be conducted on the effect of partial and total replacement of crushed granite by coconut shells on the strength characteristics such as bending strength and shear capacity of structural elements such as beam and slab.
References
Kim, Y.J., Choi, Y.W. and Lachemi, M. (2010): Characteristics of self-consolidating concrete using two types of lightweight coarse aggregares. Construction and Building Materials.Vol. 24. Issue 1,Pp 11-16.
Alengaram, U.J., Jumaat, M.Z. and Mahmud, H. (2008): Ductility behavior of reinforced palm kernel shell concrete beams. European Journal of Scientific Research. Vol. 23, No. 3, Pp 406-420.
Olanipekun E.A. (2006): A Comparative study of concrete properties using coconut shell and palm kernel shell as coarse aggregates. Journal of Building and Environment. 41(3): 297-301.
Toledo, R.F., Ghavami, K., England, G.L. and Scrivener, K. (2003): Development of vegetable fiber-mortar composite of fiber-mortar composites of improved durability. Cement and Concrete Composite.Vol. 25, Issue 2, 185-196.
Asasutjarit, C., Hirunlabh, J. Khedari, J. Charoenvai, S. Zeghmati, B. and Shin, U.S. (2007): Development of coconut coir-based lightweight cement board. Construction and Building Materials.Vol. 21, Issue 2, 277-288.
Ramli, M. and Dawood, E.T. (2010): Effects of Palm Fiber on the Mechanical Properties of
Lightweight Concrete Crushed Brick. American Journal of Engineering and Applied Sciences 3 (2): 489-493.
Olutoge, F.A. (2010): Investigations on Sawdust and Palm Kernel Shells as Aggregate Replacement. ARPN Journal of Engineering and Applied Sciences 5(4): 7-13.
H.Z.Min, and E. Gjorv, (1990): Characteristics of lightweight aggregate for high strength concrete. ACI Materials Journal, Vol.88, No.2,. Pp150-158.
C.J. Waldron, (2005): Demonstration of Use of High-Performance Lightweight Concrete in Bridge Superstructure in Virginia” Journal of performance of Constructed Facilities, Vol. 19, No. 2, pp. 146-154.
K.F. Meyer, and L.F. Khan, (2002): Lightweight Concrete Reduces Weight and Increases Span Length of Pretensioned Bridge Girders. Precast/Prestressed Concrete Institute Journal. Vol. 47, Issue 1, Pp 68 – 75. M. Shannag, A. Charif, S. Naser, F. Faisal, and A. Karim (2014): Structural Behavior of Lightweight Concrete Made
With Scoria Aggregates and Mineral Admixtures. International Journal of Civil, Architectural Science and Engineering. Vol. 8 No.1.Pp 105 –109.
Olanitori L.M. and Olotuah A.O. (2005). The effect of Clayey impurities in sand on the crushing strength of concrete (a case study of sand in Akure metropolis, Ondo State, Nigeria). Proceedings of 30th Conference on ‘Our
World in Concrete and Structures’. Singapore, 23-24 August. Pp 373-376.
International Organisation for Standardization ISO 14688 (2002): Geotechnical Investigation and Testing – Identification and Classification of Soil – Part 1 - 2002: Identification and Description. Geneva, Switzerland. International Organisation for Standardization ISO 14688 (2004): Geotechnical investigation and testing --
Identification and classification of soil -- Part 2 - 2004: Principles for a classification. Geneva, Switzerland. Krumbein WC. 1938. Size frequency distribution of sediments and the normal phi curve. Journal of Sedimentary
Petrology. Vol. 8, Issue 1, Pp 84–90.
BS 882 (1992): Specification for aggregates from natural sources for concrete.British Standards Institution, London. BS 812 (1985): Testing aggregates - Part 103: Methods for determination of particle size distribution - Section 103.1-
Sieve tests.British Standards Institution, London.
BS 410 (2000): Test sieves - Technical requirements and testing.British Standards Institution, London.