Effects of feeding levels on growth performance, feed
utilization, body composition, energy and protein
maintenance requirement of fingerling, rainbow trout,
Oncorhynchus mykiss (Walbaum, 1792)
Imtiaz A.1*
Received: August 2016 Accepted: October 2016
Abstract
A 10-week feeding experiment was conducted to evaluate the effects of feeding level,
energy and protein maintenance requirement of rainbow trout, Oncorhynchus mykiss,
fingerling (5.650.45cm; 1.420.25g) by feeding casein-gelatin based purified diet
(45% CP; 3.67 kcal g-1 GE) at six feeding levels from 2 to 7% of BW/day in two equal
meals, at 0800 and 1700 h, in triplicate, with 20 fish per trough equipped with continuous water flow-through system water (60L volume). Maximum live weight gain, best feed conversion ratio (FCR), best specific growth rate (SGR) and highest
protein efficiency ratio (PER) were reported in fish fed 4-5% BW day-1. However,
quadratic regression analysis for weight gain, FCR, PER, protein retention efficiency and energy retention efficiency data indicated the break-points occurred at 5.33, 4.50,
4.48, 4.63 and 4.74% BW day-1, respectively. Body composition also produced
significant (p<0.05) differences with respect to each feeding level, maximum protein,
lowest moisture and intermediate fat contents were reported at 4-5% feeding levels.
Protein and energy retention values also produced significant (p<0.05) differences
among each feeding level with maximum values were reported at 5% feeding level. Based on the results, it is recommended that feeding in the range of 4.6 to 5.3% BW
day-1, corresponding to 2.07-2.39g protein and 16.88-19.45 kcal energy g100g-1 of the
diet day-1 is optimum for the growth and efficient feed utilization of rainbow trout,
while 2-3% feeding levels (0.90-1.35g protein and 7.34-11.01 kcal energy) suggests that these amounts approximate the maintenance requirement of fish.
Keywords: Oncorhynchus mykiss, Feeding rate, Growth performance, Maintenance requirement
1- Department of Zoology, University of Kashmir, Hazratbal, Srinagar, India *Corresponding author's Email: [email protected]
Introduction
Supplementary feed being the most critical and major part of the production cost, and is thus considered as a
determining factor in successful
economy (Booth et al., 2008; Zheng et
al., 2014). Therefore, judicious feed
management may not only enhance the
production performance, but also
reduces the production cost and effluent production which help to mitigate any
environmental impact on culture
operation.
The growth of fish at all stages is largely affected by quality of food, feeding level, feeding frequency, feed intake and its ability to absorb the
nutrients (Biswas et al., 2006; Xie et
al., 2011). Since, feed is considered as
one of the largest single item in aquaculture in terms of recurring
expenditure of fish production.
Therefore, quantification of feeding rate of cultured fish is necessary to achieve maximum production, and also useful for the determination of nutrient
requirement in fishes (Garcia-Ortega et
al., 2009; Ahmed, 2010). Determination
of the optimum feeding rate has a significant contribution in improving
the feasibility and economic of
commercial success of aquaculture through better feed utilization, reduce feed cost and also to minimize the feed
loss, reduce water pollution
(Mihelakakis et al., 2001; Woods,
2005; Du et al., 2006), and also help for
reduction in size heterogeneity (Dwyer et al., 2002). The relationship between growth rate and feeding level is very important because the expenditure of feed itself is at least 50% of the cost of
intensive farming (Gunther et al.,
1992).
The qualitative and quantitative aspects of feed consumed have a significant impact on growth rate, efficiency of feed utilization and chemical composition of fish (Lovell,
1989; Pickering, 1993; Biswas et al.,
2006), influence morphometry; such as lower condition factor and fat content which resulted changes in fatty acid
profile of the fish (Kiessling et al.,
2005; El-Saidy and Gaber, 2005). Optimum feeding rate and feeding frequency influence feed intake, feed utilization, and growth (Grayton and Beamish, 1977). At food intake levels higher than the optimum growth,
increase is negligible (Tsevis et al.,
1992), whereas sub-optimal ration may result in reduced growth and increased
size variation (Johnston et al., 2003).
Therefore, determination of optimum feeding rate is necessary to achieve the success of any aquaculture operation especially in early stage, where the fish is very susceptible to over and under feeding scenario, both resulting in increased incidences of disease and
mortality (Yuan et al., 2010).
Several studies address the potential importance for determination of feeding level in fishes with manipulate feeding regimes on growth, survival and body composition in many cultured fish species in order to improve cultured efficiency and the details of these publications have been reviewed in
previous study (Ahmed, 2010),
excepting the work of Silva et al., 2007;
Wang et al., 2007; Yuan et al., 2010;
Guzel and Arvas, 2011; Xie et al.,
2011; Zhang et al., 2011; De Riu et al.,
2012; Abidi and Khan, 2014; Zheng et
al., 2015 and Lee et al., 2016.
Despite having a potential to reduce both feed cost and environmental pressure in trout culture operation, however, no study so far been carried out to establish appropriate feed management practices on trout culture.
Rainbow trout, Oncorhynchus mykiss is
one of the most suitable fish for commercial farming in Jammu and Kashmir. However, the availability of good quality feed as well as appropriate feeding level to meet the nutritional requirements of trout for optimum production remains a major constraint under Kashmir climatic conditions. Jammu and Kashmir state basically a mountainous state covered by hills and mountains is virtually known to possess largest fresh coldwater resources of the country. However, due to the paucity of
information about the nutritional
requirements as well as the optimum feeding level of this species in the cold climatic condition of Kashmir, the success was marginal.
Although a comprehensive work related to feeding frequency and optimum feeding rate of trout have been carried out and reported from different
parts of the world (Boujard et al., 2000;
Bailey and Alanara, 2006; Blake and
Chan, 2006; Blake et al., 2006; Bureau
et al., 2006; Sevgili et al., 2006;
Rasmussen et al., 2007; Guzel and
Arvas, 2011; Sevgili et al., 2012 and
Sevgili et al., 2013), however, no
information is available on optimum
feeding level, protein, and energy maintenance requirement of fingerling O. mykiss at fingerling stage from this region. The objective of study was therefore, undertaken to investigate the effects of optimum feeding rate on growth, feed utilization efficiency, and
body proximate composition of
fingerling O. mykiss, and to determine
protein and energy maintenance
requirement of this fish.
Materials and methods Experimental diet
Casein-gelatin based purified (45%
crude protein (CP); 367.5 kcal g100g-1,
gross energy (GE)) H-440 diet (Halver, 2002) was formulated (Table 1). The dietary protein level was fixed at 45% CP, reported optimum for growth of rainbow trout (NRC, 1993). The physiological energy values of 4.5, 3.5
and 8.5 kcal g-1 for protein,
carbohydrate and fat, respectively (Jauncey, 1982) were utilized to calculate the energy content of the diet. The details for the preparation of diet up to the formation of dough used in the present study were as same as described earlier (Ahmed, 2007). The dough was passed through a pelletizer fitted with a 2 mm die to obtain pellets, which were dried in a hot air oven at 40 ºC to reduce the moisture content below 10%. The dry pellets were crumbled, sieved (0.20-0.25 mm) and stored at 4 ºC until used.
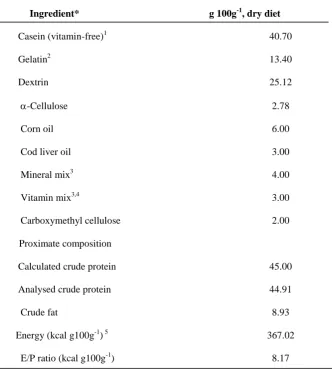
Table 1: Ingredient and proximate composition of experimental diet
Ingredient* g 100g-1, dry diet
Casein (vitamin-free)1 40.70
Gelatin2 13.40
Dextrin 25.12
-Cellulose 2.78
Corn oil 6.00
Cod liver oil 3.00
Mineral mix3 4.00
Vitamin mix3,4 3.00
Carboxymethyl cellulose 2.00
Proximate composition
Calculated crude protein 45.00
Analysed crude protein 44.91
Crude fat 8.93
Energy (kcal g100g-1) 5 367.02
E/P ratio (kcal g100g-1) 8.17
*Loba Chemie, India; 1Crude protein (80.0%); 2Crude protein (93.0%); 3Halver, 2002, mineral (AlCl3. 6H2O, 15mg; ZnSO4. 7H2O, 300mg; CuCl,10mg; MnSO4.4 -6H2O, 80mg; KI,15mg; CoCl2.6H2O,100mg; plus USP # 2 Ca (H2PO4)2. H2O, 13.58 g; C6H10CaO6 32.70 g; C6H5O7Fe.5H2O, 2.98 g; MgSO4.7H2O, 13.20 g; KH2PO4 (dibasic), 23.98 g; NaH2PO4.2H2O, 8.72g; NaCl, 4.35g (g100 g-1),
3,41g vitamin mix (choline chloride, 500.00mg; thiamine HCl, 5.00mg; riboflavin, 20.00mg; pyridoxine HCl, 5.00mg; nicotinic acid, 75.00mg; calcium pantothenate, 50.00mg; inositol, 200.00mg; biotin, 0.50mg; folic acid, 1.50mg; ascorbic acid, 100.00mg; menadione (K), 4.00mg; -tocopheryl acetate (E), 40.00mg; cyanocobalamine (B12), 0.01mg (g100g
-1
+2g -cellulose; 5Calculated on the basis of physiological fuel values 4.5, 3.5 and 8.5 kcal g-1 for protein, carbohydrate and fat, respectively (Jauncey, 1982).
Experimental design and feeding trial Rainbow trout fingerlings of the same batch and in good health condition brought to the laboratory in oxygen filled polythene bags from the nearest ‘State Government Fishery Department Seed Hatchery, Dachigam, Laribal (Srinagar, Kashmir). These fingerlings
were stocked in continuous flow-through system for a fortnight and were fed by a mixture of practical diet in the form of dry pellets. These fingerlings were then acclimatized for 2 weeks by artificial diet (Halver, 2002).
After acclimatization, the fingerling
of rainbow trout (5.650.45cm;
1.420.25g) were then randomly stocked in triplicate groups in 75 L
circular polyvinyl troughs (water
volume 60 L) fitted with a continuous
water flow-through (2.5 L min-1)
system with 20 fish per trough for each dietary ration with three replicates. The fish were fed test diet in the form of dry pellets at a rate of 2, 3, 4, 5, 6 and 7%
of their body weight day-1 on a dry to
wet basis, for ten weeks. The daily ration was subdivided into two equal halves and fed at 0800 and 1700 h. No feed was offered to the fish on the day that the measurements were taken. Initial and weekly weights were recorded on a top loading balance
(Sartorius CPA- 224S 0.1 mg
sensitivity, Goettingen, Germany) and
the weekly ration was adjusted
accordingly. Fecal matter was removed by siphoning before feeding and uneaten feed, if any, was filtered over a screen soon after the active feeding, dried and weighed in order to measure the amount of feed consumed. Water temperature, dissolved oxygen, free carbon dioxide, total alkalinity and pH, were recorded following the standard methods (APHA, 1992), and based on daily measurements were 15.5-18.5 ºC,
7.6-8.8, 5-12, 60-80 mg L-1 and 7.1-7.5,
respectively. At the end of feeding trial, fish were anaesthetized with tricaine methanesulphonate (MS 222) and final weight was measured. Weight gain, specific growth rate (SGR), feed conversion ratio (FCR) and protein efficiency ratio (PER) were calculated using the following standard formulas:
Final body weight - Initial body weight
Weight gain (%) = x 100
Initial body weight
(In mean final weight) – (In mean initial weight)
SGR= x 100
No. of Day
Dry food fed (g) FCR =
Wet weight gain (g)
Weight gain (g, wet weight basis) PER =
Protein intake (g, dry weight basis) Chemical analysis
Proximate composition of casein,
gelatin, and experimental diet, initial and final carcass in fish was estimated using standard AOAC (1995) methods
for dry matter (oven drying at 1051°C
for 22 h), crude protein (N-Kjeldhal x 6.25), crude lipid (solvent extraction with petroleum ether B.P 40-60°C) by using soxhlet extraction technique
(FOSS Avanti automatic 2050,
Sweden), and ash (oven incineration at
650 °C for 2-4 h). At the beginning of the feeding experiment, a pooled sample of 30 fish was collected for initial body composition analysis. At the end of the feeding trial, eight fish were randomly pooled from each replicate of dietary treatment and three sub-samples of each replicate from the pooled sample (n=3x3) were analyzed for final body composition.
Statistical analysis
Response of rainbow trout fingerling
fed different ration levels were
measured by growth data and by analyzing the whole body composition. The response variables were subjected to one-way analysis of variance (ANOVA) (Snedecor and Cochran, 1967; Sokal and Rohlf, 1981). To determine the significant differences among the treatments, Tukey’s multiple range test was employed. To predict more accurate responses to the feed intake, the optimum feeding level was
estimated using second-degree
polynomial regression analysis
(Y=ax2+bx+c) as described by Zeitoun
et al. (1976). The break-point obtained represented the optimum feeding level for growth. Statistical analysis was done using SPSS 20.0 (SPSS Inc., Chicago, IL, USA).
Results
The influence of feeding rate on growth
performance of O. mykiss fingerlings
fed six different levels of feeding (2, 3,
4, 5, 6 and 7% BW day-1) over the 10
week feeding trial is presented in Table 2. No mortality was observed in any of
the groups during the entire
experimental period. Significant
(p<0.05) differences were observed in
weight gain, SGR, FCR and PER of O.
mykiss fed various feeding levels. After 10-week of the feeding trial, percent
live weight gain of O. mykiss
fingerlings increased linearly with increasing feeding rate up to 5% BW
day-1, but no further increases in weight
gain (p>0.05) were observed when
feeding rate was increased beyond 5%
BW day-1. However, there was no
significant (p>0.05) difference in
weight gain between 4% and 5% feeding levels. The fish fed at 5% BW
day-1 had the highest weight gain, while
the fish fed 1% BW day-1 exhibited the
lowest weight gain among all the treatment levels. Best FCR and PER where obtained in fish fed 4% and 5% feeding levels. While the highest SGR was recorded at 5% feeding level. Fish fed various feeding levels produced significant differences in FCR, which ranged from 1.63 and 2.65 with the best FCR value 1.63 recorded at 4% feeding level, which was not significantly
(p>0.05) different to that fed at 5%
feeding level. However, further increase in feeding level resulted into no improvement or even poor FCR values as evident at 6% and 7% feeding levels.
The fish fed 4 and 5% BW day-1 had
the highest PER than that of the fish fed the other feeding levels and was found
to be significantly (p<0.05) higher
among all the feeding levels.
Table 2: Growth and Conversion efficiency of rainbow trout, Oncorhynchus mykiss fingerling fed
different feeding levels (*).
*Mean value of 3 replicatesSEM; Mean values sharing the same superscript are insignificantly different (p>0.05)
In order to generate more precise information on optimum feeding rate, second degree polynomial regression analysis was employed. On subjecting the live weight gain data to second degree polynomial regression analysis, a maximum weight gain was evident at 5.33% feeding level (Fig. 1), the relationship being:
Y= -18.1100x2 +193.3200x- 221.4198
(r = 0.967; p<0.05).
Figure 1: Second-order polynomial
relationship between live weight gain (%) and feeding levels for rainbow trout, Oncorhynchus mykiss fingerlings fed with
experimental diets for 10 weeks (n=mean of 3
replicates).
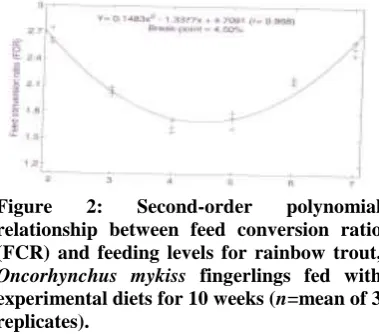
The FCR (Y) to feeding levels (X) relationship was best described by a second-degree polynomial regression analysis (Fig. 2). The equation being:
Y= 0.1483x2- 1.3377x+ 4.7091
(r = 0.968; p<0.05).
Figure 2: Second-order polynomial
relationship between feed conversion ratio (FCR) and feeding levels for rainbow trout, Oncorhynchus mykiss fingerlings fed with
experimental diets for 10 weeks (n=mean of 3
replicates).
The PER (Y) to feeding levels (X) relationship was best described by a second-degree polynomial regression analysis (Fig. 3). The equation being:
Y=- 0.0740x2 + 0.6643x- 0.1941
(r = 0.938; p<0.05).
Figure 3: Second-order polynomial
relationship between protein efficiency ratio (PER) and feeding levels for rainbow trout, Oncorhynchus mykiss fingerlings fed with
experimental diets for 10 weeks (n=mean of 3
replicates).
Based on the above equations, the best estimated FCR and PER occurred at 4.50 and 4.48 % feeding levels BW
day-1, respectively.
Body protein retention was found to
be significantly (p<0.05) higher at 5%
feeding level compared with the other feeding levels, excepting at 4% feeding
level where no significant (p>0.05)
differences in protein retention was observed. Second degree polynomial regression analysis was also employed to determine the break-point between protein retention (Y) and feeding levels (X) (Fig. 4). The relationship being:
Y= - 1.7608x2 + 16.3132x - 16.0171
(r = 0.943; p<0.05)
Figure 4: Second-order polynomial
relationship between protein retention
efficiency (PRE) and feeding levels for
rainbow trout, Oncorhynchus mykiss
fingerlings fed with experimental diets for 10
weeks (n=mean of 3 replicates).
Similarly energy retention was found to
be significantly (p<0.05) higher at 5%
feeding level BW day-1 when compared
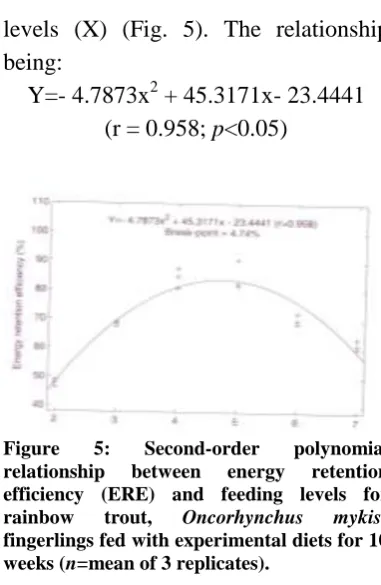
with the other feeding levels, except at 4% feeding level, where almost similar energy retention value was also achieved. Second degree polynomial regression analysis was also employed to determine the break-point between energy retention (Y) and dietary ration
levels (X) (Fig. 5). The relationship being:
Y=- 4.7873x2 + 45.3171x- 23.4441
(r = 0.958; p<0.05)
Figure 5: Second-order polynomial
relationship between energy retention
efficiency (ERE) and feeding levels for
rainbow trout, Oncorhynchus mykiss
fingerlings fed with experimental diets for 10
weeks (n=mean of 3 replicates).
Based on the above equations, the highest protein retention (21.77%) and energy retention (83.80%) occurred at 4.63% and 4.74% feeding levels, respectively.
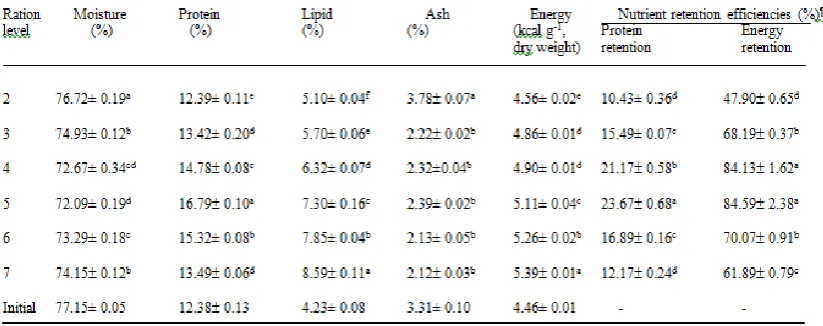
The whole body composition of the fish fed different feeding levels at the end of trial is presented in Table 3. Fish
fed lower feeding levels had
significantly (p<0.05) higher moisture
contents and was progressively declined with increasing feeding levels up to 5%
BW day-1 and thereafter a significant
increase in whole body moisture content was again noticed. Whole body protein content was found to be
significantly (p<0.05) higher at 5%
feeding levels compared to that fed the other dietary groups. A linear increase in whole body lipid content was evident with increasing feeding levels and a
significantly (p<0.05) highest lipid
content was noted at 7% feeding level
BW day-1. Contrary to protein and lipid
no significant (p>0.05) differences were found in whole body ash content in fish
fed by different feeding levels BW day
-1
, except at 2% feeding level where
significantly (p<0.05) highest body ash
content was reported.
Based on the above second-degree polynomial regression analysis results
and body composition, it is
recommended that feeding rate in the
range of 4.6% to 5.3% BW day-1,
corresponding to 2.07-2.39 g protein
and 16.88-19.45 kcal energy 100 g-1 of
the diet day-1 is optimum for the growth
and efficient feed utilization of rainbow trout, while 2-3% feeding levels (0.90-1.35 g protein and 7.34-11.01 kcal
energy g 100 g-1) suggests that these
levels approximate the maintenance requirement of this fish.
Table 3: Carcass composition and nutrient retention efficiency of rainbow trout, Oncorhynchus
mykiss fingerling fed varying feeding levels (*)
*
Mean value of 3 replicates SEM; Mean values with the same superscript are insignificantly different (p>0.05)
100 X [(Final body weight (g) X % nutrient of final body weight) – (Initial body weight (g) X % nutrient of initial body weight)]/[(amount of diet fed) X (% crude protein or total energy in the diet)
Discussion
The aim of this feeding experiment was to examine the exact utilization of feed which can promote best growth and also to know that how much quantity of protein and energy is required for rainbow trout in terms of both for optimum growth and for maintenance purposes. An optimal ration maximizes
growth rate and minimizes size
variability and reduces food waste
(Booth et al., 2008; Oberg et al., 2014),
and also reduces feed cost and improve
water quality. Therefore, precise
knowledge about the relationship
between growth and ration is pre requisite not only for promoting good growth and feed efficiency ratio, but also useful for preventing incidence of water quality deterioration as a result of excess feeding. Thus, determination of appropriate feeding level is one of the key factors for better growth, feed conversion, nutrient retention efficiency and chemical composition of fish (Yuan et al., 2010; Zhang et al., 2015). Hence, a better understanding of the conversion of the dietary inputs in to fish biomass
is a key factor to improving the
economic and environmental
sustainability of aquaculture operation
including survival (Bureau et al., 2006;
Zheng et al., 2015).
The essentiality of feeding rate for the normal growth of rainbow trout was clearly demonstrated in this study. In the present study, weight gain of fingerlings rainbow trout fed different feeding levels linearly increase with the increase of feeding levels and reached
its plateau fed at 5% BW day-1. The
significant growth improvement was recorded with increasing feeding levels
up to 5% BW day-1, which was not
significantly different from the values
achieved in fish fed at 4% of BW day-1.
This showed that feeding rainbow trout
in the range of 4-5% BW day-1 results
in maximum feed utilization for growth and other activities. However, the fish
fed at a feeding level of 5% BW day-1
produced maximum live weight gain and SGR, but produced insignificantly low FCR values compared to those fed
4% BW day-1 feeding level because at
4% feeding level fish probably also tended to optimize digestion to extract nutrient more efficiently. The best FCR obtained at 4 and 5% feeding level with maximum protein and energy retention values recorded at both levels clearly indicating the better utilization of feed at these levels, which were also supported by body composition of fish. On the other hand, a gradual decline in conversion efficiency was noticed in fish fed at higher feeding levels i.e. 6
and 7% BW day-1 which can be the
result of loss of nutrients and wastage of food, as fish took longer time to
consume food to reach satiation (Tvenning and Giskegjerde, 1997). Increased feed wastage with increasing feeding rate has also been reported for
tambaqui, Colossoma macropomum
(Van der Meer et al., 1997), milk fish,
Chanos chanos (Sumagaysay, 1998),
bagrid catfish, M. numurus (Ng et al.,
2000), Chinese long snout catfish, Leiocassis longirostraris (Han et al.,
2004) and juvenile gross carp,
Ctenopharyngodon idella (Du et al., 2006). Hassan and Jafri (1994) reported gradual decline in growth rate and feed conversion efficiency in fish fed at
higher ration levels in Clarias
batrachus. Ahmed (2007) also reported similar result in Indian major carp, Labeo rohita. In the present study, a similar trend in feed conversion efficiency was also noticed in rainbow trout fed at higher feeding levels than optimum. This may be due to the fact that the consumption of excess amount of feed put over burden on digestion process as nutrients are first involved in digestion instead of growth. The other reason for growth retardation in fingerling rainbow trout fed at 6% and
7% BW day-1 could be due to over
burden of dietary nitrogen in the body requiring additional energy for its elimination which is done at the cost of deposited nutrients and the same has confirmed with low body protein content at these feeding rates. The nitrogen in the form of surplus amino acids resulting from the excess feeding levels at 6% and 7% are not stored in fish, they are to be deaminated requiring extra energy expenditure towards catabolism and hence adversely
affected the growth of the fish at higher feeding levels.
The low growth rate and FCR
reported at 2% and 3% BW day-1
suggests that these feeding levels could approximate only to the maintenance requirements of nutrients in rainbow trout, wherein the major portion of ingested nutrients is utilized to maintain life and a smaller portion is available for growth. Present findings on rainbow trout also seem in agreement with the observations of Hung and Lutes (1987)
on Acipenser transmontanus and
Ahmed (2010) on Heteropneustes
fossilis. On the other hand, significant increase in growth of fish fed at 4% and
5% BW day-1 indicates that large
portion of nutrients were utilized for growth and tissue building besides that utilized for maintenance.
The whole body composition of fish is often used as an indicator of fish health and flesh quality. Many studies have described the effect of diet and feeding rate on growth and body composition (Reinitz, 1983a; Han, 2004). Several other factors, including growth, ingredient used in the diet, and water temperature are also known to influence the body composition of fish. Body composition is also significantly
influenced by feeding rate (Panda et al.,
1999; Adebayo et al., 2000; Khan et al.,
2004; Du et al., 2006; Ahmed, 2007,
2010). In the present study, the whole body composition of rainbow trout fed varying feeding levels indicates that the
composition parameters was
significantly influenced by the feeding levels. Whole body moisture content gradually decreased with the increase of
feeding levels up to 5% and thereafter, a significant increase in body moisture
content was noted. Gatlin et al. (1986)
also reported decrease in body moisture content of fingerling channel catfish
with increasing feeding rate.
Storebakken and Austreng (1987b) reported that variation in the content of moisture were mainly a direct results of ration level. Body protein content increased with the increasing of feeding levels up to 5% and thereafter a significant fall of body protein was also noticed. The lipid content of fish fed various feeding levels linearly increased with the increasing of feeding levels and maximum lipid content was
reported at 7% BW day-1 feeding level.
The similar results on lipid content of rainbow trout with different feeding levels has also been reported in the past
study(Storebakken and Austreng,
1987a) and some other fish species such as C. gariepinus (Adebayo et al., 2000),
and green sturgeon, A. medirostris
(Zheng et al., 2015). Rasmussen and
Ostenfeld (2000) reported that lipid accumulation is prevalent during fast growth at high rations, while lipid deposition is subtle during slow growth due to the presence of adequate energy in excess feed deposition as lipid (Reinitz, 1983a,b). At lower feeding level a slightly lower lipid content was observed, though at the same time the
fish could manage to maintain
relatively higher and constant amount of protein in their body tissue over the initial value, suggesting that in this fish, body lipid is mobilize as energy reserves to support fish as energy over protein. Similar results on body lipid
content were also reported in the previous study on different fish species
(Huges and Lutes, 1987; Brown et al.,
1990; Hassan and Jafri, 1994; Khan et
al.. 2004; Ahmed, 2007, 2010). In
contrast to protein and lipid contents, the whole body ash showed no significant differences in their ash values among various feeding levels and remained constant with each other, excepting at initial feeding level i.e. 2%
BW day-1, where significantly higher
ash content was reported. The decline in ash content with higher rations could be due to relatively low skeletal growth compared with other tissue (Resmussen and Ostenfield, 2000). Similar results on ash content with varying feeding level has also been reported in cuneate
drum, Nibea miichthioides (Wang et al.,
2007). Contrary to this, the higher body ash content reported the groups fed at lower feeding levels were probably due to higher proportions of bone mass and less muscle mass thus resulting to potentially higher ash content in fish fed lower feeding levels.
The protein and energy retention of fish fed various feeding levels showed an increasing trend with increasing feeding level and reached its maximum
values at 5% feeding level BW day-1
and thereafter a decrease in protein and energy retention values were noted. On the other hand, the low protein and energy retention values obtained at sub-optimal feeding levels indicates that a substantial amount of the reduced energy intake was used to compensate the maximum requirement at the expanse of somatic growth. Similar trends on protein and energy retention
values has also been reported in
juvenile turbot, Scophthalmus maximus
(Van Ham et al., 2003), because energy
and protein consumption is the product of feed intake and feed composition. On subjecting the growth data such as weight gain, FCR, PER, protein and energy retention to second-degree polynomial regression analysis, break-points were occurred at 5.33, 4.50, 4.48,
4.63 and 4.74% feeding levels,
respectively. The break-points indicate that the feeding rate in the range of
4.60% to 5.30% BW day-1 is optimum
for growth of rainbow trout.
Based on the results of the present study on optimum feeding rate, body composition, and energy and protein maintenance requirement of rainbow trout, it is recommended that provision of feeding rate in the range of 4.60% to
5.30% BW day-1, corresponding to
2.07-2.39g protein and 16.88-19.45 kcal
energy g 100g-1 of the diet day-1 is
optimum for the growth and efficient feed utilization. Whereas poor FCR and live weight gain obtained at 2-3% feeding levels, corresponding to 0.90-1.35g protein and 7.34-11.01 kcal
energy g 100g-1 of the diet day-1
suggests that these levels approximate the maintenance requirement of the fish. The optimum feeding level recommended in the present study for rainbow trout (4.60%-5.30%) is slightly higher than 2% feeding level reported earlier for rainbow trout weighing 0.5-1.0 kg (Storebakken and Austrung, 1987a) and is lower than the feeding level reported for other fish species
such as brown trout, Salmo trutta
(Elliot., 1975). However, when
compared the feeding level recommended in the present study with other fish species, a wide range of results have been achieved in similar groups of fish examined.
The variation in feed intake among fish species or within the species may be due to the difference in the methodologies used such as the nature of diet composition, water temperature, flow rate, stocking density, size, feeding frequency, habitat, photoperiod, etc (Brett, 1979; Fiogbe and Kestemont, 2003; Bailey and Alanara, 2006). Taking the above factors in to the consideration in the present study a standard protocol and diet has been chosen for determination of feeding
level and energy and protein
maintenance requirement of rainbow trout and the data found in the present study would be useful for its maximum
production as well as nutrient
requirement determination such as protein, amino acids, vitamins, minerals and fatty acids.
Acknowledgements
The author is grateful to the Head, Department of Zoology, University of Kashmir, Hazratbal, Srinagar, India for providing the laboratory facilities and gratefully acknowledge the financial support from the Department of Biotechnology (DBT), Govt. of India, New Delhi in the form of Project (No. BT/PR10573/AAQ/3/654/2013) on Fish
Nutrition and Diet development.
Thanks are also due to Mr. Mufti Buhran, University Chief Executive Engineer for helping the construction of new Feed Technology Laboratory
(Wet-Lab.) in the Department of Zoology.
References
Abidi, S.F. and Khan, M.A., 2014. Evaluation of feeding rate based on growth, feed conversion, protein gain and carcass quality of fingerling
Indian major carp, Catla catla
(Hamilton). Aquaculture Research,
45, 439-447.
Adebayo, O.T., Balogun, A.M. and Fagbenro, O.A., 2000. Effect of feeding rates on growth, body
composition and economic
performance of juvenile clariid
catfish hybrid (♀ Clarias gariepinus
x ♂ Heterobranchus bidorsalis).
Journal of Aquaculture in the Tropics, 15, 109-17.
Ahmed, I., 2010. Response to the ration levels on growth, body composition, energy, and protein maintenance requirement of the
Indian catfish (Heteropneustes
fossilis-Bloch 1974). Fish
Physiology and Biochemistry, 36, 1133-1143.
Ahmed, I., 2007. Effect of ration levels
on growth, body composition,
energy and protein maintenance requirement of fingerling Indian
major carp, Labeo rohita (Hamilton).
Fish Physiology and Biochemistry,
33,203-212.
Al-Hafedh, Y.S. and Ali, S.A., 2004. Effects of feeding on survival,
cannibalism, growth and feed
conversion of African catfish,
Clarias gariepinus (Burchell) in
concrete tanks. Journal of Applied
Ichthyology, 20, 225-227.
AOAC, 1995. Official methods of analysis. 16th ed. Association of
Official Analytical Chemists.
Arlington, Virginia, USA.
APHA, 1992. Standard methods for the
examination of water and
wastewater, 18th ed. APHA,
Washington, DC, 1268 P.
Austreng, E., Storebakken, T. and Asgard, T., 1987. Growth rate
estimates for cultured Atlantic
salmon and rainbow trout.
Aquaculture, 60, 157-160.
Bailey, J. and Alanara, A., 2006. Effect of feed portion size on growth
of rainbow trout Oncorhynchus
mykiss (Walbaum), reared at
different temperatures. Aquaculture,
253, 728-730.
Biswas, G., Jena, J.K., Singh, S.K., Patmajhi, P. and Muduli, H.K., 2006. Effect of feeding frequency on growth, survival and feed utilization
in mrigal, Cirrhinus mrigala, and
rohu, Labeo rohita, during nursery
rearing. Aquaculture, 254, 211-218.
Blake, R.W. and Chan, K.H.S., 2006. Cyclic feeding and subsequent
compensatory growth do not
significantly impact standard
metabolic rate or critical swimming
speed in rainbow trout. Journal of
Fish Biology, 69, 818-827.
Blake, R.W., Inglis, S.D. and Chan, K.H.S., 2006. Growth, carcass composition and plasma growth hormone levels in cyclically fed
rainbow trout. Journal of Fish
Biology, 69, 807-817.
Booth, M.A., Tucker, B.J., Allan, G.L.and Stewart Fielder, D., 2008. Effect of feeding regime and fish
size on weight gain, feed intake and
gastric evacuation in juvenile
Australian snapper Pagrus auratus.
Aquaculture, 282, 104-110.
Boujard, T., Burel, C., Medale, F., Haylor, G. and Moisan, A., 2000. Effect of past nutritional history and fasting on feed intake and growth in
rainbow trout Oncorhynchus mykiss.
Aquatic Living Resources, 13, 129-137.
Brett, J.R., 1979. Environmental factors and growth. In: Hoar WS, Randall DJ, Brett JR (eds), Fish Physiology. Academic Press, New York, USA, Vol. VIII, pp. 599-675
Brown, P.B., Neill, W.H. and
Robinson, E.H., 1990. Preliminary evaluation of whole body energy changes as a method of estimating maintenance energy needs of fish. Journal of Fish Biology, 36, 107-108.
Bureau, D.P., Hua, K. and Cho, C.Y., 2006. Effect of feeding level on growth and nutrient deposition in
rainbow trout (Oncorhynchus mykiss
Walbaum) growing from 150-600g. Aquaculture Research, 37, 1090-1098.
De Riu, N., Zheng, K.K., Lee, J.W., Lee, S.H., Bai, S.C., Moniello, G. and Hung, S.S.O., 2012. Effects of
feeding rates on growth
performances of white sturgeon (Acipenser transmontanus) fries. Aquaculture Nutrition, 18, 290-296. Du, Z.Y., Liu, Y.J., Tian, L.X., He,
J.G., Cao, J.M. and Liang, G.Y., 2006. The influence of feeding rate on growth, feed efficiency and body composition of juvenile grass carp
(Ctenopharyngodon idella). Aquaculture International, 14, 247-257.
Dwyer, K.S., Brown, J.A., Parrish, C. and Lall, S.P., 2002. Feeding frequency affects food consumption, feeding pattern and growth of
juvenile yellowtail flounder
(Limanda ferruginea). Aquaculture, 213, 279-292.
Elliot, J.M., 1975. The growth rate of
brown trout (Salmo trutta L.) fed on
reduced rations. Journal of Animal
Ecology, 44, 823-842.
El-Saidy, D.M.S.D. and Gaber, M.A., 2005. Effect of dietary levels and
feeding rates on growth
performance, production traits and body composition of Nile tilapia, Oreochromis niloticus (L.) cultured
in concrete tanks. Aquaculture
Research, 36,163-171.
Fiogbe, E.D. and Kestemont, P., 2003. Optimum ration for Eurasian perch Perca fluviatilis L. reared at its
optimum growing temperature.
Aquaculture,216, 243-252.
Garcia-Ortega, A., Verreth, J., Vermis, K., Nelis, H.J., Sorgeloos, P. and Verstegen, M., 2009. Laboratory investigation of daily food intake and gut evacuation in
larvae of African catfish Clarias
gariepinus under different feeding
conditions. Aquaculture
International, 18, 119-134.
Gatlin, D.M. III., Poe, W.E. and Wilson, R.P., 1986. Protein and energy requirements of fingerling channel catfish for maintenance and
maximum growth. Journal of
Nutrition, 116, 2121-2131.
Grayton, B.D. and Beamish, F.W.H., 1977. Effects of feeding frequency on food intake, growth and body
composition of rainbow trout (Salmo
gairdneri). Aquaculture, 11, 159-172.
Gunther, J., Galvez-Hidalgo, N., Ulloa-Rojas, J., Coppoolse, J. and Verreth, J.A.J., 1992. The effect of feeding level on growth and survival
of jaguar guapote (Cichlasoma
managuense) larval fed Artemia
nauplii. Aquaculture, 107, 347-358.
Guzel, S. and Arvas, A., 2011. Effects of different feeding strategies on the growth of young rainbow trout (Oncorhynchus mykiss). African Journal of Biotechnology, 10, 5048-5052.
Halver, J.E., 2002. The vitamins. In: Halver JE, Hardy RW (eds). Fish Nutrition, 3rd edn. Academic Press, San Diego, CA, pp. 61-141.
Hassan, M.A. and Jafri, A.K., 1994. Optimum feeding rate, and energy
and protein maintenance
requirements of young Clarias
batrachus (L.) a cultivable catfish
species. Aquaculture Fishery
Mangagement, 25, 427-438.
Hung, S.S.O. and Lutes, P.B., 1987. Optimum feeding rate of hatchery produced juvenile white sturgeon (Acipenser transmontanus) at 20 °C. Aquaculture, 65, 307-317.
Jauncey, K., 1982. The effects of varying dietary protein level on the growth, food conversion, protein
utilization and body composition of
juvenile tilapias (Sarotherodon
mossambicus). Aquaculture,27, 43-54.
Johnston, G., Kaiser, H., Hecht, T. and Oellermann, L., 2003. Effect of ration size and feeding frequency on growth, size distribution and survival
of juvenile clownfish, Amphiprion
percula. Journal of Applied
Ichthyology, 19, 40-43.
Khan, M.A., Ahmed, I. and Abidi, S.F., 2004. Effect of ration size on growth, conversion efficiency and body composition of fingerling
mrigal, Cirrhinus mrigala
(Hamilton). Aquaculture Nutrition,
10, 47-53.
Kiessling, A., Pickova, J., Eales, J.G., Dosanjh, B. and Higgs, D., 2005. Age, ration level, an exercise affect the fatty acid profile of Chinook
salmon (Oncorhynchus tshawytscha)
muscle differently. Aquaculture,
242, 345-356.
Lee, S., Haller, L.Y., Fangue, N.A., Fadel, J.G. and Hung, S.S.O., 2016. Effects of feeding rate on growth performance and nutrient partitioning of young-of-the-year
white sturgeon (Acipenser
transmontanus). Aquaculture
Nutrition, 22, 400-409.
Lovell, R.T., 1989. Nutrition and feeding of fish. Van Nostrand Reinhold, New York, NY. 260 P. Mihelakakis, A., Yoshimatsu, T. and
Tsolkas, C., 2001. Effects of feeding rate on growth, feed utilization and body composition of red porgy
fingerlings: preliminary results.
Aquaculture International, 9, 237-245.
NRC (National Research Council), 1993. Nutrient requirements of warmwater fishes and shellfishes,
National Academy Press,
Washington, DC, 102 P.
Oberg, E.W., Faulk, C.K. and
Fuiman, L.A., 2014. Optimal
dietary ration for juvenile pigfish, Orthopristis chrysoptera, growth. Aquaculture, 433, 335-339.
Panda, S., Mishra, K. and
Samantaray, K., 1999. Effect of
feeding rate on the growth
performance of Channa punctatus
(Bloch) fry, and protein and energy requirement for their maintenance
and maximum growth. Journal of
Aquaculture, 7, 37-42.
Pickering, A.D., 1993. Growth and
stress in fish production.
Aquaculture, 111, 51-63.
Rasmussen, R.S., Larsen, F.H. and Jensen, S. 2007. Fin condition and growth among rainbow trout reared at different sizes, densities and
feeding frequencies in
high-temperature re-circulated water.
Aquaculture International, 15, 97-107.
Rasmussen, R.S. and Ostenfeld, T.H., 2000. Effect of growth rate on quality traits and feed utilization of
rainbow trout (Oncorhynchus
mykiss) and brook trout (Salvelinus fontinalis). Aquaculture, 184, 327-337.
Reinitz, G., 1983a. Relative effect of age, diet and feeding rate on the body composition of young rainbow
trout (Salmo gairdneri). Aquaculture, 35, 19-27.
Reinitz, G., 1983b. Influence of diet and feeding rate on the performance and production costs of rainbow
trout. Transactions of the American
Fisheries Society, 112,830-833. Sevgili, H., Emre, Y., Kanyilmaz, M.,
Diler, I. and Hossu, B., 2006. Effect of mixed feeding schedules on
growth performance, body
composition, and nitrogen- and phosphorus balance in rainbow trout,
Oncorhynchus mykiss. Acta
Ichthyologica et Piscatoria, 36, 49-55.
Sevgili, H., Hossu, B., Emre, Y. and
Kanyılmaz, M., 2012.
Compensatory growth after various levels of dietary protein restriction in
rainbow trout, Oncorhynchus mykiss.
Aquaculture, 349, 126-134.
Sevgili, H., Hossu, B., Emre, Y. and
Kanyılmaz, M., 2013.
Compensatory growth following
various time lengths of restricted
feeding in rainbow trout
(Oncorhynchus mykiss) under
summer conditions. Journal of
Applied Ichthyology, 29, 1330-1336.
Silva, C.R., Gomes, L.C. and
Brandao, F.R., 2007. Effect of feeding rate and frequency on
tambaqui (Colossoma macropomum)
growth, production and feeding costs
during the first growth phase in
cages. Aquaculture, 264,133-139.
Snedecor, G.W. and Cochran, W.G., 1967. Statistical methods, 6th ed. Iowa State University Press, Iowa, 593 P.
Sokal, R.R. and Rohlf, F.J., 1981. Biometry. Freeman New York, WH, 859 P.
Storebakken, T. and Austreng, E., 1987a. Ration level for salmonids. I. Growth, survival, body composition and feed conversion in Atlantic
salmon fry and fingerlings.
Aquaculture, 60, 189-206.
Storebakken, T. and Austreng, E., 1987b. Ration level for salmonids. II. Growth, feed intake, protein digestibility, body composition, and feed conversion in rainbow trout
weighing 0.5-1.0 kg. Aquaculture,
60, 207-221.
Sumagaysay, N.S., 1998. Milk fish (Chanos chanos) production and water quality in brackish water ponds at different feeding levels and
frequencies. Journal of Applied
Ichthyology, 14,81-85.
Tsevis, N., Spiros, K. and Conides, A., 1992. Food conversion budget in
sea bass, Dicentrarchus labrax,
fingerling under two different
feeding frequency patterns.
Aquaculture, 101, 293-304.
Tvenning, L. and Giskegjerde, T.A., 1997. FCR as a function of ration. FAO East Fish Magazine. pp. 70-72. Van der Meer, M.B., Faberm R.,
Zamora, J.E. and Verdegem, M.C.J., 1997. Effect of feeding level on feed losses and feed utilization of
soya and fishmeal diets in
Colossoma macropomum (Cuvier). Aquaculture Research, 28, 391-403. Van Ham, E.H., Berntssen, M.H.G.,
Imsland, A.K., Parpaura, A.C.,
Wendelaar Bonga, S.E. and
Steffansson, S. O., 2003. The
influence of temperature and ration on growth, feed conversion, body composition and nutrient retention of
juvenile turbot (Scophtalmus
maximus). Aquaculture, 217, 547-558.
Wang, Y., Kong, L.J., Li, K. and Bureau, D.P., 2007. Effect of feeding frequency and ration level on growth, feed utilization and nitrogen waste output of cuneate
drum (Nibea miichthioides) in net
pens. Aquaculture, 271, 350-356.
Woods, C.M.C., 2005. Growth of
cultured seahorses (Hippocampus
abdominalis) in relation to feed
ration. Aquaculture International,
13,305-314.
Xie, F., Ai, Q., Mai, K., Xu, W. and Ma, H., 2011. The optimal feeding frequency of large yellow croaker (Pseudosciaena crocea, Richardson)
larvae. Aquaculture, 311, 162-167.
Yuan, Y.C., Yang, H.J., Gong, S.Y., Luo, Z., Yuan, H.W. and Chen, X.K., 2010. Effects of feeding levels
on growth performance, feed
utilization, body composition and apparent digestibility coefficients of
nutrients for juvenile Chinese
sucker, Myxocyprinus asiaticus.
Aquaculture Research, 41, 1030-1042.
Zeitoun, I.H., Ullrey, D.E., Magee, W.T., Gill, J.L. and Bergen, W.G.,
1976. Quantifying nutrient
requirements of fish. Journal of
Fishery Research Board of Canada,
33,167-172.
Zhang, L., Zhao, Z., Xiong, D., Fang, W., Li, B., Fan, Q., Yang, K. and Wang, X., 2011. Effects of ration
level on growth, nitrogenous
excretion and energy budget of
juvenile catfish, Pelteobagrus
fulvidraco (Richardson).
Aquaculture Research, 42, 899-905. Zheng, K.K., Deng, D.F., De Riu, N.,
Moniello, G. and Hung, S.S.O., 2015. The effect of feeding rate on the growth performance of green
sturgeon (Acipenser medirostris) fry.
Aquaculture Nutrition, 21, 489-495.