Probabilistic Methods for Service Clustering
Gilbert Cassar, Payam Barnaghi, and Klaus Moessner Centre for Communication Systems Research
University of Surrey Guildford, GU2 7XH, UK
{g.cassar, p.barnaghi, k.moessner}@surrey.ac.uk
Abstract. This paper focuses on service clustering and uses service de-scriptions to construct probabilistic models for service clustering. We dis-cuss how service descriptions can be enriched with machine-interpretable semantics and then we investigate how these service descriptions can be grouped in clusters in order to make discovery, ranking, and recommen-dation faster and more effective. We propose using Probabilistic Latent Semantic Analysis (PLSA) and Latent Dirichlet Allocation (LDA) (i.e. two machine learning techniques used in Information Retrieval) to learn latent factors from the corpus of service descriptions and group services according to their latent factors. By creating an intermediate layer of latent factors between the services and their descriptions, the dimen-sionality of the model is reduced and services can be searched and linked together based on probabilistic methods in latent space. The model can cluster any newly added service with a direct calculation without requir-ing to re-calculate the latent variables or re-train the model.
1
Introduction
The Service Oriented Architecture (SOA) is a model currently used to pro-vide services on the Internet. SOA typically consists of three entities: a service provider, a client, and a broker. A service provider offers the service and adver-tises it by publishing a service description. A client looks for a service to fulfill a certain task or to consume service data. The service broker accepts queries from the client, refers to service descriptions supplied by the provider and returns Web Service Description Language (WSDL)1documents describing the best matches
to the query. However the common technologies used to describe, publish, and discover services offer very limited freedom of expressiveness to the service de-signers. Service description frameworks such as WSDL provide descriptions of what a service is and what it can do; however with these kinds of descriptions machines still cannot easily interprete different concepts described in the ser-vice description. If more expressive technologies are used to describe a serser-vice, machines will be able to use semantics, reasoning, and linked data2 to process
the service descriptions and generate new knowledge from what is supplied in 1 http://www.w3.org/TR/wsdl20/
the service description; so this knowledge can be refered to by software agents or search clients to offer better service search results and recommendations in different applications.
The service repositories on the Internet are being increasingly over-populated with more services created and published by users. Retrieving services which can match to a user query is becoming a challenging task. By organising the service data into clusters, services become easier and thus faster to be discovered and recommended [11]. Clustering is an approach that transforms a complex problem into a series of simpler sets which are easier to handle. Service Clustering aims to group together those services which are similar to each other. Service Clustering can be very helpful in terms of service recommendation and ranking since services that are similar to the one chosen by the user will be grouped in the close neighbourhood of that service. Methods for Service Composition can also benefit from clustering of services because compatible services can be found more easily if the services are clustered based on their functional attributes.
In this paper we investigate using probabilistic machine-learning methods to extract latent factors zf²Z ={z1, z2, ..., zk} from semantically enriched service
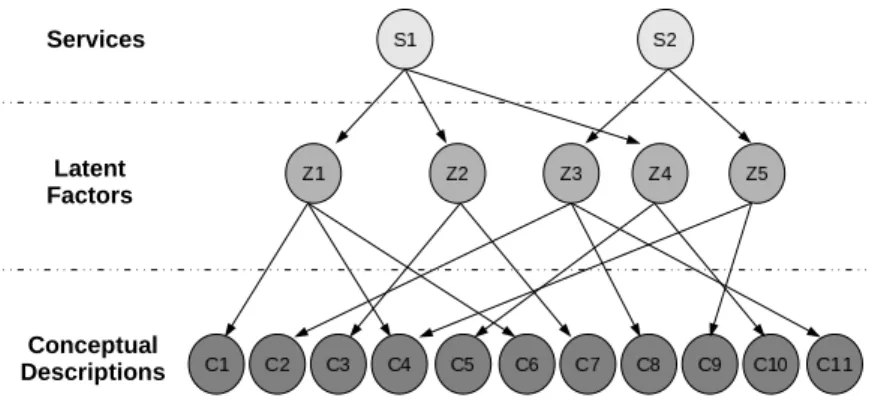
descriptions. By describing the services in terms of latent factors, the dimension-ality of the system is reduced considerably. The latent factors can then also be used to efficiently cluster the services in a repository, making the model more scalable and also more efficient in terms of publishing new service descriptions to the repository. Figure 1 shows an example of assigning services to latent vari-ables rather than conceptual words. In this work we elaborate the concept of latent variables and describe how those variables can be calculated for service descriptions.
Fig. 1.Describing services in terms of latent factorszf²Z={z1, z2, ..., zk}rather than
The rest of this paper is organised as follows. Section 2 provides an overview of related work. In Section 3 we propose a clustering mechanism based on Probabilistic Latent Semantic Analysis (PLSA) and Latent Dirichlet Allocation (LDA). Section 4 explains how we evaluate our clusters. Section 5 presents the results obtained in our experiments and discusses the experimental data. Section 6 concludes the paper and discusses the future work.
2
Related Work
In this section we briefly discuss some service description models and then dis-cuss related concepts to service clustering. First we disdis-cuss the Onthology Web Language for Services (OWL-S)3 as it is the fundamental building block of our
approach and then we describe the clustering technologies related to our work.
2.1 Service Description Models
A detailed and machine-readable service description is the fundamental building block for providing an architecture in which advanced service discovery mech-anisms can be performed [2]. Service descriptions are defined using a service description model. A service description model becomes a template that service providers will use in order to publish and advertise the services that they of-fer. Various approaches for creating service description models exist, including: WSDL, USDL4, Web Service Modelling Language (WSML)5 and Web Service
Modelling Ontology (WSMO)6, and OWL-S.
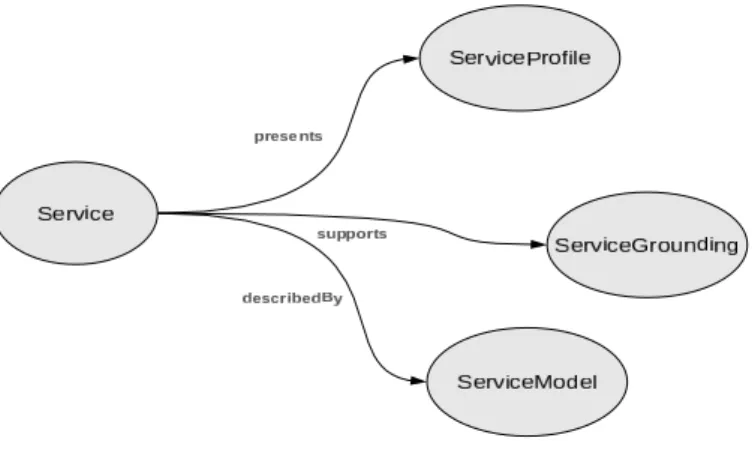
OWL-S is a Service Description Framework that provides both rich expres-sive descriptions and well-defined semantics. OWL-S describes the characteristics of a service by using three top-level concepts, namely ServiceProfile, Service-Grounding, and ServiceModel. ServiceProfile provides the information needed to discover services. ServiceGrounding and ServiceModel provide information to deploy and use the service.
The Service Profile provides a concise but meaningful description of the ser-vice capabilities in order to advertise the serser-vice in a registry. However, once the service has been selected from the registry, the Profile is no more of use and the information contained in the ServiceModel is then used to interact with the service.
The ServiceGrounding describes how to access the services. In OWL-S, Ser-viceProfile and ServiceModel are abstract representations of a service and only the ServiceGrounding contains information about protocol and message formats, serialisation, transport, and addressing.
3 http://www.w3.org/Submission/OWL-S/
4 http://www.internet-of-services.com/index.php?id=24 5 http://www.wsmo.org/wsml/
Fig. 2.The structure of OWL-S
The concepts of Input, Output, Preconditions, and Effects are all defined in OWL-S both in the ServiceProfile and in the ServiceModel. OWL-S provides the main attributes to describe services and their functional attributes.
Another effective aspect of OWL-S is that it still relies on existing standards for service invocation and discovery. Service invocations are still carried out using WSDL definitions and OWL-S is designed so that it can extend UDDI for service discovery making it easily integrable with the current SOA.
In this paper, we describe constructing a vector space model using OWL-S descriptions and in Section 3 we discuss how the vector space model is used for training probabilistic models. The probabilistic models are then used to cluster the services.
2.2 Vector Space Modelling and Feature Extraction
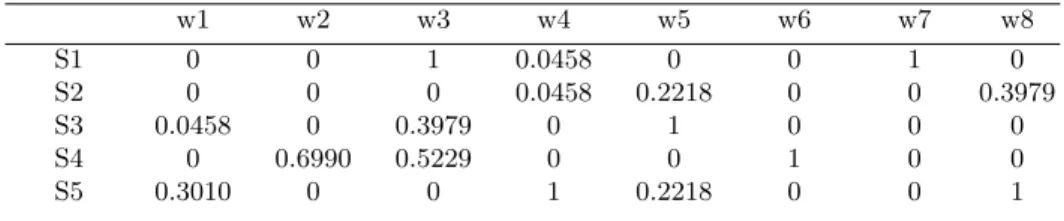
Vector Space Modelling (VSM) is a technique used to convert data to vector form in order to facilitate computational analysis of the data. In information retreival, a widely used method for converting a text document to Vector Space form is to use the Text Frequency and Inverse Text Frequency (TF/IDF) algo-rithm [13]. Maet al. use this technique in [8] to represent a dataset of WSDL service descriptions in the form of a Service Transaction Matrix as shown in Ta-ble 1. In Maet al.’s work each row represents a WSDL service description, each column represents a word from the whole text corpus, and each entry represents the TF/IDF weighting of that word in the respective WSDL document. TF/IDF weightwij for a word j in servicei is calculated as follows:
wij =tfij·log µ n nj ¶ (1) wheretfij is the word frequency of wordj in service descriptioni, n is the total number of service descriptions, andnj is the number of services that
con-tain word j.
A variation of TF/IDF is proposed in [14] where a higher weight is given to the IDF value. The reason behind this approach is to normalise the bias of TF measure in short documents. The frequency of words in very short documents such as service descriptions tends to be incidental. Thus the proposedT F/IDF2
equation in [14] is described as the following:
wij=tfij·log µ n nj ¶2 (2) Wanget al.[16] prepare textual data for analysis using Part-of-Speech tag-ging to identify and remove stop words from the word corpus. The Stanford Log-Linear POS-tagger7is used in their work to POS-tag the text and only the
nouns, verbs, and adjectives were kept for further analysis. The remaining words are then used to describe each document as a vector of text frequencies.Using vector space model, the proximity between two vectors will then also correspond to similarity of their data characteristics. The vectors which are very similar can be clustered together using clustering techniques.
Table 1.A simplified TF/IDF matrix.
w1 w2 w3 w4 w5 w6 w7 w8 S1 0 0 1 0.0458 0 0 1 0 S2 0 0 0 0.0458 0.2218 0 0 0.3979 S3 0.0458 0 0.3979 0 1 0 0 0 S4 0 0.6990 0.5229 0 0 1 0 0 S5 0.3010 0 0 1 0.2218 0 0 1
When describing data in vector space, we represent different features of our data as different dimensions in a multi-dimensional form. The extraction of fea-tures to vector space is also calledIndexing. Approaches like TF-IDF which parse the text in every document and then treat every word as a seperate dimension are referred to as Syntactic Indexes [11]. Syntactic Indexes have the advantage of being able to parse any textual document and convert it to a vector format which complies with the rest of the documents; however it results in a large number of dimensions in vector space that becomes very computationally expensive. In the context of service descriptions, it does not have the ability to focus on just some selected characteristics of a service. Rich Indexes [11] on the other hand consider only certain aspects of the information contained in the original data.
The service descriptions include different features of services as discussed in the following:
– Domain Information: Information about the service registration and other attributes such as domain, cluster group, back-links, and listings.
– Semantic Descriptions: Where service descriptions are enriched with seman-tic content such as those in WSMO and OWL-S.
– Functional Descriptions: Include interface information such as input and output parameters, preconditions and effects [7].
– QoS Descriptions: Include information about the performance of a service, specifying requirements such as bandwidth, response time and delay. We propose using multiple indexes based on different features of a service description (i.e. profile, functional descriptions, etc.). This approach enables us to compare services over different domains; however in the context of service clustering Platzer et al. [11] recommend not to merge information from two seperate indexing strategies into one vector. In this case the components of the vector are likely to move apart from each other and result in reducing the effectiveness of the clustering algorithm.
Vector Space Modelling is a very useful method for analysing service descrip-tions. Once service descriptions are represented in vectors, vector algebra [11] and probabilistic methods [8] can be used to measure similarities between ser-vices and group them into clusters.
2.3 Proximity Measure
Measuring the proximity between a service and other services in a dataset is the basic step of most clustering techniques. If two vectors are close to each other in vector space, then they have similar service descriptions or functional attributes depending on characteristics used for constructing the model. Various techniques exist to measure the proximity of two vectors. The most commonly used proximity measures are described in the following.
Euclidean Distance The Euclidean Distance of two n-dimensional vectors corresponds to the actual distance between the absolute position of the two points in vector space described by the two vectors. The Euclidean distance can be calculated using the following formula.
dis(p, q) =kp−qk 2= v u u tXn i=1 (pi−qi)2 (3)
where p and q are the two vectors and dis(p, q) is the Euclidean distance between them.
Jaccard Coefficient The Jaccard coefficient is a similarity measure that skips the components which give no information. Nayak and Lee [10] use the Jaccard coefficient to measure the similarity between two Web services based on the
terms that are present in both service descriptions. The Jaccard coefficient of two vectorsp andq is given by the equation 4.
J(p, q) = Tpq
Tp+Tq+Tpq (4)
where Tpq is the number of common terms used in describing p and q, Tp andTq are the number of terms used inponly andq only respectively.
Multidimensional Angle Multidimensional Angle is an efficient measure of the proximity of two vectors. It is used in various clustering approaches [11, 8]. This proximity measure applies cosine of the angle between two vectors. It reaches from the origin rather than the distance between the absolute position of the two points in vector space. This method is more efficient because if a dimension is not present in both vectors it will automatically drop out of the equation. Thus it provides dimensional reduction and reduces required compu-tations. The multidimensional angle between vectorsp andq can be calculated using equation 5. cos(p, q) = p·q kpk · kqk = Pn i=1piqi pPn i=1p2i Pn i=1q2i (5)
wherenis the number of dimensions.
Weighted Similarity Measures This method is used by Nayak and Lee in [10] where the similarity of two services is based on different parts of their service descriptions. Each service description is enhanced with semantic components:
OWL-S Profile, Model,andGrounding, and a WSDLdocument. TheWeighted
Similarity of two services is then calculated by summing together theJaccard coefficient of each component where every Jaccard coefficient of the summation is multiplied by a weight which reflects how significant that component is. This proximity measure is given by:
Sim(p, q) =w1·JDes(p, q) +w2·JSerP(p, q) +w3·JW SDL(p, q)
+w4·JP M odel(p, q) +w5·JGround(p, q)
(6)
wherew1tow5are the assigned weights andJDes(p, q),JSerP(p, q),JW SDL(p, q),
JP M odel(p, q), and JGround(p, q) are the Jaccard coeffiecient of the service de-scription, service profile, WSDL, service model, and service grounding respec-tively.
2.4 Clustering Algorithms
Clustering algorithms generally deal with data described in vector space by us-ing some form of vector algebra to measure the similarity between vectors and grouping together the vectors which are most similar to each other. The following describes some of the common approaches for clustering.
K-Means Algorithm The K-Means algorithm is a well know clustering al-gorithm based on Squared Error criterion [12]. Squared Error algorithms keep converging until a convergence criterion is reached. The steps for implementing the K-Means algorithm as given in [6] are:
1. Randomly generate K cluster centres within the vector space used.
2. Compute the proximity of each vector to each cluster centre and assign each vector to the nearest cluster centre.
3. Recompute the cluster centres by taking the mean of the member vectors in each cluster.
4. If the convergence criterion is not met, go back to step 2.
A typical convergence criterion would be a treshold value of a squared error equation [12] or converging until there is no or minimal change in cluster centres after each iteration [6].
Agglomerative Algorithm The Agglomerative algorithm is a bottom-up hi-erarchical clustering method. The algorithm starts by assigning each vector to its own cluster; then it starts merging together the most similar clusters at every iteration until a stopping criterion is met [6]. The steps for implementing the Agglomerative algorithm are:
1. Treat each vector as a cluster.
2. Compute a matrix with the proximity of each cluster to every other cluster. 3. Find the most two similar cluster in the matrix and merge these two clusters
into one cluster.
4. Update the proximity matrix with the mean of the two merged clusters as the centre of the new cluster.
5. Stop if the proximity treshold is reached or if all the vectors are converged into one cluster. Otherwise go back to step 2.
A Web Service clustering approach based on this algorithm is proposed in [11]. This work uses a repository of 275 WSDL service descriptions. Each WSDL document is treated as a text document and the whole text is converted into vector space then clustered using the Agglomerative algorithm. The per-formance evaluation provided is based on data extrapolation to evaluate scala-bility of the method in larger repositories. The algorithm discusses efficiency of matching a client’s query compared to a simple key word matching. However, the WSDL documents include serveral repetitive phrases and also specific ter-minology to describe technical aspects of services. Analysing WSDL as a text document and constructing the model based on the whole concept set extracted from the WSDL description could suffer from biasing and overfitting the results.
2.5 Probabilistic Latent Semantic Analysis (PLSA)
Probabilistic Latent Semantic Analysis is an unsupervised machine-learning tech-nique used to map high-dimensional count vectors (such as the ones yielded by TF/IDF in vector space model) to a lower dimensional representation inLatent Semantic Space [4]. PLSA is based on the Aspect Model; a latent variable model which associates an unobserved class variable zf²Z ={z1, z2, ..., zk} with each
observation [5].
PLSA discovers the semantics behind the words in a text corpus, i.e. the topics which the words in the document belong to. Words are observable variables
wj²W = {w1, w2, ..., wv} which can be observed through the text corpus that
consists of documents, topics on the other hand are latent variable which are not directly observable through the text.
In service descriptions, we use words taken from service descriptions and cre-ate a PLSA model. Once the lcre-atent variableszf²Z ={z1, z2, ..., zk} are
identi-fied, services can be described as a multinomial probability distributionP(zf|di) wheredi is the service description (or document) describing servicei. The repre-sentation of a service with these latent variables reflects the likelihood that the service belongs to certain concept groups [8].
To construct a PLSA model we first require to look at the joint proability of an observed pair. The joint probability of an observed pairP(di, wj) is given by: P(di, wj) =P(di)P(wj|di) (7) where: P(wj|di) =P(di)P(wj|di) k X f=1 P(zf|di)P(wj|zf) (8)
assuming that a document and a word are conditionally independent given the latent factor.
This model indirectly associates the wordswj²W ={w1, w2, ..., wv} to their
corresponding documents by introducing an intermediate layer of latent factors
zf²Z={z1, z2, ..., zk}. Thus we are getting dimensionality reduction by mapping a high word-document matrixP(d, w) into a lowerk-dimension latent semantic space [8]. By substituting equation 8 in equation 7, we obtain:
P(d, w) = k
X
f=1
P(zf)P(d|zf)P(w|zf) (9)
The parametersP(z),P(d|z), andP(w|z) can be found using a model fitting technique such as the Expectation Maximization (EM) algorithm as described in [4]. Once the algorithm is trained and the parameters are found, any new document can be folded into the model [8] using:
P(zf|dnew) = PP(dknew|zf)·P(zf) j=1P(dnew|zj)
(10) In our work, service descriptions are treated as documents and these textual and functional descriptions are used to construct the PLSA model. The details of the approach is discussed in Section 3.
2.6 Latent Dirichlet Allocation (LDA)
Latent Dirichlet Allocation is another machine-learning technique which uses a generative probabilistic model for collections of discrete data [1]. LDA intro-duces a Dirichlet prior on the document-topic distribution in order to simplify the problem of statistical inference [16]. The principal of LDA is the same as that of PLSA: mapping high-dimensional count vectors to a lower dimensional representation in latent semantic space.
Using the same notation described in PLSA, with LDA the probability of the
ith word occuring in a given document is:
P(wi) = k
X
f=1
P(wi|zi=f)P(zi=f) (11)
where zi is a latent factor (or topic) from which the ith word was drawn,
P(zi=f) is the probability of topicf being the topic from whichwiwas drawn, andP(wi|zi=f) is the probability of having wordwi given thefth topic.
The generative model of LDA is obtained by letting:
Φ(j)=P(w|z=f) (12)
and
Θ(d)=P(z) (13)
Instead of estimating P(d|z) andP(w|z) as in PLSA, the LDA generative model estimatesΦ, Θ, andz. Different methods can be used to train the algo-rithm and estimate these parameters Bleiet al.[1] use variational inference with EM algorithm. Wanget al. [16] use a method based on Gibbs Sampling which was proposed in [3] and [15].
3
A Probabilistic Approach for Service Clustering
Classical service clustering algorithms use proximity measures to calculate the similarity between services and group similar services together. Our approach applies probabilistic machine-learning techniques to extract latent-factors from service descriptions and then uses the latent-factors to group the services into clusters. This approach gives us a number of advantages over classical clustering
algorithms. First, the dimensionality of the model is reduced as every service can be described in terms of a small number of latent factors rather than a large number of concepts. Consequently, searching for a service inside a cluster can be performed by searching for matching latent factors rather than matching the text describing the service to a set of key words extracted from the user query. Second, the algorithm is scalable and can be applied to large repositories because only a small portion of the data set is required to train the algorithm. The rest of the service descriptions and any other new service published to the repository can be folded-in and assigned to a cluster very easily without high computational requirements.
We use OWL-S as the basis of our model and all the service descriptions pub-lished to the repository are in OWL-S format. OWL-S provides rich machine-readable semantics which make it easier to define the different components of a service that facilitate the feature extraction stage for vector space modelling. The rich semantics of OWL-S make it also possible to implement logic based tech-niques for service matching and ranking; however the use of such techtech-niques is beyond the scope of the current paper. In the current work, we focus on the tex-tual descriptions and the functional descriptions contained in an OWL-S service representations. The two categories of features (i.e. service profile and service model) are extracted separately and stored in separate vector space models.
The OWL-S service profile contains a textual description of service opera-tions. These textual descriptions together with the title of the service are ex-tracted and used to build the vector space model. All punctuation marks are removed from the text and words merged together with a capital letter in be-tween such as “TaxCalculator“ are separated back to two different words. For example, “TaxCalculator“ becomes “‘tax calculator“. The Stanford POS Tagger is then used to eliminate all the stop-words and only words tagged as nouns, verbs, and adjectives are retained. Once the text is processed, the vector space model describing each service as a vector of word frequencies is calculated using the TF/IDF give in equation 1.
The funtional descriptions in OWL-S consist of the propertieshasInput, ha-sOutput, hasParameter, hasPrecondition, and hasResult found in the service model. The service model points to a process which in turn defines the WSDL message-map types needed to interact with the service. All these features are ex-tracted from the OWL-S descriptions using a reasoner. In order to make the fea-tures fit in the vector space model, the property name and the type are appended together to produce a new term that is used as a ’word’ in constructing the vec-tor space model. For example “hasInput Book“ becomes “hasInput Book“. This way, a service in which Book is defined as input will be distinguished from a service in which Book is defined as output. TF/IDF is then used to analyse constructed ’words’ to create the vector space model for functional attributes.
PLSA is implemented using the PennAspect8 model which uses maximum
likelihood to compute the three parameters:P(w|z),P(d|z), andP(z). Half of the the dataset is used to train the algorithm and the other half is used for val-8 http://www.cis.upenn.edu/ ungar/Datamining/software dist/PennAspect/index.html
idation in order to prevent overfitting [16]. Once the parameters are calculated, new services published to the repository can be folded-in as proposed in [8] by using the following.
P(zf|dnew) =PP(kdnew|zf)·P(z) j=1P(dnew|zj)
= P(dnew|Pkw)·P(w|zf)·P(z)
j=1P(dnew|zj)
(14)
This equation can be computed for each latent factorzf²Z ={z1, z2, ..., zk}
with respect to every new service dnew thus obtaining the probability of dnew being described by each of the latent variablesP(z|dnew). The servicednewcan be assigned to latent factor zf having the highest probability given a service
dnew [8] thus efficiently clustering each service.
We have implemented the LDA model using LingPipe9toolkit for processing
text. This toolkit uses Gibbs sampling to train the algorithm and to obtain the parameterP(d|z). After training the algorithm, new services can be folded in by using Gibbs sampling with fixed topic-word probabilities and sampling the assignments of words to topics in the new service [16].
4
Evaluation of Clusters
The Purity of clusters is used as a measure of evaluating the accuracy of a clus-tering technique [9], [8]. If the pool of services used to evaluate the algorithm were originally organised in a set of classes c = {c1, c2, ..., im}, then for
clus-ters generated by the algorithm z = {z1, z2, ..., zk} the purity of a clustering algorithm can be computed as:
P urity= 1 n k X f=1 maxc © nc f ª (15)
wheren is the total number of services and nc
f is the number of services in clusterzf belonging to classc whilecvaries from 1 to m.
It is easy to obtain a high value of cluster purity if the data set is clustered into a large number of clusters. If each cluster is very small, the likelihood of having a high percentage of the cluster belonging to one known class could be very high (especially in very short documents like service descriptions). Therefore in order for the purity measurement to give a more accurate result, the number of clusters generated should not be very big compared to the size of the dataset.
5
Results
In our experiment, we compared the accuracy of two probabilistic clustering algorithms (PLSA and LDA) to that of two proximity measure based algorithms.
The dataset of service descriptions used in this experiment was obtained from the OWL-S service retrieval test collection, OWLS-TC10. This dataset consists
of 1007 service descriptions defined in OWL-S form. Each service belongs to one out of seven service categories named as: communication, economy, education, food, medical, travel, and military. These categories are used as the base classes to evaluate Purity of clusters after the clustering algorithms are tested.
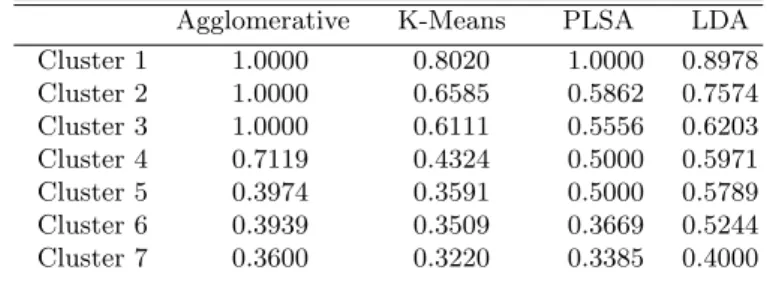
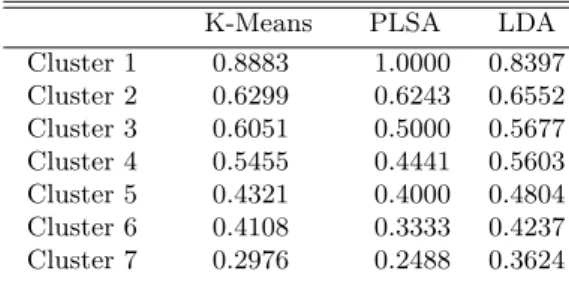
Two experiments were conducted: one using only the OWL-S attributes con-taining textual descriptions of the services, and another using only the OWL-S attributes describing functional attributes. Agglomerative and a K-Means clus-tering algorithm were also used to compare the performance of PLSA and LDA to proximity based clustering. The dataset was clustered with each algorithm starting with five clusters and increasing in steps of five up to fifty clusters. The Purity of clusters was computed for each algorithm at every step and the results were compared. The purity of the individual clusters for clustering the data set in seven clusters (same as the number of known classes) are shown in Table 2 and Table 3.
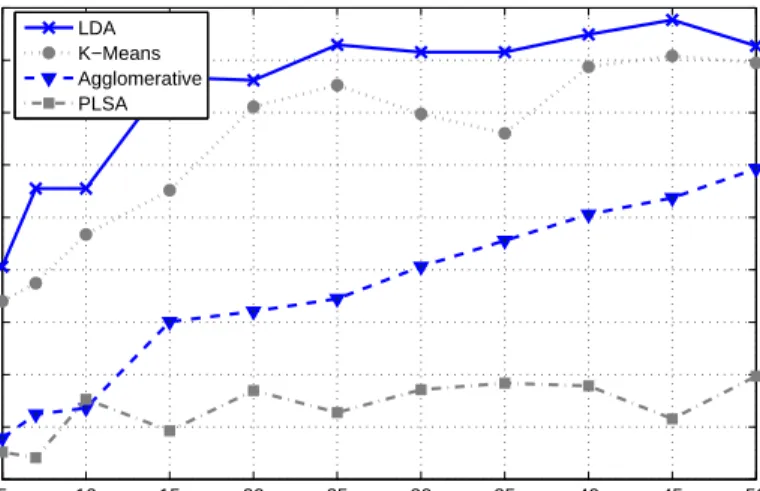
The results show that overall purity varies against number of clusters while using textual descriptions from service profile. The results of clustering based on profile descriptions are shown in Figure 3. The results for clustering based on functional attributes are also shown in Figure 4. The Agglomerative algorithm could not be used to cluster functional attributes because the dimensions of the vectors describing functional attributes are smaller than those describing textual data and consequently the algorithm could not converge to less than 65 clusters.
Table 2.Purity of clusters for 7 clusters based on Profile Descriptions. Agglomerative K-Means PLSA LDA Cluster 1 1.0000 0.8020 1.0000 0.8978 Cluster 2 1.0000 0.6585 0.5862 0.7574 Cluster 3 1.0000 0.6111 0.5556 0.6203 Cluster 4 0.7119 0.4324 0.5000 0.5971 Cluster 5 0.3974 0.3591 0.5000 0.5789 Cluster 6 0.3939 0.3509 0.3669 0.5244 Cluster 7 0.3600 0.3220 0.3385 0.4000 5.1 Discussion
The results show that LDA performs significantly better than PLSA. LDA also takes relatively less time than all the other algorithms to train and create the clusters. The Agglomerative and K-Means algorithm both perform better than PLSA. The K-means algorithm depends on the random factor of where the initial cluster centroids are generated and does not always converge in an optimal 10http://www.semwebcentral.org/projects/owls-tc/
5 10 15 20 25 30 35 40 45 50 0.35 0.4 0.45 0.5 0.55 0.6 0.65 0.7 0.75 0.8 No. of Clusters Purity LDA K−Means Agglomerative PLSA
Fig. 3.Purity of clusters for clustering based on Profile Descriptions of the Services.
5 10 15 20 25 30 35 40 45 50 0.35 0.4 0.45 0.5 0.55 0.6 0.65 0.7 0.75 0.8 0.85 No. of Clusters Purity LDA K−Means PLSA
Fig. 4. Purity of clusters for clustering based on the Functional Attributes of the Services.
Table 3.Purity of clusters for 7 clusters based on Functional Attributes.
K-Means PLSA LDA
Cluster 1 0.8883 1.0000 0.8397 Cluster 2 0.6299 0.6243 0.6552 Cluster 3 0.6051 0.5000 0.5677 Cluster 4 0.5455 0.4441 0.5603 Cluster 5 0.4321 0.4000 0.4804 Cluster 6 0.4108 0.3333 0.4237 Cluster 7 0.2976 0.2488 0.3624
way. K-means algorithm is also very slow and computationally expensive; this makes it unsuitable for large repositories. As it can be seen from Figure3 and Figure 4, LDA performs better than the other algorithms. This makes it an ideal solution for clustering services in large repositories. The low purity results for PLSA are due to limited number of concepts used for training the model. Service description are similar to short documents in this context. Thus PLSA is not able to converge to a high accuracy using these limited concepts. Extracting latent factors from a corpus of service descriptions also gives us the basis to construct more efficient service discovery and ranking mechanisms.
An important aspect of this work, also based on OWL-S design, are the semantics. Although in the current work we treat all the descriptions and at-tributes as text, semantic relations can be exploited to enhance the discovery and recommendation result based on the constructed clusters. Some of these aspects are described in future work in Section 6.
6
Conclusions and Future Work
This paper proposes a probabilistic method to create two seperate clustering schemes; one based on profile descriptions of the services and the other based on the functional attributes. This enables to search services based on classic text queries and/or using more specific functional queries. The latter can be very useful for service personalisation and service composition where the functional attributes of the services are of great importance.
Future work will focus on developing a query mechanism based on latent factors rather than matching key words in a query to the service descriptions’ text. This kind of service clustering also makes it easier to recommend services since similar services are grouped in the same cluster. It is important to note that although this work was focused on OWL-S service descriptions, our approach can be applied to other service description models such as WSMO and this will also be investigated in future work. The probabilistic methods used in this paper (i.e. LDA and PLSA) can be trained using a small percentage of the whole dataset, the rest of the service descriptions can be folded into the model as described in Section 3. This makes both algorithms very scalable to large service repositories. The semantics of service descriptions will be also used for further enhancement
of clustering results. The reasoning mechanisms will be also incorporated in the recommendation and discovery methods to provide more relevant results to service consumers.
Acknowledgment
This paper describes work undertaken in the context of the m:Ciudad project, m:Ciudad - A metropolis of ubiquitous services (http://www.mciudad-fp7.org/). m:Ciudad is a medium-scale focused research project supported by the European 7th Framework Programme, contract number: 215007. The authors would like to thank Dr. Wei Wang from the University of Nottingham Malaysia Campus for his comments and sugesstions regarding probablistic models.
References
1. Blei, D.M., Ng, A.Y., Jordan, M.I.: Latent dirichlet allocation. J. Mach. Learn. Res. 3, 993–1022 (2003)
2. Charlton, P., Ribiere, M.: Rich service description for a smarter lifestyle. In: AA-MAS ’03: Proceedings of the second international joint conference on Autonomous agents and multiagent systems. pp. 512–519. ACM, New York, NY, USA (2003) 3. Griffiths, T.L., Steyvers, M.: Finding scientific topics. Proceedings of the National
Academy of Sciences 101(Suppl. 1), 5228–5235 (April 2004)
4. Hofmann, T.: Probabilistic latent semantic analysis. In: Proc. of Uncertainty in Artificial Intelligence, UAI99. pp. 289–296 (1999)
5. Hofmann, T., Puzicha, J., Jordan, M.I.: Learning from dyadic data. In: Proceedings of the 1998 conference on Advances in neural information processing systems II. pp. 466–472. MIT Press, Cambridge, MA, USA (1999)
6. Jain, A.K., Murty, M.N., Flynn, P.J.: Data clustering: a review. ACM Comput. Surv. 31(3), 264–323 (1999)
7. Liu, C., Peng, Y., Chen, J.: Web services description ontology-based service dis-covery model. In: WI ’06: Proceedings of the 2006 IEEE/WIC/ACM International Conference on Web Intelligence. pp. 633–636. IEEE Computer Society, Washing-ton, DC, USA (2006)
8. Ma, J., Zhang, Y., He, J.: Efficiently finding web services using a clustering seman-tic approach. In: CSSSIA ’08: Proceedings of the 2008 international workshop on Context enabled source and service selection, integration and adaptation. pp. 1–8. ACM, New York, NY, USA (2008)
9. Mandhani, B., Joshi, S., Kummamuru, K.: A matrix density based algorithm to hierarchically co-cluster documents and words. In: WWW ’03: Proceedings of the 12th international conference on World Wide Web. pp. 511–518. ACM, New York, NY, USA (2003)
10. Nayak, R., Lee, B.: Web service discovery with additional semantics and clustering. In: WI ’07: Proceedings of the IEEE/WIC/ACM International Conference on Web Intelligence. pp. 555–558. IEEE Computer Society, Washington, DC, USA (2007) 11. Platzer, C., Rosenberg, F., Dustdar, S.: Web service clustering using
multidimen-sional angles as proximity measures. ACM Trans. Internet Technol. 9(3), 1–26 (2009)
12. Rui, X., Wunsch, D.: Survey of clustering algorithms. IEEE Transactions on Neural Networks 16(3), 645–678 (2005)
13. Salton, G.: Automatic text processing: the transformation, analysis, and retrieval of information by computer. Addison-Wesley Longman Publishing Co., Inc., Boston, MA, USA (1989)
14. Segev, A., Toch, E.: Context-based matching and ranking of web services for com-position. IEEE Transactions on Services Computing 99(PrePrints), 210–222 (2009) 15. Steyvers, M., Griffiths, T.: Latent Semantic Analysis: A Road to Meaning, chap.
Probabilistic topic models. Laurence Erlbaum (2007)
16. Wei, W., Barnaghi, P., Bargiela, A.: Probabilistic topic models for learning termi-nological ontologies. IEEE Transactions on Knowledge and Data Engineering 22, 1028–1040 (2010)