http://dx.doi.org/10.33851/JMIS.2019.6.3.155
155
I. OBJECTIVES
Microwave attenuation by tree foliage should have a strong link to water content in leaves. Using a network analyzer, we sampled natural broadleaves, including Japanese cinnamon, and investigated their effects on microwave (3-20 GHz) frequency characteristics. Microwave attenuation is proportional to the amount of water held within leaves. Light energy reacts with water and carbon dioxide to synthesize oxygen and sugar inside the leaf (photosynthesis). Thus, leaf water content is a parameter of the leaf’s capacity to absorb carbon dioxide. The technical developments described here will enable the visual representation of plant health.
II. BACKGROUND
2.1. Leaf structure
The leaf of a broadleaf tree generally consists of two structures: the palisade mesophyll and the spongy mesophyll. The spongy mesophyll tends to be replete with moisture and helps produce oxygen from carbon dioxide and water in response to sunlight through the chemical reaction of the leaf known as photosynthesis. To evaluate
carbon dioxide consumption, it is important to measure the amount of leaf moisture. Reducing airborne carbon dioxide has emerged as a worldwide issue. We can predict, based on certain measurements, how effective trees will be in absorbing airborne carbon dioxide. The extent to which carbon dioxide is converted into oxygen is determined by the average amount of moisture in the leaf and the number of daylight hours. Figure 1 gives the chemical formula for photosynthesis.
Fig. 1. Structure of leaf.
Developing a Scanner for Assessing Foliage Moisture
Isao Nakajima
1,*, Futoshi Ohyama
2, Hiroshi Juzoji
3, Masuhisa Ta
4Abstract
We intended to confirm that microwave attenuation by tree leaves is strongly linked to water content in leaves. We sampled natural broadleaves, including Japanese cinnamon, and investigated their effects on the microwave (3 to 20 GHz) frequency characteristics using a network analyzer. Experiments determined that microwave attenuation by foliage increases as a linear function of frequency per unit weight (gram). As the frequency increases, the spatial resolution increases, but the phase difference (imaginary component) increases. So we solved the dispersion of phase difference by sweeping the frequency and taking the intermediate value. Based on these experimental results, we developed a microwave scanner on 10Ghz to describe foliage moisture as a image and to enable assessments of leaf condition. Photosynthesis is the process whereby plants synthesize oxygen and sugars from carbon dioxide and water, thereby converting light energy into chemical energy. Since water is a major parameter of photosynthesis, the quantity of water accumulated inside a leaf reflects leaf health. The equipment described here and related microwave technologies will help assess the capacity of leaves to absorb atmospheric carbon dioxide.
Key words: Carbon dioxide absorption, Leaf, Water attenuation.
Manuscript received July 30, 2019; Revised August 20, 2019; Accepted September 04, 2019. (ID No. JMIS-19M-07-024) Corresponding Author (*): Isao Nakajima, Shimokasuya 143, Isehara City, Japan, +81-463-91-3130, Email: [email protected] 1 Nakajima Lab. Tokai University School of Medicine, Isehara City, Japan. Email: [email protected].
2 Tokai University School of Medicine Faculty of Nursing, Isehara City, Japan. Email: [email protected].
3 EFL Inc. Takaoka City, Japan. Email: [email protected].
156
III. EXPERIMENTS
3.1. Basic analysis with microwaves
In the experiment, there are two different distances between the transmitter and the receiver: near-field propagation and far-field propagation.
A. Near-field propagation
Given our preference to deploy two transducers face to face at a short distance across the leaf, we will discuss the near-field propagation of electromagnetic waves. The quantitative definition requires use of Maxwell's equations to calculate that electromagnetic waves are generated when an electric charge accelerates, a complex process for which a simplification is provided here. An overview is provided below.
Calculations of the magnitude of the electromagnetic field, assuming that the distance from the radiation source is r, produces a term proportional to 1/r, 1/r^2 , 1/r^3 (each term representing a radiation field), and 1/r^2: an induction field (a component according to Biot-Savart's law), 1/r^3: a Quasi-electrostatic field (referred to as an electric field by a dipole). In the far field (where r is large), the term proportional to 1/r^2 and 1/r^3 approaches zero more rapidly than the term proportional to 1/r, leaving only the term of 1/r.
Calculating the boundary of the near field and far field gives the value λ/2π (where λ is the wavelength of an electromagnetic wave). Specifically, at 2.5 GHz, a distance of 19 mm or less is close. Waves in the vicinity can be approximated by J1 of the Bessel function (left of Figure 2 and equation 1).
Fig. 2. Bessel functions (left). Under scatter propagation environment, spatial separation of a signal is affected by the influence of similar figures of the sinc function (right).
(1)
B. Far-field propagation
The far field becomes equal to 1/r. As the term proportional to 1/r^2(a component according to Biot-Savart's law and 1/r^3(a component according to Quasi-electrostatic field due to dipoles) becomes zero, the term proportional is equal to 1/r.
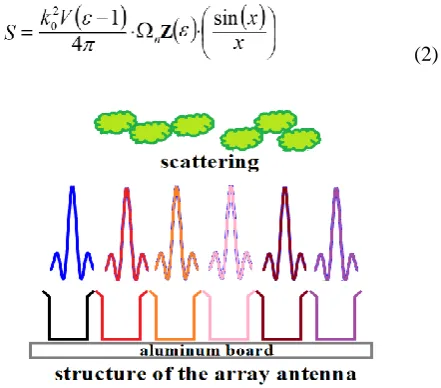
The wave at the far field can be approximated by Equation 2 and by Figure 3. Since x in Equation 2 is an angle(a phase), interference is given to the adjacent space. That is to say, a received power will be non-linear due to influence from neighboring channels by leaves(scatter phenomenon, Figure 3).
This implies that the adjacent horns have less interference when angles are wider than when they are closer than the distant signal source. In other words, a horn antenna should be near the target tree; otherwise, the interference of the adjacent waves will be relatively strong (right of Figures 2, and Figure 3, Equation 2). Qualitatively, the near field is an area where the wavefront needs to be regarded as a spherical surface, while the far field is an area where the wavefront may be regarded as a plane. The impedance of the wave in the free space is 377 Ω.
(2)
Fig. 3. Each horn antenna received interference from adjoining signals, scatter phenomenon.
3.2. Electromagnetic penetration
The electromagnetic penetration is infinite in a perfectly transparent substance and zero in a reflective material (for example, metals).
Attenuation is obtained as follows:
http://dx.doi.org/10.33851/JMIS.2019.6.3.155
157 (4)
Equation 4 shows that attenuation increases in inverse proportion to wavelength and increases linearly with frequency.
3.3. Split cylinder
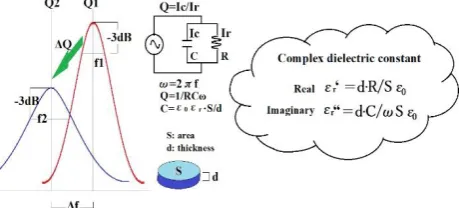
Sandwiching leaves between two transducers, as shown in Figure 4, we measured S, C, and X band power attenuation and S parameters. This configuration is referred to as a split cylinder. Due to the relative permittivity of the leaves, the resonance frequency, Q value, and half-value band differ before and after insertion. Figure 5 illustrates these relationships.
Equation 5 gives the approximate dielectric constant of water. In our experiment, room temperature was set to about 20 degrees (dielectric constant of water at 20 degrees: 80.36).
(5)
Since components other than water differ slightly depending on the type of leaf, frequency characteristics (especially the slope of the linear function) differ.
Fig. 4. Overview of near-field experiments with split cylinders.
Fig. 5. The resonance frequency, Q value, and half-value band (frequency band 3 dB lower than the peak) differ before and after the insertion of the leaf.
In this measurement, we keep the stem immersed in water until measurement to keep leaves from drying, while at the same time taking steps to ensure the leaves did not contain excess water. We used only the leaf center for measurement. Since this split cylinder pinches the leaves, it is not necessary to cut the leaves from the trunk. The leaves were irradiated with microwaves from the top face (forward direction).
To investigate changes in attenuation, we changed the number of leaves and measured frequency with 1, 2, 3, 4, 5, 10, and 15 leaves. Ten days later, we repeated these measurements to determine changes (if any) in water content and attenuation.
3.4. Instruments used in basic experiments
To measure attenuation by leaves, we used a network
analyzer (ADVANTEST R3767BG NETWORK
ANALYZER [300 kHz-8 GHz]). Since the 8-20 GHz region was not covered by this network analyzer, we also used a signal generator (ROHDE&SCHWARZ SMR-20), delay line (linear phase shifter), and a spectrum analyzer [ADVANTEST R3273 up to 26 GHz].
We connected two opposing transducers for each of the tests (S, C, and X bands) with microwaves directed using a waveguide. Attenuation and S parameters were measured by inserting broadleaves into the gap between the two transducers. The system for securing the split cylinder (manufactured by Tasada Works Inc.) was vertically adjustable to allow fine control of gap width.
3.5. Leaves
The leaves tested were taken from Ligustrum japonicum, Cinnamomum camphora, and Ligustrum iucidum. They were all taken directly from the field in the form of branches bearing leaves and measured immediately after field sampling.
3.6. Experimental results
158 Fig. 6. Leaf quantity and attenuation.
Figure 6 shows attenuation increases linearly as the number of leaves increases, suggesting that microwave attenuation at 7.75 GHz increases linearly with water content.
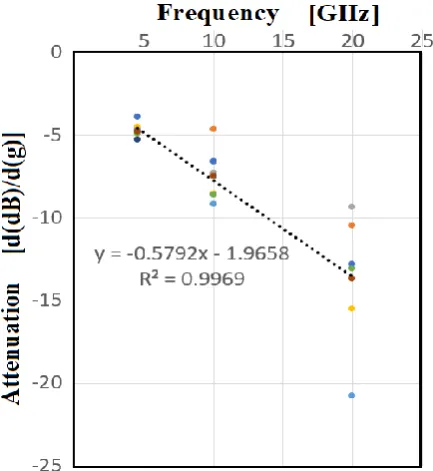
Figure 7 shows the correlation between frequency and attenuation. Although the data in Figure 7 features variations, the average value of each frequency exhibits a linear relationship. Specifically, single leaves are used to assess the fresh state and a slightly dried state. This indicates that attenuation per unit gram is a linear function of frequency, consistent with Equation 4. Table 1 presents the function and correlation coefficient indicating linearity for each plant species.
Although 20 GHz is considered to provide high resolution due to its short wavelength, the phase is unstable. The average of these values is consistent with the prediction formula, but, as Figure 7 indicates, it cannot be put to practical use.
Fig. 7. Frequency and attenuation by d(dB)/d(weight) Celtis sinensis.
Table 1. Relationship between plants species and prediction formula.
Plant Slope factor R2
Cinnamomum camphora -0.33 0.89
Ligustrum japonicum -0.31 0.92
Hydrangea macrophylla -0.45 0.99
Prunus ×yedoensis -0.15 0.95
Meratia praecox -0.25 0.71
IV. DEVELOPMENT
4.1. The scanner hardware
Figure 8 is a block diagram of the prototyped scanner. This device features 40 superheterodyne receivers at 10.5 GHz to detect non-modulated (continuous carrier with sweeping the frequency 300MHz) signals from transmitters located 5-30 meters distant. Since 40 units share two local oscillators, they are all in phase. Here, without the phase difference, the attenuation of the amplitude is obtained by RF detectors with a log amplifier. Figure 9 gives the circuit diagram of the main board. As a reference before an experiment, a signal is received in free space without obstacles in order to set the signal level at zero. In parallel, references with 40 logarithmic detectors are performed with a spectrum analyzer. Each error is managed by the CPU as a quick lookup table.
Figure 10 illustrates the relationship between detector input levels and output voltage. As this figure shows, the range from -55 to -5 dBm gives a strong linear dynamic range of 50 dB. We adjusted the transmitter output level and used this linear part.
The elements of the 8-channel 12-bit A/D converter are connected to the CPU by I2C at five elements (8 x 5 = 40 channels) and integrated for 3 seconds at one sweep (Bw:300 MHz) to obtain maximum and minimum values. The A/D sampling frequency was 1,000/sec/ch. The average value of the maximum and minimum will be attenuation scalar value (j part = 0; details to be explained in item 4.2).
Including the time required for the physical movement of the horn and the integration time of 3 seconds, the time required to render a single raster is 5 seconds. It takes 250 seconds to scan one sheet (40 x 50 pixels).
http://dx.doi.org/10.33851/JMIS.2019.6.3.155
159 Fig. 9. Circuit diagram for 2nd mixer, filter, IF amp, and detector.
Fig. 10. Relationship between input level to the detector and output voltage. This figure shows strong linearity in dynamic range of 50 dB from -55 to -5 dBm.
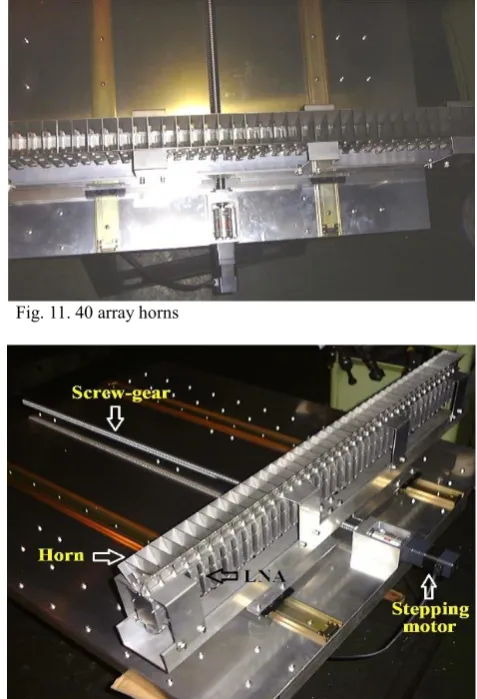
The dimensions of the scanner are 100 cm x 101 cm; the back aluminum plate size is 100 cm x 120 cm, and the sensor can be up to 40 horizontally and up to 100 in the vertical direction (moving in 1 cm steps). The scanner has a standard image quality of 40 x 50 steps and a fine 40 x 100 steps of matrix (Figure 11, 12).
Using a horn antenna provides a gain of 10 dBi (Figure 13). The sensor must be placed as close as possible to the object to obtain the necessary resolution. Using a horn antenna with higher gain suppresses interference from adjacent channels, however, the question arises: Are the beams parallel. Since such physical issues can arise, a gain of 10 dBi may be appropriate at the production stage.
Another solution is to use a higher frequency to sharpen the beam. Here, the dilemma is that a broad dynamic range is needed due to the significant attenuation by the leaves. Based on these conditions, we selected 10.5 GHz.
Fig. 11. 40 array horns
Fig. 12. Spatial relationship of the various parts (40 array horns and LNAs, stepping motor, screw-gear).
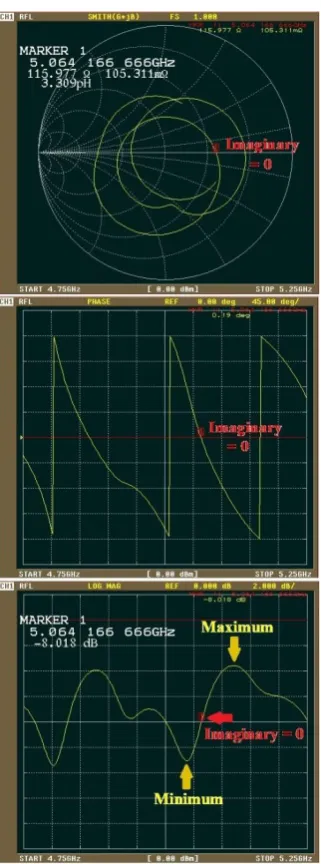
160 Fig. 14. Approximation of scalar value of receiving power
travelling through free space. The upper part is the Smith chart, the middle part is the phase (the Y axis represents the imaginary component and X axis frequency), the lower part is the scalar value of received power, while X axis is frequency. The red marks are the phase = j0.
4.2. Approximation for implementation
There are several methods for removing the phase part of a signal traveling in free space to assess the power of the receiving signal. It is sufficient to read the signal strength, when the phase part becomes zero. In the Smith chart, if impedance were changed concentrically around Z = 50 + j0 normalized, it would be an intermediate value between the maximum value and the minimum value. In fact, since the image is not rotated concentrically (50 + j0) as shown in Figure 14, a certain degree of error can be approximated in this method. The gradation of the image is a comparison of relative values; if all pixels have the same bias, they cancel out and can be disregarded.
The phase is shifted by inserting a delay line or slowly drifting the frequency of the transmitter. Since the sources are only about 30 m apart obtaining local oscillation frequency with coaxial cable (sweep frequency bandwidth 300 MHz), it is possible to modulate a drifting frequency to the second OSC of the receiver.
4.3. Circuit design
Figure 15 shows free space propagation loss. Table 2 shows the circuit design for a distance of 30 m. The RF detection on the receiver side has a dynamic range about 50 dB, but transmission power must be controlled to avoid saturation and declines in noise level.
4.4. Software
In the software, the mechanical control, the value of 40 received power from the A/D converters, and these data are recorded for each raster. Finally, one set of measurement data is saved to an Excel csv file. Table 3 shows the image processing required to display one picture. These functions are provided as reference materials at the end of the paper.
4.5. How to use this scanner
The aluminum plate on the back of the scanner is large (1.2 m x 1 m) and heavy and not readily lifted. As shown in Figure 16, using a lifter, data is acquired on multiple planes (pages). The control of the lister can be controlled in 1 cm increments.
4.6. Scanning image
Shown to the right is a picture of the actual tree (Figure 17 left) and a picture drawn for each raster based on data obtained from attenuation through the leaves. Certainly, there is a multi-scatter equivalent to the Loo distribution, but integrated over time, the average value of the phase becomes zero, making it possible to visualize the amount of attenuation. However, the sharpness of the image does not correspond to the optical level, as interference from adjacent channels remains.
http://dx.doi.org/10.33851/JMIS.2019.6.3.155
161 Fig. 15. Free space propagation loss
Table 2. Circuit design of distance 30 M
Frequency (GHz) 10.50 Tx antenna gain (dB) 6.11 Output power (dBm) 0.00 EIRP (dBm) 6.11 Free space propagation loss (dB) 82.41 Polarization loss (dB) 1.00 Rx antenna gain (dB) 9.86 Receiving power (dBm) -67.44 Thermal noise (K) 700.00 Noise power density (dBm/Hz) -170.15 G/T (dB/K) -18.60 C/No (dB Hz) 102.71
Table 3. Image processing functions
Function
d_read Reads data from CSV file recording signal strength.
d_gradation Gradation (and color) is assigned for between the maximum and the
minimums of a received signal at 8 bits. _draw Draws an image page consisting of
40 columns and n lines.
_combine Combines multiple pages into a single Picture.
p_save Saves image in TIFF format.
Fig. 16. Using the foliage scanner.
Fig. 17. Result of field test by the foliage scanner, Zelkova.
V. DISCUSSION
5.1. Data analysis
As the number of leaves increases, total attenuation increases while attenuation per leaf decreases. We found no significant difference in attenuation per leaf for the different tree species.
This implies attenuation by leaves is not proportional to unit attenuation per leaf or number of leaves and that attenuation per leaf gradually declines as the number of leaves increases. This is probably because the surface resistance differs from the internal resistance in leaves. This difference may affect the S parameters as well.
162 Based on this data, we developed a foliage scanner for
the X-band to assess the status of leaves (Figure 5, 6, 7 ). With a very weak CW carrier from the transmitter in the X-band, 40 array antennas with a receiver can scan and analyze foliage attenuation. We believe this image is something like a chest X-ray image of a tree capable of observing water density in foliage.
5.2. Scientific predictions of carbon dioxide absorption Leaves perform photosynthesis to convert light energy into chemical energy, which is then stored in carbohydrate molecules, such as sugars, which are synthesized from the carbon dioxide in the air and the water in the leaves (Figure 1). Annual carbon dioxide absorption (trunk circumference ranging from 15 to 30 cm per tree ) is as follows:
1. Deciduous broad-leaved trees and pines: 100 kg
2. Evergreen broad-leaved tree, needle-leaf tree (other than pine): 66 kg
Leaves containing little water absorb significantly less carbon dioxide. That is, the amount of water contained in leaves is a parameter we can use to predict how much airborne carbon dioxide will be absorbed. Our scanner uses microwaves to assess the amount of water held in the leaves, resulting in a more precise reading of carbon dioxide absorption than the above-mentioned simple method.
Additionally, this foliage scanner can predict the growth of premium seedlings based on the amount of water in leaves or the quality of fruit for premium mangos. For advanced IoT-based agriculture, we believe this scanner will serve as an effective sensor in water management applications.
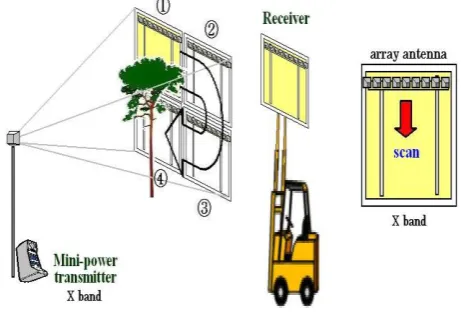
5.3. Future applications for search and rescue over foliage
C-band (3.875 GHz) and X-band (7.75 GHz) wavelengths are 7.7 cm and 3.9 cm, respectively. In general, radiowaves do not pass through objects; rather, they reflect off if the object is deeper than half the wavelength. Meanwhile, radiowaves penetrate objects thinner than 1/4 of the wavelength. If the object is approximately 1/2 the wavelength, both reflection and penetration occur. Thus, microwaves impinge upon trees, S-band waves pass through the leaves, then reflect off the trunks and ground; X-band waves reflect off leaf surfaces; and C-band waves reflect off both leaves and stems and trunks and the ground. Utilizing such property differences between the bands, we may apply SAR to various research efforts (Figure 18): We can collect geographic and geological data used to analyze the distribution of vegetation and the classification of tropical and boreal forests using the S-band, while vegetation pattern data on farmland and grass fields can be collected using the C- and X-band microwaves, taking advantage of differences in reflection intensity between
leaves and stems. Combining UWB radar technology and the C and X bands may make it possible to develop a helicopter-borne search and rescue radar system capable of finding humans lost in forests.
Fig. 18. UWB radar for location people lost in the woods.
VI. CONCLUSION
Microwave attenuation as a scalar quantity by trees foliage matches physical logic and measurement data and increases as a linear function of frequency and number of leaves. As the frequency increases, the spatial resolution increases, but the phase difference (imaginary component) increases. We solved the dispersion of phase difference by sweeping the frequency and taking the intermediate value.
We developed a microwave foliage scanner based on these basic technology and actual data. This technology is capable of estimating the water content of leaves, predicting the amount of carbon dioxide absorbed, and determining plant health.
Acknowledgements
This research was supported by the Telecommunications Advancement Organization (TAO, No. 401).
For their timely assistance, we would like to thank Prof. Kiyoshi Kurokawa of the National Graduate Institute for Policy Studies, Prof. Toshihiko Kitano, Dr. Nadia El Borai Yamamura, Ms. Yuko Namba, Mr. Toru Yuhki, Mr. Toshio Fujimoto, Mr. Koredianto Usman, Mr. Agus Subekti, Ms. Noriko Numata, Ms. Kimiko Kobayashi, and Ms. Miyoshi Tanaka at Nakajima Laboratory for analyzing voluminous field data. JSD (Japan System Design Ltd. Hiroshima City) provided guidance on the use of certain technologies and software related to the measurement devices.
REFERENCES
http://dx.doi.org/10.33851/JMIS.2019.6.3.155
163 aperture radar detection of objects obscured by foliage using the DSTO Ingara airborne imaging radar” IGARSS 2001. Scanning the Present and Resolving the Future. Proceedings. IEEE 2001 International Geoscience and Remote Sensing Symposium (Cat. No.01CH37217), July 2001
[2] Y. Huang, L. Ferro-Famil, A. Reigber,"Under-Foliage Object Imaging Using SAR Tomography and Polarimetric Spectral Estimators", IEEE Transactions on Geoscience and Remote Sensing, vol.50, no. 6, pp.2213-2225.
[3] I. Nakajima, K. Tsuda, H. Juzoji, M. Ta, ”A Nationwide Study on Optical Analysis for Expecting HEOs to Support Ambulances,” Journal of Multimedia Information System, vol. 6, no. 2, pp.107-118, Jun 2019.
[4] G. Sun, K. J. Ranson, “A three-dimensional radar backscatter model of forest canopies,” IEEE Transaction on Geoscience and Remote Sensing, vol. 33, no. 2, pp. 372-382, 1995.
[5] Y.P.Kalra, D.G.Maynard, F.G. Radford, “Microwave digestion of tree foliage for multi-element analysis,” www.cem.de/documents/pdf/publikation/digestion/R D024.PDF
[6] M. Ghoraishi, J.Takada, C. Phakasoum, “Directional Analysis of the Radio Wave Propagation through Foliage,”
www.ap.ide.titech.ac.jp/.../Archive/COST2100_TD(1 0)10095(1002Mir).pdf
[7] P. Raturi, V. Gupta, ”Effect of Foliage on Out door Propagation,’ Int. J. of Scientific & Engineering Research, vol.4, no.3, pp.1-3, March 2913.
[8] M. Elshayeh, S. Betti,”Study of Attenuation in Vegetation Media and Prediction Model at Microwave Frequencies,” Science Journal of Circutes, System and Signal Processing, vol. 7, no.1, pp.1-7, 2018.
[9] Y. Meng, Y. H. Lee,”Investigations of foliage effect on modern wireless communication systems :A review,” Progress in Electromagnetics Researchvol.105, pp.313-332, January 2010.
[10] M. Karaliopoulos, F. Pavlidou, “Modelling the land mobile satellite channel: A review," IEE Electron. Commun. Eng. J., vol. 11, no. 5, 235-248, 1999. [11] Akyildiz, I. F., W. Su, Y. Sankarasubramaniam, and E.
Cayirci, “Wireless sensor networks: A survey," Computer Networks, vol. 38, no. 4, pp.393-422, 2002. [12] A. Paulraj,, D. Gore, R. Nabar, H. Bolcskei, “An
overview of MIMO communications | A key to gigabit wireless," IEEE Proc., vol. 92, no. 2, pp.198-218, 2004. [13] A. Molisch, “Ultra wideband propagation
channels-theory, measurement, and modeling," IEEE Trans. Veh. Technol., vol. 54, no. 5, pp.1528-1545, 2005. [14] S. Karapantazis, F. Pavlidou, “Broadband
communications via high-altitude platforms: A survey," IEEE Commun. Surveys & Tutorials, vol. 7, no. 1, pp. 2-31, 2005.
[15] Y. Lee, Y. Meng, O. Tay, “Characterization of Wi-Fi antenna system on a remote controlled helicopter," Proc. 2008 Asia Pacific Symp. Electromagn. Compat.
& 19th Int. Zurich Symp. Electromagn. Compat., pp.319-322, May, 2008.
[16] M. Weissberger, “An initial critical summary of models for predicting the attenuation of radio waves by foliage," ECAC-TR, pp.81-101, Electromagn. Compat. Analysis Center, Annapolis, 1981.
[17] M. Al-Nuaimi, R. Stephens, “Measurements and prediction model optimization for signal attenuation in vegetation media at centimetre wave frequencies," IEE Proc. Microw. Antennas Propag., vol. 145, no. 3, pp.201-206, 1998.
[18] A. Seville, K. Craig, “Semi-empirical model for millimetre-wave vegetation attenuation rates," Electron. Lett., vol. 31, no. 17, pp.1507-1508, 1995. [19] A. Seville, A., “Vegetation attenuation: Modeling and
measurements at millimetric frequencies," Proc. 10th IEE Int. Conf. Antennas Propag, 2.5-2.8, Edinburgh, Scotland, Apr. 1997.
[20] H. M.Rahim, C.Y. Leow, T. A. Rahman, A.Arsad, M. A. Malek, ”Foliage attenuation measurement at millimeter wave frequencies in tropical vegetation”, IEEE 13th Malaysia International Conference on
Communications (MICC), 2017. DOI:
10.1109/MICC.2017.8311766
[21] M. Shaik. A. Kabanni, N. Nazeema,” Millimeter wave propagation measurements in forest for 5G Wireless sensor communications”,2016 16th Mediterranean
Microwave Symposium (MMS), DOI:
10.1109/MMS.2016.7803785
[22] C. Umit Bas,” Rui Wang ; Seun Sangodoyin ; Sooyoung Hur ; Kuyeon Whang ; Jeongho Park 28 GHz Foliage Propagation Channel Measurements, 2018 IEEE Global Communications Conference
(GLOBECOM), DOI:
10.1109/GLOCOM.2018.8647674
[23] I. H. Rodríguez, R. P. Abreu, “24 GHz cmwave radio propagation through vegetation: Suburban tree clutter attenuation”, 10th European Conference on Antennas
and Propagation (EuCAP),
DOI:10.1109/EuCAP.2016.7481471
[24] M. Elshayeb, S. Betti,”Study of Attenuation in Vegetation Media and Prediction Model at Microwave Frequencies”, Science Journal of Circuits, Systems and Signal Processing, vol. 7, no. 1, pp. 1-7, 2018. [25] Q. Wang,X. Zhao, S. Li,M. Wang,S. Sun,W. Hong,
“Attenuation by a Human Body and Trees as well as Material Penetration Loss in 26 and 39 GHz Millimeter Wave Bands”, International Journal of Antennas and Propagation vol. 2017, Article ID 2961090, 8 pages
https://doi.org/10.1155/2017/2961090
[26] CCIR, Influences of terrain irregularities and vegetation on troposphere propagation," CCIR Report, 235-236, Geneva, 1986.
[27] COST235, “Radio propagation effects on next-generation fixed-service terrestrial telecommunication systems," Final Report, Luxembourg, 1996. [28] Recommendation ITU-R P.833-9,”Attenuation in
vegetation”, https://www.itu.int/dms_pubrec/itu-r/rec/p/R-REC-P.833-9-201609-I!!PDF-E.pd, September 2016.
164 International Conference on Future Internet of Things
and Cloud, 2018.
[30] T. J. Lee, O. Lee, J. Kim, L. Shterengas,"CO2 sensor with data logger system", IEEE Long Island Systems, Applications and Technology Conference (LISAT), 2012.
Authors
Isao Nakajima Currently serves as Professor at the Nakajima Laboratory, Department of Emergency and Critical Care Medicine, Tokai University School of Medicine. Obtained MD from the Tokai University School of Medicine in 1980; a PhD from the Graduate School of Advanced Medical Science, Tokai University, in 1988; and a PhD in Applied Informatics from the Graduate School of Applied Informatics, University of Hyogo, in 2009. A research goal for several years has been to identify ways to send vast volumes of multimedia data from moving ambulances via communications satellite to assist patients in critical condition.
Futoshi Ohyama Currently serves as Associate Professor at the Tokai University School of Medicine Faculty of Nursing. Obtained an RN in 1991; Certification as public health nurse in 2000; Master’s Degree from the Graduate Tokai University School of Medicine Faculty of Nursing, in 2000; an MSc in Nursing from the Tokai University, Graduate School of Health Sciences, in 2002; and a PhD in Health Sciences from the Graduate School of Health Sciences, Gunma University, in 2014. Recent research includes disaster medicine support with ICT.
Hiroshi Juzoji Graduated from the
Tokai University School of Medicine in 1986; has studied issues related to telemedicine and eHealth for years, developing circuit designs and firmware for special equipment for experimental and practical use. In 1992, he visited and installed small terrestrial satellite stations in the Asia-Pacific region for the Asia Asia-Pacific Medical Network via ETS-V. Developed the embedded system for this scanner and software in the C language.