doi: 10.4114/intartif.vol21iss61pp1-13
ISSN:1137-3601 (print), 1988-3064 (on-line) ©IBERAMIA and the authors
INTELIGENCIA ARTIFICIAL
http://journal.iberamia.org/
Pattern Recognition in Cattle Brand using Bag of Visual Words
and Support Vector Machines Multi-Class
Carlos Silva
1, Daniel Welfer
2, Cláudia Dornelles
31
Federal University of Pampa, Alegrete, Brazil [email protected]
2
Federal University of Santa Maria, Santa Maria, Brazil [email protected]
3
São Francisco de Assis City Hall, São Francisco de Assis, Brazil [email protected]
Abstract The recognition images of cattle brand in an automatic way is a necessity to governmental organs responsible for this activity. To help this process, this work presents a method that consists in using Bag of Visual Words for extracting of characteristics from images of cattle brand and Support Vector Machines Multi-Class for classification. This method consists of six stages: a) select database of images; b) extract points of interest (SURF); c) create vocabulary (K-means); d) create vector of image characteristics (visual words); e) train and sort images (SVM); f) evaluate the classification results. The accuracy of the method was tested on database of municipal city hall, where it achieved satisfactory results, reporting 86.02% of accuracy and 56.705 seconds of processing time, respectively.
Resumen Las imágenes de reconocimiento de la marca de ganado de manera automática es una necesidad para los órganos gubernamentales responsables de esta actividad. Para ayudar a este proceso, este trabajo presenta un método que consiste en el uso de Bolsa de Palabras Visuales para la extracción de características a partir de imágenes de marca de ganado y Máquinas de Vectores de Soporte Multiclase para clasificación. Este método consta de seis etapas: a) seleccionar base de datos de imágenes; b) extraer puntos de interés (SURF); c) crear vocabulario (K-means); d) crear un vector de las características de la imagen (palabras visuales); e) entrenar y ordenar imágenes (SVM); f) evaluar los resultados de la clasificación. La exactitud del método fue probada en la base de datos del ayuntamiento municipal, donde logró resultados satisfactorios, reportando un 86,02% de exactitud y 56,705 segundos de tiempo de procesamiento, respectivamente.
Keywords: Computer vision, Pattern recognition, Machine learning, Bag of Visual Words, Support Vector Machines Multi-Class.
Palabras clave: Visión por computadora, Reconocimiento de patrones, Aprendizaje de máquinas, Bolsa de palabras visuales, Máquinas de vectores de soporte multiclase.
1
Introduction
The use of brands or symbols on cattle presupposes the public recognition of its property by an individual or group. Used since the beginnings of the Iberian colonization in America, its institutionalization began to occur with its recording in official agencies, recognized holders of public legitimacy [2]. After these records followed regulations that seek to legitimize branding, as well as regulate the manner and timing to do it, discriminate how the records are made, assign fees to the records, regulate the craft of the irons, and government taxes. Generally, cattle brand records involve books with the drawings of the brands and the identification of their owner. In Brazil attempts and investments to upgrade the cattle branding recording system were always subject of controversy, due to the opposition from agriculturists. A major part of their concern is associated to a fear of losing family brands and the meaning they acquired through time. Currently, brand recording in Brazil is performed by town offices, generally without a more effective systematization and without instituted renewals.
In face of the context presented, this work intends to present and assess a tool that performs automatic cattle brand recognition, with the goal of replacing the manual control of cattle branding performed today, in order to potentially decrease the possibility of duplicate records, reducing waiting times for the recording of new brands, improving governmental administration regarding the brand archive under its care and aid security officials in preventing cattle raiding crimes.
This research presents the application of an automatic computational method through a software tool for cattle brand recognition. This research was supported by the São Francisco de Assis City Hall, Rio Grande do Sul, Brazil. Therefore, the employees in the Cattle Branding Record Section and in the Data Processing Center of this township validated the suggested tool.
2
Related work
In general, we could not find any works in the literature review that report the use of a set of visual words for the recognition of cattle branding images.
Sanchez et al [3] present a tool for recognition of cattle branding that uses Hu and Legendre moments for extracting features of images in a grey scale, and also a classifier of k-nearest neighbors (k-NN). The authors used Hu and Legendre moments to source features that were not prone to rotation, translation, and scale transformations. The peak percentage of correct classification presented by the authors was 99.3%, with a significant decrease in accuracy as the number of classified images increased, however. Another result they presented was the processing time for the classification. Since a k-NN classifier was used for each new object that was meant to be classified, training data were used to check which objects of the database resembled the most the new object that was meant to be classified. The object is classified in the most common class to which the objects that resemble it the most belong. Thus, classification occurs by analogy. No classification model is created. Instead, for each new object to be classified, training data are scanned, and the suggested classifier becomes computationally expensive.
Differently from the research presented by Sanchez et al [3], the work we propose here intends to show results that can be generalized or reproduced, deploying state-of-the-art techniques for feature extraction and statistical classification of digital images, such as Bag of Visual Words (BoW) and Support Vector Machines (SVM), in order to create a "model" responsible for classifying and retrieving cattle branding images by their content, but with efficient results when applied to large databases. The method described in [3] presents a significant loss of efficiency (accuracy and speed) when applied to large numbers of images.
The BoW method is also commonly referred to as „visual word dictionary‟. This method can be classified as a Content-Based Image Retrieval System (CBIR). Torres e Falcão [4] show some usual approaches in CBIR systems, where a vector is extracted from the images based on features such as shape, texture, and color distribution. In a new query, a vector with the same features is extracted from searched image and compared to the other vectors of existent features in the database through a distance function.
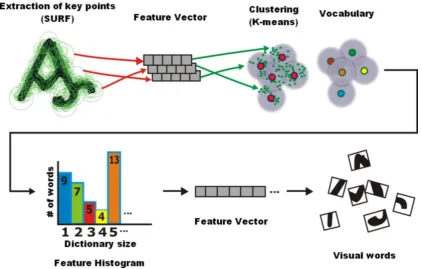
In order to develop the BoW method, feature descriptors and key points extracted from the images are used. The key points are saliences that contain local information of the image and are automatically obtained through key point detection methods [5], [6]. Once detected, the key points are represented by descriptors, such as Invariant Feature Transform (SIFT) [7], Speed Up Robust Features (SURF) [8], among others. Thus, in the visual word dictionary, each visual word is associated to a cluster of key point descriptors. Therefore, each visual word represents a specific local pattern shared by all descriptors of a given clustering. Once the visual word dictionary is defined, it is possible to associate each key point descriptor with the nearest visual word. Each image is represented by a histogram that indicates the frequency that each visual word from the dictionary occurs in the image.
by Sivic and Zisserman [9] presents the technique as an approach for recovering all occurrences of an object in frames from a given video. In order to achieve this, the objects are represented as a set of descriptors that do not vary according to scale, rotation, translation, illumination, and partial occlusion.
Csurka et al [10] apply this technique to find a generic process to deal with several types of objects, and, at the same time, to handle the variations in illumination, viewing, rotation and occlusion, typical of real-world scenarios. The BoW model has shown an outstanding performance in a wide range of tasks, such as action recognition [11], texture [12], gestures [13], image classification [14], etc. The model was used for nudity detection in videos in a work by Lopes et al [15]. On the other hand, in Batista et al [16], the BoW methodology was used for the automatic identification of images that contain façades and buildings in the digitized collection of the Minas Gerais Public Archive.
Li et al [17] used BoW based on blocks for face recognition. Wang et al [18] applied BoW weighing the visual words in medical image retrieval. Alternatively, in Wang et al [19], the authors have developed an algorithm based on BoW for the classification of breast tissue density images in mammographies. Barata et al [20] suggested two systems for melanoma detection in dermatological images, in which the first system used global methods to classify skin lesions, and the second one used local features, and the BoW method to classify the images. Li et al [21] employed a SURF descriptor and spatial pyramid in a BoW methodology to enhance image recognition and classification.
3
Materials
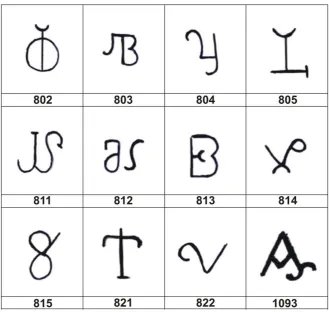
The images from cattle branding presented in this research were provided by the São Francisco de Assis City Hall, in Rio Grande do Sul. We used 12 cattle branding images, each one of them composed by 45 sub-images (samples), totaling 540 samples from original images, but with size and orientation variations. We intended to identify patterns with the greatest independence possible from these variable factors. The images were provided in high resolution in the Portable Network Graphics format at a size of 600 x 600 pixels. The brands used are displayed in figure 1.
Table 1: Brands owners and total samplings by brand.
Branding Owner Total samplings
802 Owner “A” 45
803 Owner “B” 45
804 Owner “C” 45
805 Owner “D” 45
811 Owner “E” 45
812 Owner “F” 45
813 Owner “G” 45
814 Owner “H” 45
815 Owner “I” 45
821 Owner “J” 45
822 Owner “K” 45
1093 Owner “L” 45
For the implementation of the proposed tool, as well as image database storage, algorithm processing and viewing of the results, we used a personal computer with an CPU Intel Core i5-3330 3 GHz, RAM of 8 GB DDR3 1600 MHz, and GPU NVIDIA GTX 750 Ti. Furthermore, we used the MATLAB software with the Parallel Computing and Statistics and Machine Learning libraries.
4
Methods
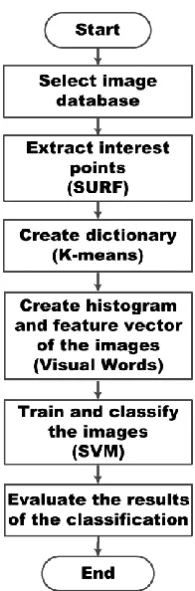
The proposed method consists of six steps, which are: image database selection; extraction of points of interest using the SURF algorithm; development of a visual word dictionary with K-means clustering; development of histograms and vectors for image features; training and classification of images by Support Vector Machines Multi-Class; and, finally, evaluation of the classification results. Figure 2 shows a summarized flowchart of the proposed method.
4.1
Image database
The image set used in the research is described on Section 3. With the application of the data augmentation technique, we generated 45 sub-images for each of the 12 brandings that were used in the experiments. Examples of sub-images generated with scale, translation and rotation variations originated from the brandings presented on figure 1 are illustrated on figure 3.
4.2
Extraction of points of interest from brands through the SURF algorithm
First, we locate an image dataset at the São Francisco de Assis City Hall FTP (File Transfer Protocol) server, in order to download the file, which contains a total of 12 brandings, and 540 sub-images. Next, this image database is instantiated using the MATLAB algorithm, thus the brandings were automatically sorted in categories. After sorting the brandings, the algorithm inspects each one of the created categories to check if the same number of images is available for each branding. In case the number is different, the branding category with the smallest amount of images is taken as a reference for the remaining ones. This process is conducted to balance the number of images in the training set for the next rounds of the method.
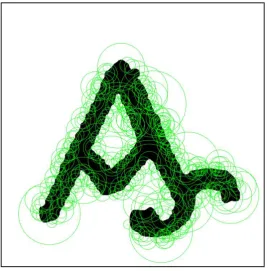
After instantiating the image database and sorting the brandings, we performed the extraction of points of interest from images through the SURF algorithm. This algorithm is based on the sum of the Haar 2-D wavelet answers and the usage of whole images to detect points of interest, and, for this reason, this algorithm is a robust local feature detector and descriptor. The SURF algorithm is used in several computer vision tasks, such as object recognition for 3D reconstruction. Although the SURF is inspired in the SIFT algorithm, SURF is quicker and more robust and also has the advantage of being an invariant region descriptor. In order to make the matching, SURF considers the Laplacian sign, or, in other words, the Hessian matrix trace. Figure 4 illustrates the extraction of 6,751 points of interest (key points) of brand "1093" using the SURF algorithm.
Figure 4. Extraction of 6,751 points of interest of brand “1093” by using the SURF algorithm.
The SURF algorithm was applied to the set of cattle brand images from the samples. Firstly, the algorithm detects the points of interest, and, later, it calculates the features in these points. First, the method finds features with prominent positions. The detection of those prominences is based on a Fast-Hessian multiscale and multi-orientation detector, with a descriptor based on the distribution of grey level change.
4.3
Development of a word dictionary using K-means
size (number of clusters) is made empirically, usually after successive algorithm executions searching for the best sensitivity [22].
This choice is vital, for, besides its influence in the discriminatory ability of the dictionary, it also directly influences computational efficiency and memory usage during the processes of dictionary generation and image classification. Furthermore, the vectors of the features (visual words) that form this dictionary have high dimensionality, thus complicating the application of algorithm processing.
After conducting experiments to assess algorithm performance and accuracy, the proposed clustering size of the presented work was 500. The experiments were conducted by attributing arbitrary values to the number of clusters used for creating the visual words dictionary. The definition of the ideal size of the dictionary for the proposed problem came from the observation of the tool accuracy rates. For dictionaries with less than 500 words, there was a considerable loss of accuracy. On the other hand, in case of dictionaries with larger clusters than what we propose in this research, the computational cost was much higher, which significantly elevated the processing time of the algorithm while performing the task of cattle branding recognition, without bringing any benefit to the general precision of the proposed tool.
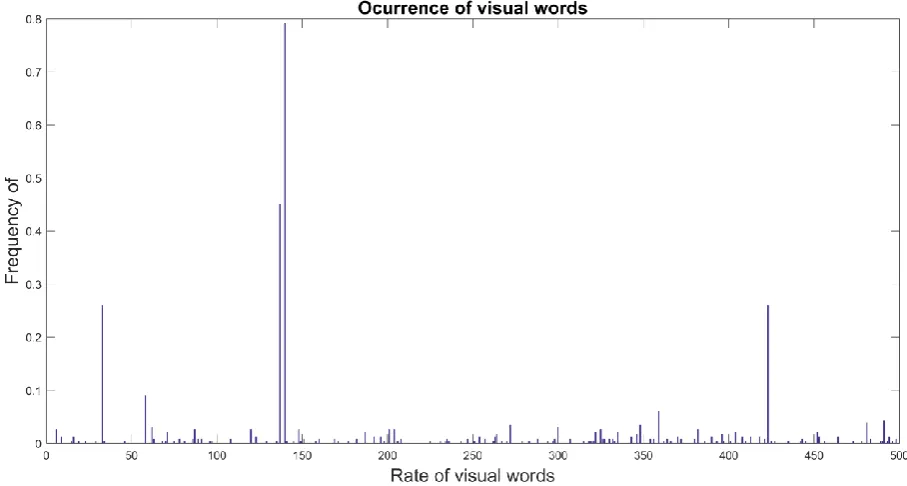
Once the size of the visual word dictionary was defined, it was possible to associate each key point descriptor to the nearest visual word. Therefore, each image was represented by a histogram indicating how often each visual word occurs in the dictionary (an analogous process to what is done in textual information retrieval). We should mention that the K-means algorithm was applied only to the training image set, that is, a total of 14 images. The dictionary size can be verified in the X axis in figure 5.
4.4
Elaboration of a histogram and feature vector of visual words
After creating the visual word dictionary, the descriptors of all images were extracted from the training base, identifying to what visual word the descriptor belongs, and creating a histogram containing the amount of each visual word in the analyzed image. This histogram is a vector where each position corresponds to a visual word and its corresponding value to the amount of visual words from that kind of image. Processing was performed in all training images and the result is a histogram for each image. In the proposed method, the vectors with the image histograms are created by using the encode method of the bagOfFeatures class from MATLAB. Figure 5 shows the histogram with the number of visual word occurrences and the size of the dictionary.
Figure 6 shows the performance of the Bag of Visual Words method applied in the proposed research.
Figure 6. Bag of Visual Words method applied in the proposed research.
4.5
Training and classification of images with support vector machines
The fifth step of the method is the training of a linear classifier, to make it possible to determine the category to which the image belongs through the visual word histogram. The model for automatic learning adopted in the presented work was the Support Vector Machine (SVM) supervised classifier. Support Vector Machine is a classification algorithm known for its success in a wide range of applications. SVMs are one of the most popular approaches for data modeling and classification. Its advantages include their outstanding capacity for generalization, concerning the ability to correctly sort the samples that are not in the feature space used for training [23]. Considering two classes and a set of points attributed to these classes, the SVM determines the hyperplane that separates the points so that the higher number of points from the same class is placed in the same side, maximizing the distance from each class to that hyperplane, consequently being denominated as a maximum margin classifier [24]. Indeed, a great margin between the values corresponding to points from two data sub-sets entails a further minimized generalization risk of the classifier.
4.6
Assessment of classification results – confusion matrix
The confusion matrix of a classifier indicates the number of correct classifications versus the predictions made in each case based on a group of examples. In this matrix, the lines depict the actual cases and the columns depict the predictions made by the model. Through the confusion matrix, it is possible to find information related to the number of correctly and incorrectly classified images for each group of samples. This is an AxA matrix, where A is the amount of categories to which we apply the classifier. In our case, the experiment conducted included 12 brands, so we have a 12x12 confusion matrix in this situation.
For the evaluation of the proposed tool, we also used the Precision, Recall and F1-score measures, commonly used in the recovery of information and applications computational vision applications. These metrics are calculated based on the True Positive (TP), True Negative (TN), False Positive (FP), and False Negative (FN), from the confusion matrix generated by the experiment.
Precision and Recall are measurements originated from Information Recovery and used in Classification when working with non-balanced classes. Precision is the percentage of instances that were correctly classified as positive among all of the data that were classified as positive, while Recall is the percentage of instances that were correctly classified as positive among the ones that really were positive, and F1-score is the harmonic mean between precision and recall [26]. The advantage of the F1-score is that it offers only one quality metric, facilitating a better understanding for end users.
Precision metrics are calculated according to Equation 1, the obtained Recall through Equation 2, and the F1-score defined by Equation 3.
(1)
(2)
(3)
5
Results and Discussion
Through the results found we were able to assess the proposed method. The assessment of experiment results was performed based on the accuracy obtained in the confusion matrix rendered from the classification attained in the validation stage. Furthermore, the total processing time of the proposed method was also checked.
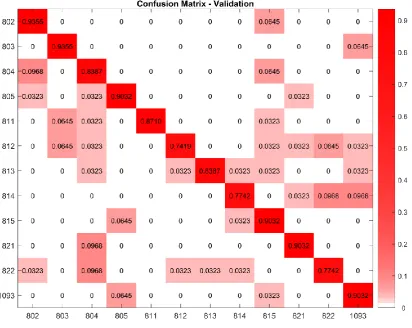
Figure 7 presents the confusion matrix for the best result obtained in the experiments, with a accuracy of up to 86.02%. Through the analysis of the main diagonal we can observe that the correct accuracy is emphasized in two brandings, "802" and "803", in which the percentage of correctness reached 93.55%. We can also observe that the brandings with the lowest accuracy were "812", "814", and "822", with a percentage of 74.19%, 77.42%, and 77.42%, in this order. The remaining brandings, "804"; "805"; "811"; "813"; "815"; "821" and "1093", had an accuracy of 83.87%; 90.32%; 87.09%; 83.87%; 90.32%; 90.32%; and 90.32%, respectively.
The hypothesis of wrong classification of cattle branding as shown in the confusion matrix may be associated to the complexity of the samples and to the size of the dictionary adopted for clustering. However, it is important to remark that a larger dictionary directly affects the algorithm performance.
Figure 7. Confusion matrix obtained in the validation stage.
Figure 8 presents an illustration with the accuracy percentage of the brandings that were correctly classified in the experiment.
The orange bars represent the percentage of correctly classified cattle brandings (accuracy). Amongst the 12 brandings we analyzed, 2 presented 93.55% of correct classifications, namely, "802" and "803". The cattle brandings with the lowest correct percentage were "812", "814", and "822", with 74.19%, 77.42%, and 77.42%, respectively.
Table 2 demonstrates the results of Precision, Recall, and F1-score obtained in the experiment, during the validation step. The results suggest that the proposed tool have achieved satisfactory results regarding the recognition of cattle branding images.
Table 2: Precision, Recall, and F1-score results obtained during the validation step. Branding Precision (%) Recall (%) F1
802 93.55 85.29 0.8923
803 93.55 87.88 0.9062
804 83.87 72.22 0.7761
805 90.32 87.50 0.8889
811 87.10 100.00 0.9310
812 74.19 92.00 0.8214
813 83.87 96.30 0.8966
814 77.42 88.89 0.8276
815 90.32 77.78 0.8358
821 90.32 90.32 0.9032
822 77.42 82.76 0.8000
1093 90.32 80.00 0.8485
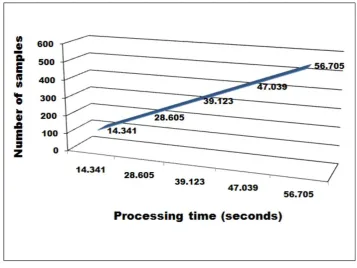
The processing time of the algorithm based on the number of cattle branding samples is shown in figure 9. The processing times of the proposed method were measured for the classification of five sample groups, respectively. Each group contained 108; 216; 324; 432; and 540 images. The processing times for the classification of the images in each group was 14.341s; 28.605s; 39.123s; 47.039s; and 56.705s, in this order. When analyzing the graphic in figure 9, we notice that the processing time observed in the Y-axis varies in direct proportion of the increase of samples of cattle branding classified in the X-axis, i. e., a pattern of linear growth of the function is observed, even if the growth rate is not exactly a constant number.
The results obtained with the experiments performed with 12 cattle brandings and 540 image samples obtained an accuracy of 86.02%, an error rate of 13.98%, and a total processing time of 56.705 seconds.
The accuracy was obtained through the calculation of the arithmetic average of brands properly classified from the confusion matrix, and the total processing time was obtained with the use of the MATLAB software which, at the end of code processing, performs the breakdown of the algorithm processing speed.
6
Conclusions and Future Research
In this research, we presented an automated method for the recognition of cattle branding, using a set of visual words. The project was developed and conducted in two institutions: São Francisco de Assis City Hall and Federal University of Pampa. In the experiments conducted in this research, the Bag of Visual Words method was used, in which was applied the SURF algorithm to extract the points of interest from the images, the K-means clustering to group the histograms, and an SVM supervised classifier to classify the cattle branding images. The experiments were all conducted using the cattle branding base provided by the São Francisco de Assis City Hall. The usage of the suggested method delivered a mean accuracy of 86.02% and an algorithm processing time of 56.705 seconds for the 12 assessed brands, in a total of 540 samples.
The deployed method has effectively and efficiently performed the recognition of different cattle brands, but its main limitation was the empirical definition of the size of the dictionary defined for the clusters. Several experiments were performed with different dictionary sizes in order to obtain an optimal value, which could maintain satisfactory recognition levels and reasonable computational cost and processing time. The next step of this research is related to the improvement of the applied method striving for more accurate results.
In general, there is no specific method in the Literature for determining the exact value of a dictionary size for the clusters, but it is possible to obtain a more precise estimation through some techniques, such as cross-validation, silhouette method, Gaussian-means (G-means) algorithm, among others. For that matter, in future works, we aim to conduct new experiments with methods that allow for a more appropriate choice of number of clusters of K-means algorithm, in order to obtain better results both for precision and processing time. Furthermore, we intend to test other techniques for extracting points of interest from cattle images, such as the BRISK, FREAK and ORB algorithms, in order to obtain faster results when compared to the SURF algorithm, that we used in this researched.
References
[1] Secretaria do Planejamento e Desenvolvimento Regional – Governo do Estado do Rio Grande do Sul, Brasil. 2015. URL: http://www.scp.rs.gov.br. Accessed 19 july 2015.
[2] Arnoni, R. Os Registros e Catálogos de Marcas de Gado da Região Platina. Pelotas: Revista Memória em Rede da UFPEL, 2013.
[3] Sanchez, G.; Rodriguez, M. Cattle Marks Recognition by Hu and Legendre Invariant Moments. ARPN Journal of Engineering and Applied Sciences, Vol. 11, Nº 1, 2016.
[4] Torres, R.; Falcão, A. Content-based image retrieval: Theory and applications. Revista de Informática Teórica e Aplicada, v. 13, p. 161-185, 2006.
[5] Lindeberg, T. Detecting salient blob-like image structures and their scales with a scale-space primal sketch: A method for focus-of-attention. International Journal of Computer Vision, 11: 283-318, 1993. doi: 10.1007/BF01469346
[6] Lazebnik, S.; Schmid, C.; Ponce, J. Affine-invariant local descriptors and neighborhood statistics for texture recognition. In Proc. ICCV, pages 649-655, 2003. doi: 10.1109/ICCV.2003.1238409
[7] Lowe, D. Object recognition from local scale-invariant features. Computer Vision, IEEE International Conference on, 2:1150, 1999. doi: 10.1109/ICCV.1999.790410
[8] Bay, H.; Tuytelaars, T.; Gool, L. Surf: Speeded up robust features. In ECCV, pages 404-417, 2006. doi: 10.1007/11744023_3
[10] Csurka, G.; Dance, C.; Fan, L.; Willamowski, J.; Bray, C. Visual categorization with bags of keypoints. In
Workshop on Statistical Learning in Computer Vision, ECCV, pages 1-22, 2004.
[11] Ullah, M.; Parizi, S.; Laptev, I. Improving bag-of-features action recognition with non-local cues. In: Labrosse, F.; Zwiggellar, R.; Liu, Y.; Tiddeman, B. (Ed.). Proceedings of the British Machine Vision Conference [S.l.]: BMVA Press, 2010.
[12] Zhang, J.; Marszalek, M.; Lazebnik, S.; Schmid, C. Local features and kernels for classification of texture and object categories: A comprehensive study. In. J. Computer Vision, 2007. v. 73, n. 2, p. 213-238, 2007. doi: 10.1007/s11263-006-9794-4
[13] Dardas, N.; Chen, Q.; Georganas, N. Hand gesture recognition using bag-of-features and multi-class support vector machine. Proceedings of IEEE International Symposium on Haptic Audio-Visual Environments and Games, p. 1-5, 2010. doi: 10.1109/HAVE.2010.5623982
[14] Nowak, E.; Jurie, F.; Triggs, B. Sampling strategies for bag-of-features image classification. In: Computer Vision. [S.l.]: 9th European Conference on Computer Vision, v. 3954, p. 490-503, 2006. doi: 10.1007/11744085_38
[15] Lopes, A.; Avila, S.; Peixoto, A.; Oliveira, R. Coelho; Araújo, A. Nude detection in vídeo using bag-of-visual-features. In: SIGGRAPI ’09 Proceendings of the 2009 XXII Brazilian Symposium on Computer
Graphics and Image Processing. [S.l.: s.n.], 2009. doi: 10.1109/SIBGRAPI.2009.32
[16] Batista, N.; Lopes, A.; Araújo, A. Vocabulários visuais aplicados à detecção de edifícios em fotografias históricas. In: XXXV Conferência Latinoamericana de Informática (Latin-American Conference on Informatics), CLEI, Pelotas, RS, Brazil. [S.l.: s.n.], 2009.
[17] Li, Z.; Imai, J.; Kaneko, M. Robust face recognition using block-based bag of words. In: 2010 International Conference on Pattern Recognition. [S.l.: s.n.], 2010. doi: 10.1109/ICPR.2010.320
[18] Wang, J.; Li, Y.; Zhang, Y.; Wang, C.; Xie, H.; Chen. G.; Gao, X. Bag-of-features based medical image retrieval via multiple assignment and visual words weighting. IEEE Trans. Med. Imaging, v. 30, n. 11, p. 1996-2011, 2011. doi: 10.1109/TMI.2011.2161673
[19] Wang. J.; Li, Y.; Zhang. Y.; Xie, H.; Wang, C. Bag-of-features based classification of breast parenchymal tissue in the mammogram via jointly selecting and weighting visual words. In: ICIG ’11 Proceedings of the
2011 Sixth International Conference on Image and Graphics. [S.l. s.n.], 2011. doi: 10.1109/ICIG.2011.192 [20] Barata, C.; Marques, J.; Mendonça, T. Bag-of-features classification model for the diagnose of melanoma in
dermoscopy images using color and texture descriptors. 10th International Conference, ICIAR 2013, Póvoa do Varzim, Portugal, June 26-28, v. 7950, p. 547-555, 2013. doi: 10.1007/978-3-642-39094-4_62
[21] Li, K.; Wang, F.; Zhang, L. A new algorithm for image recognition and classification based on improved bag of features algorithm. Optik, 2016. v. 127, p. 4736-4740, 2016. doi: 10.1016/j.ijleo.2015.08.219
[22] Ferraz, C. Novos descritores de textura para localização e identificação de objetos em imagens usando Bag-of-Features. Tese de Doutorado – Programa de Pós-Graduação em Engenharia Elétrica – Escola de Engenharia de São Carlos da Universidade de São Paulo, 2016.
[23] Teixeira, A. Desenvolvimento de uma Interface Gráfica para Classificadores de Imagem. 2016. URL: https://repositorio.ipcb.pt/bitstream/10400.11/1155/1/disserta%C3%A7ao.pdf. Accessed 15 july 2015.
[24] Lu, H.; Huang, Y. Chen, Y.; Yang, D. Real-Time Facial Expression Recognition Based on Pixel Pattern-Based Texture Feature. In: Proc. Electronic Letters, pp. 916-918, 2007. doi: 10.1049/el:20070362
[25] Tchangani, A. Support Vector Machines: A Tool for Pattern Recognition and Classification. Studies. In
Informatics & Control Journal 14: 2. 99-110, 2005.