doi: 10.4114/ia.v18i56.1147
ISSN: 1988-3064(on-line) ©IBERAMIA and the authors
INTELIGENCIA ARTIFICIAL
http://journal.iberamia.org/
Improving Image Retrieval using a Data mining Approach
Houaria ABED*, Lynda ZAOUI
Laboratoire Signaux, Systèmes et Données, LSSD,
Université des Sciences et la Technologie d’Oran-Mohamed Boudiaf-, Oran, Algeria
[email protected]*, [email protected], [email protected]Abstract Recent years have witnessed great interest in developing methods for content-based image retrieval (CBIR). Generally, the image search results, which are returned by an image search engine, contain multiple topics, and organizing the results into different clusters will facilitate users’ browsing. Our aim in this research is to optimize image searching time for a general image database. The proposed procedure consists of two steps. First, it represents each image with a data structure which is based on quadtrees and represented by multi-level feature vectors. The similarity between images is evaluated through the distance between their feature vectors; this distance metric reduces the query processing time. Second, response time is further improved by using a secondary clustering technique to achieve high scalability in the case of a very large image database.
Resumen Los últimos años han sido testigos de un gran interés en el desarrollo de métodos para la búsqueda de imágenes basada en contenidos (CBIR). Generalmente, los resultados de búsqueda de imágenes desde un motor de búsqueda de imagen contienen varios temas, la organización de los resultados en diferentes clústeres facilitarán la navegación de los usuarios. Nuestro objetivo en esta investigación es el de optimizar el tiempo de búsqueda de una imagen en una base de datos imágenes generalista. El procedimiento propuesto se constituye en dos pasos: En primer lugar, cada imagen será representa con una estructura de datos basada en Quadtree y representada por característicos vectores de múltiples niveles. La similitud entre las imágenes se evalúa a través de la distancia entre sus característicos vectores; esta distancia métrica reduce el tiempo de procesamiento de consultas. En segundo lugar, el tiempo de respuesta se mejora además usando una técnica de clustering para lograr una alta capacidad de ampliación en el caso de una gran base de datos de imágenes.
Keywords: Image Clustering, Image Indexing, QuadTree, Similarity distance, PAM
Palabras clave: Clustering imágenes, indexación de imágenes, quadtree, similitud distancia, PAM
1
Introduction
Current developments in digital information technology have enabled the acquisition and storage of a large amount of information, which creates a need for image database management systems. These systems have been developed to fulfill the requirements of several domains that appeal to the collection, storage, and management of large sets of images coming from both homogeneous and heterogeneous sources (e.g., satellites, medical imaging, and so forth).
assigned keywords. Attempts to address these limitations have led to the emergence of content-based image retrieval (CBIR) systems that conduct searches based on the physical content of images.
In developing a visual CBIR system, the first critical decision is to determine which image features, such as color [1], texture [2], shape [3], or a combination of image features, will be used for image indexing and retrieval purposes. Most image retrieval systems adopt a two-step approach to searching image databases. First, for each image in the database, a feature vector characterizing some image properties is computed and stored in a feature base. Second, the feature vector for a query image is computed and compared to the feature vectors in the feature base, and images similar to the query image are returned to the user. In addition, the physical indexing techniques must be adapted to the multidimensional nature of visual characteristics. They must be enriched for easy technical access to images and to improve image searching in a database.
This article proposes representing each image of a database in a data structure based on a quadtree and represented by a multi-level feature vector. In this work, we use the low-level visual features color and texture.
Presently, there is strong interest in using digital images, and there is therefore a great need to develop an efficient technique for finding images. The few existing image retrieval systems require a great expenditure of effort. Often they do not satisfy users because their architecture is based on the storage of images in a single location and searches must sweep the entire image database. A cluster organization can address this problem, as the volume of data to be searched is reduced by performing the search in the cluster which is considered relevant. Images in the same cluster should be as similar as possible to ensure the high quality of the results.
In this paper, we propose a clustering technique to partition an image database and we present the challenges in developing such a system for indexing and retrieving images, mainly those related to the complexity of applying data mining techniques to this data type. To address these challenges, we use the PAM [4] algorithm.
2
Related Work
In recent years, several reviews of the literature on image retrieval from different viewpoints have been published. In a content based image retrieval (CBIR) system, the user chooses a query image in the database and the system returns a list of images similar to the query image. The similarity between images is measured using a distance function.
Most of the existing image indexing techniques is essentially based on quantifiable dominant visual image features such as color, texture, spatial arrangements of image contents, and so forth [5], [6],[7],[8]. These features which are extracted from images are stored as numerical vectors called feature vectors or descriptors. The similarity measure quantifies the similarity of content between the feature vectors for two images.
The most widely discussed visual feature for representing image contents is color. Representative studies of color perception and color spaces can be found in [9], [10], [11]. Images can be retrieved based on color similarity by computing a color histogram. Two traditional approaches have been used. The first approach called the global color histogram (GCH) is used for representing images by their histograms; the similarity between two images can be determined by the distance between their color histograms. The second approach, called the local color histogram (LCH) divides images into blocks and obtains the histogram for each block individually, representing an image by this set of histograms. To compare two images, each block from one image is compared with the block at the same location in the other image. The distance between the two images is measured as the sum of the distances between each pair of blocks. Besides color histograms, several other color feature representations have been used in image retrieval, including color moments, color sets [12] and color spaces such as RGB(Red, Green, Blue) [13].
regularly spaced parallel lines. The most widely used set of texture features is Haralick’s [14] grey-level co-occurrence features. Other frequently used texture measures include Tamura features [15]; these are six basic textural features: coarseness, contrast, directionality, line-likeness, regularity, and roughness. Additionally, Galloway [16] suggested and calculated 20 coefficients for run-length matrixes.
Shape description or representation is also an important feature for image retrieval systems. Shape descriptors fall into two categories: contour-based and region-based [17]. Contour-based shape descriptors use only boundary information and ignore the interior content of shapes, while region-based shape descriptors exploit the interior pixels of a shape. Contour-based shape descriptors have limitations when it comes to extracting complex shapes. In contrast, region-based shape descriptors can be applied to more general shapes. Hence, region-based shape descriptors such as Moment Invariants (MI) [18], Zernike Moments (ZM) [19],[20], and Legendre Moments (LM) [21] are preferred for representing the shape content of an image. One particular problem in representing shapes is how to treat images that have overlapping or touching shapes. In sum, the combination of color, texture and shape features provides a robust feature set for image retrieval [22].
CBIR also focuses on developing new techniques that support effective searching and browsing of large digital image libraries based on image features. This is a rapidly expanding research area situated at the intersection of databases, information retrieval and computer vision. To facilitate access to the images and to improve the image search in a database, data mining methods are used. In recent years there has been a growing interest in the development of image content clustering [23]. The aim is to find a way to map a given image database into clusters such that the set of clusters gives essentially the same predictions or information as the original image database.
In the retrieval process for methods that use a clustering approach, the query image is first compared with the average color of all the cluster centres. The subset of clusters that have the greatest similarity to the query image is chosen. The query image is then compared with all the images within the selected subset of clusters. Other methods have also been proposed. For example in Huang et al. [23], [24], a hierarchical classification tree is generated via supervised learning, using a training set of images with known cluster labels. The tree is then used to categorize new images which are entered into the database.Greenspan et al. [25] introduced a probabilistic and continuous framework for supervised image category modelling and matching. Chen et al. [26] focus on the use of hierarchical tree structures to both speed up searches by query (top-down) and organize databases for effective browsing (bottom-up). In this work, a hierarchical browsing environment is constructed based on the results of the agglomerative clustering algorithm. Abdel-Mottaleb et al. [27] use more localized representations. Each cluster centre is computed as the average of the histograms in the corresponding image set, and an agglomerative clustering algorithm is used to create a tree structure which can serve as a browsing environment. Although data mining is currently used for classic digital data, its adaptation to multidimensional data remains a real problem. Our proposed system is based on a multi-cluster architecture, where each cluster contains a set of similar images. We use a local description with a quadtree structure to represent each image. Our image database is represented by a generic quadtree. This structure minimizes the storage space needed for a set of images. The rest of this paper is organized as follows. Section 3 presents the architecture for a CBIR system. Sections 4 and 5 present the arborescent index structure called a quadtree and the generic quadtree structure. Section 6 presents the image search process and the general definition of distance. Section 7 introduces the notion of clustering. Sections 8 and 9 present the system implementation and experimental results. Finally, Section 10 draws some conclusions.
3
Architecture of the Content-Based Image Retrieval System
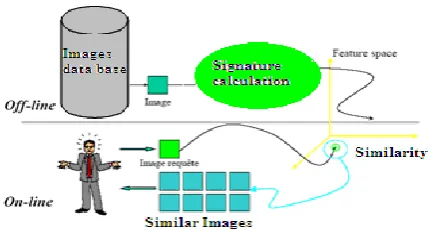
The architecture for a CBIR system is shown in Figure 1. Two phases are provided for interaction with the system: An indexing phase called the offline phase and a search phase also known as the online phase:
Offline phase: In this phase, once images are indexed into the database using the extracted low-level features (color, texture, shape…), an N-dimensional feature vector is assigned to each image.
Online phase: This is the search phase. The retrieval of images is based on the similarity between the features of the query image and those of target images in the database, which is measured using a definition of the distance between the feature vectors which represent the images.
Figure 1. The classic architecture of a Content-Based Image Retrieval System.
CBIR is based on the similarity of the visual features of images such as color, texture or shape. The specific distance function used to assess the similarity between images depends on the search criteria and on the representation of the characteristics of the image. The main idea in the present work is to associate with each image a quadtree representing these characteristics and to measure the similarity of images using a distance function between these trees.
4
Arborescent Index Structure
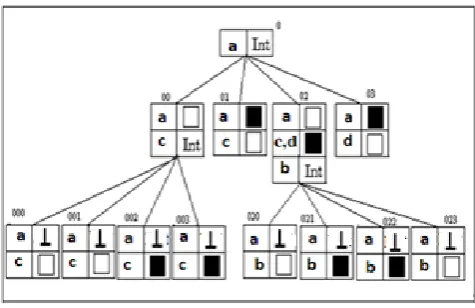
The hierarchical data structure known as a quadtree [27], [28] is used in the image domain for problems ranging from image representation to image storage and content-based retrieval. In this data structure a two-dimensional image is recursively decomposed into four quadrants. Each of the four quadrants becomes a node in the quadtree. Larger quadrants are nodes at a higher hierarchical level of the quadtree, and smaller quadrants appear at lower levels (Figure 2). Each node of the quadtree stores a feature vector for the corresponding image quadrant’s features, including color, texture, and shape. The two-dimensional quadtree is a regular hierarchy, and consequently, all nodes can be manipulated by the same programs and algorithms.
Figure 2 Example of an Image represented by Quadtree
5
Generic QuadTree
A generic quadtree (GQT) [29] can be used as a data structure for representing, managing and storing similar images. The GQT approach is based on a principle of sharing parts of image quadtrees. This structure minimizes the memory space needed for a set of images and incorporates the following concepts: sharing parts of images organized in quadtrees, similarity between trees representing the images and the image tree which organizes them.
5.1
Sharing parts of Images organized in Quadtrees
5.2
Similarity between images
The most common method for comparing two images in CBIR is to use an image distance measure. An image distance measure compares the similarity of two images for various dimensions such as color, texture, shape, and others. In our case, the computed distance measure between two images i and j evaluates the common parts shared between their quadtrees and is based on several criteria such as the structure of the quadtrees and the values of the nodes.
5.3
Image tree
The images represented by a generic quadtree are organized in a particular structure called an image tree. An image tree stores the descendants of an image, like a version hierarchy. Using the image tree, the generic quadtree allows an image to share common parts with its ancestors and descendants. An image j is inserted in the image tree as a child of image i if the similarity between j and i is the smallest similarity between j and any node in the database.
Example1. Figure 3 presents four images a, b, c, d and their image tree
Figure 3. Example of 4 images and their Image Tree
Figure 4. Organisation of Figure 3 using GTQ
5.4
Generic nodes
The generic quadtree is a quadtree based structure whose nodes are called generic nodes. A generic node n represents the nodes n of all quadtrees of images belonging to the database. It contains all of the information necessary to rebuild the value of the node with identifier n in each image quadtree. Each generic node may be seen as a table with two columns and one or several lines. Each line l of a generic node n contains a list of image identifiers and a value v of a quadtree node: v is the value of node n in each image quadtree whose identifier i appears in line l.
Example2. Figure 4 represents the Generic quadtree of the images represented in Figure3. The generic node 0 contains a line with value int, which means that node 0 is internal in the quadtrees for all images.
6
Image Search
measures exist. The definition of similarity depends much on why the image is required. We give the standard definition of the distance between images represented by a quadtree. This distance, denoted as
(
i
,
j
)
[30] is used to measure the similarity between images i and j.6.1
Definition of the distance between images
To compare images represented by quadtrees, thedistance
between images iand j is defined as follows:k k
k i j c
c j
i
(, )
(, )/Where (i,j) k
∈ [0, 1] is the normalized distance between the homologous nodes k of quadtrees i and j, and ck≥ 0 is a weight coefficient representing the weight of the node k in the distance calculation. Each weight ck is based on the importance given to certain quadrants of the image compared to others in the calculation of the distance ∆.6.2
Specific cases of the distance
∆
Specific cases of the distance
follow: these depend on the weights ck. The T distance (T for tree) compares the structure of two quadtrees representing images without taking into account the value of their leaf nodes. The distance k(i, j) takes only two values: 0 when nodes are either both internal or both leaves, and 1 when the node is a leaf in one quadtree and internal in the other or when the node k exists in only one tree.
The Q distance (Q for quadrant): The Q-similarity between two images is defined as the number of nodes that have the same identifier but different values. The distance k(i, j) has the value 0 when all homologous nodes are either both internal or both leaves with the same value. The distance is 1 when a node is a leaf in one quadtree and internal in the other or when the node k exists only in one tree, and is a value ranging between 0 and 1 when homologous nodes are either both leaves or both internal but have different values.
The V distance (V for visual): During the calculation of the distance
between two images i and j, the quadtrees for these images are completed so that they have the same structure. Calculating the distance V takes into account only the distance between leaf nodes k(i, j) = 0 for all internal nodes. ck associated with the leaves are proportional to the surface of the corresponding quadrants in the images, we take ck = 4-p where p is the level of the leaf node in the quadtree.6.3
Similarity Calculation
The similarity calculation is based on the distances T, Q, and V as defined above. For example, Table 1 shows the similarities T, Q, V between four target images and the query image represented by the quadtree in Figure 5.
Figure.5 Example of similarity
For example, if we consider two images are similar when their Q distance is lower than 0.3, then the result of the request corresponds to the images 1 and 2.
7
Clustering
Data clustering is a statistical method for data analysis. It aims to divide a data set into different clusters which are homogeneous in the sense that the data in each subset share some common characteristics [31, 32]. The clusters usually correspond to proximity criteria which define appropriate distances between classes and objects. The clusters are defined in a way which maximizes the similarity within clusters and minimizes the similarity between different clusters. A cluster is usually identified by a cluster centre (or centroid).
Clustering algorithms are used in many applications, such as data mining, digital image searching, classification, identification, management and storage, and so forth. Many clustering methods are available, and each may give different groupings for a data set. The choice of a particular method depends on the type of output data desired. In general, clustering methods may be divided into two categories: hierarchical and partitional clustering
7.1
Hierarchical methods
Hierarchical clustering arranges items in a hierarchy with a treelike structure, based on their distance or similarity. Hierarchical methods can be further divided into agglomerative and divisive methods. In an agglomerative method, each object initially represents a cluster of its own. Then clusters are successively fused together to form progressively larger clusters. In a divisive method, all objects initially belong to one cluster, which is divided into sub-clusters that are successively divided into their own sub-clusters. This process continues until the desired cluster structure is obtained. One problem with these methods is how to choose which clusters or partitions to extract from the hierarchy, since display of the full hierarchy is not really appropriate for datasets of more than a few hundred compounds. The classic approaches to hierarchical clustering are SLINK [33], COBWEB [34], CURE [35] and CHAMELEON [36].
Image1 Image 2 Image 3 Image4
T 0 0 0.38 0.38
Q 0.15 0.08 0.46 0.38
V 0.08 0.06 0.09 0.03
7.2
Partitioning methods
Partitioning methods generally result in a set of M clusters, with each object belonging to one cluster. Each cluster can be represented by a centroid or a representative object. Partitional clustering aims to optimize cluster centres as well as the number of clusters. Most clustering algorithms require the number of clusters to be specified in advance. Previous work has proposed several clustering methods, including K-Means, PAM and CLARA. For the present work, we have chosen the PAM algorithm [4].
The PAM (Partitioning Around Medoids) method was developed by Leonard Kaufman and Peter J. Rousseeuw [4]. This algorithm is very similar to K-means. It partitions the dataset of n objects into k clusters, which are the input for the algorithm. The algorithm computes k representative objects for the clusters, called medoids. A medoid can be defined as the object in a cluster whose average dissimilarity to all other objects in the cluster is minimal. This partitioning method is based on the distances between the objects to be classified and is independent of data type, data structure and the similarity measure between these data. PAM is direct and easy to implement.
7.3
Image clustering
Searching large databases of images is a challenging task, especially for retrieval by content. Most search engines calculate the similarity between the query image and all the images in the database. The problem with this approach to searching is that the retrieval time for the search is long. Image clustering has become a critical technology to optimize the search time for users (the quicker, the better) in large image databases.
8
System Architecture
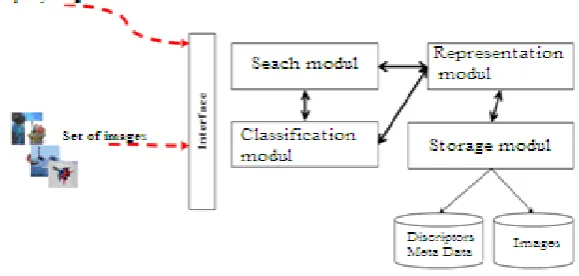
In our implementation, the system architecture includes four functional modules, as shown in Figure 4: the representation module, classification module, storage module, and search module. The PAM clustering method is the kernel algorithm for this system.
Figure 6. Architecture of the CBIR system proposed
8.1
Representation module
The representation method that we use is based on checking the similarity between the trees that represent images. For this purpose, the representation module represents each image with a quadtree [28], [16]. This representation makes the system independent of the data type (vector or raster) and image format (BMP, JPEG, etc.). Furthermore, it can compress an image representing a homogeneous area in a quadtree node rather than using a large number of pixels. In our work, we record only the leaves to optimize storage and file loading.
8.1.1. Indexing
The indexing aim provides a partition of an image into regions. The regions are relatively homogeneous in terms of the features we use color and texture.
Extraction of the characteristic color
Color is the first and most straightforward visual feature for indexing and retrieving images; it is relatively robust and simple to represent. We propose an RGB color retrieval technique in which each quadtree root stores the average color vectors for the corresponding image in a three-dimensional RGB color space. The average color represents the variance. The homogeneity of a region or quadrant is determined by formulas (2) and (3):
𝜇𝑘=𝑁1 𝑁𝑗 =1𝑐𝑘𝑗
(2)
σk = N1 ckj − μk 2 N
j=1
(3)
where ckj is the value of the k
th
color component of image pixel j and N is the number of pixels in the region or quadrant .
The homogeneity S of a quadrant is computed by averaging σk for the three color components:
S = 3k=1σk
3
(4)
Define a threshold
The threshold allows us to decide if the quadrant is homogeneous or not, we take the threshold = 0.25.
If the value S is below the threshold, we consider the region (quadrant) to be homogeneous and assign it the color μmeans which is computed by averaging μkover the color components:
μmeans= μk
3 k=1
3 (5)
Otherwise the quadrant is divided. Extraction of the characteristic texture
Our approach to texture is based on Haralik’s method of co-occurrence matrixes. Haralick described 14 statistics that can be calculated for a co-occurrence matrix with the intent of describing the texture of the image. Four of the 14 have been found to be the strongest descriptors of a texture: energy, entropy, inertia, and contrast. We define three parameters for energy, inertia, and entropy. Then, for each homogeneous region obtained from the color segmentation, four co-occurrence matrices are calculated for a distance d = 1 and four directions (0°, 45°, 90° and 135°). For the matrix, three values (energy, inertia, and entropy) and then calculated as follows:
Energy =
iN01
Nj01(
P
ij(
d
,
)
2)
(6)
Inertia = 1 (( ) ( , ))
0 1 0 2 d P j i ij N i N j
(7)
Entropy = 1 (log ( , ) ( , ))
0 1
0 Pij d Pij d N i N j
(8)
Entropy measures the randomness of the elements of the matrix. When all elements of the matrix are maximally random, entropy reaches its highest value. Thus, a homogeneous image has lower entropy than an inhomogeneous image—so when energy increases, entropy decreases. Inertia has the opposite effect. When the high values in the matrix are further away from the main diagonal, the value of inertia increases.
8.2
Classification module
The classification module is loaded to group a set of images into N subsets of similar images (offline phase) and to determine the cluster for a new image which has been added to the database or search for an image (online phase). The aim of the classification process is to maximize the similarity within clusters, minimize the similarities between two different clusters, and reduce the image search computation time.
For this module, we use an unsupervised clustering method based on partitioning which uses the distances between objects (PAM). Our choice was motivated by the efficiency and flexibility of this algorithm. The main steps of the PAM algorithm are defined in [19]. Our model solves problems with regard to cluster initialization and the choice of the number of clusters. The PAM method can be used to classify any type of data. In our case, it is interesting to have a real image as representative of a cluster. To compute the similarity between images, we calculate the visual distance V between their quadtrees. Recall that in the case of a medoid representation, any of the three similarity measures for the quadtrees (V, Q, or T) can be used.
PAM Algorithm
Initialization
1: Arbitrarily choose K objects as the initial representative objects. 2: Repeat
3: For every pair (i, j) of non-selected object j and selected object i 4: calculate the total swapping cost Cij where
5:
k
i dist(k, -i) dist(j, ij
C
6: if Cij <0, then i is replaced by j
7: Then affect each unselected object to medoid that it is most similar 8: Until there is no change in the assignments.
9: End .
8.3
Storage module
This module optimizes the storage size needed for a set of images. It can manage an image database organized into several clusters using meta-information about the data set. It also allows management of images organized into a Generic QuadTree (GQT). The meta-information contains two types of information: the organization of the database, which provides information about the number of clusters used and the location of each cluster, and descriptions of the clusters.
8.4
Search module
The search module provides an interface which allows users to specify their queries and returns the corresponding results (similar images) for the query criteria. For our model, we chose querying by example. With this type of query, the indexing problem is transformed into a definition of a distance between images in the database. The system calculates the similarity between the query and images in the database and returns a list of the images which are most similar to the query image.
2
1
1
2
) ( 1
) ,
(
m
d
j i
r param d param d
m j i
L
Where i is a query image, j is an image in the database, m is the total number of parameters (three), and each distance is a value between 0 and 1.
The image retrieval by content is carried out using queries with a combination of two features (color and texture). The overall function for similarity between the quadtrees for two images is a weighted sum of the two distances Dist(color) and Dist(texture):
where w represents the weight, a value between 0 and 1 (default value = 0.5), Dist (color) represents formula (3), and Dist (texture) represents formula (9).
9
Experiment and Results
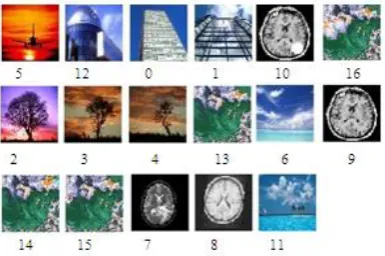
Our experiment uses a series of images which differ in content, format, and size. This diversity and heterogeneity can simulate the situations which are encountered in the case of a generalist base; Figure 7 has a reduced set to assess the quality of classificationand Figure 8 presents the results generated by the application of the PAM algorithm
Figure 7. Example of images database.
Figure 8. Classification result by the PAM method (V Distance and random initialization). Distance = w* Dist (color) + (1-w)*Dist (texture) (10)
We note that the set of starting medoïds had three similar images (11, 0, 6), and therefore the classification was disrupted, which explains the presence of a misclassified image in Class 1 (Image 12).
To improve these search results, we propose an algorithm to select a good initial partition.
9.1
Initialization problem
The principal limitation of partitioning methods is the dependence of the results on the initialization. In effect, each initialization corresponds to a different solution, and in some cases, these may be very far from the optimal solution. A naive solution to this problem is to run the algorithm several times with different initializations and retain the best clustering which is found. The use of this solution is limited, however, because of its cost and, as we will show, a better partition can be found in a single execution.
The search for good initial values is difficult because the set of possible values is very large; for this reason, we propose an initialization strategy based on the most individuals misclassified. In this strategy, the closer an object is to its nearest cluster, the greater the probability that the object belongs to this cluster. Conversely, the object that is farthest from the nearest cluster would be misclassified by this cluster and is therefore certainly a good candidate to form the centre of a new cluster.
Figure 9. Choice of starting values.
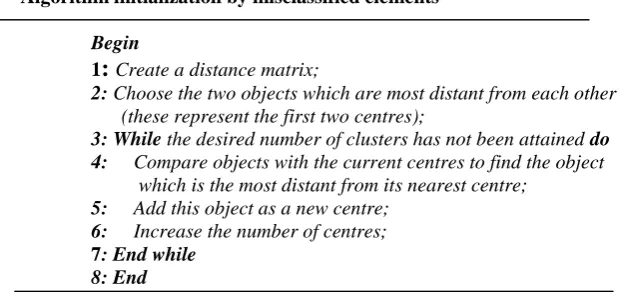
The centres (other than the first two) are therefore chosen one by one, as follows. The first two centres are the two most distant objects, ensuring the separability of the data during the classification. The other centres are drawn from the dataset: Each object is compared to all existing centres, and the object which has the greatest distance from the closest centre will be chosen as the centre for a new cluster. The following algorithm illustrates this.
Algorithm initialization by misclassified elements
Begin
1
:
Create a distance matrix;
2: Choose the two objects which are most distant from each other (these represent the first two centres);
3: While the desired number of clusters has not been attained do 4: Compare objects with the current centres to find the object
which is the most distant from its nearest centre; 5: Add this object as a new centre;
6: Increase the number of centres;
7: End while 8: End
The advantage of this technique is that it is independent of the clustering method and the chosen distance measure. The choice of the farthest values allows maximization of the inertia between classes. Thus, minimization of the inertia between classes is ensured by the clustering algorithm.
results of PAM. We note that the results produced by this algorithm have been improved by the good choice of an initial partition.
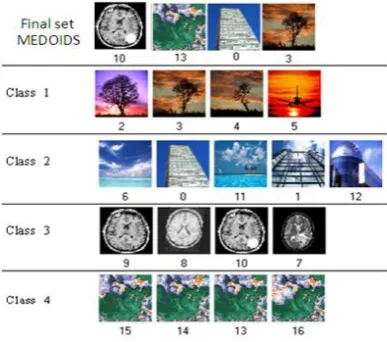
Figure 10. The images chosen by the initialization
Figure 11. Classification result improved by PAM
We ran the PAM algorithm for different numbers of clusters k, and for each value of k we calculated the execution time and the quality of the results based on the Davies-Bouldin (DB) index [38] , This index calculates the average quality of a partition using the average errors for each cluster and the distances between the centres of the clusters; it is defined as:
n
i i j
j n i n j
i SQ Q Q S Q S n
DB
1 ,
) ( max
1 (11)
Where n is the number of clusters, Snis the average distance of each object in a cluster to the cluster centre, and S(Qi, Qj) is the distance between the cluster centres. Hence, the ratio is small if the clusters are compact and far from each other. Consequently, the DB index should have a small value for a good clustering.
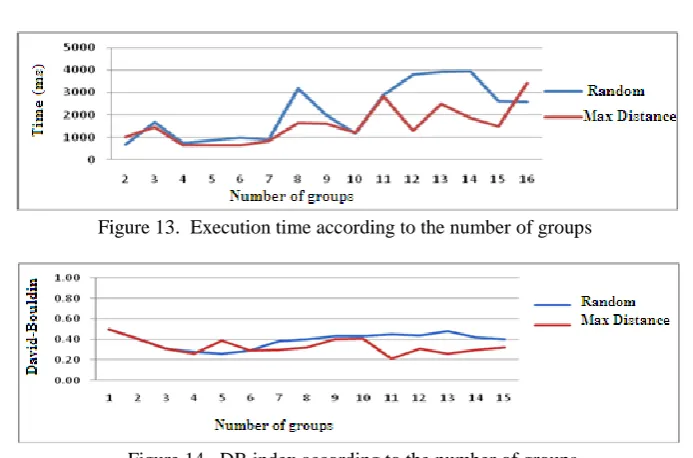
Our experiment shows that the time required for running the initialization algorithm depends strongly on the number of objects to be classified. The influence of the number of classes on time is negligible because the first step of the algorithm (finding the faraway centres), accounts for about 99% of the initialization time.
Figure 12. Influence of number of clusters on the initialization time (set of 2591 data).
It makes the clustering result deterministic. It makes the algorithm converge more quickly.
It guarantees good clustering: whereas a random initialization leads to a random outcome which can be good or bad clustering, our approach leads to a result which represents an acceptable local optimum.
Figure 13. Execution time according to the number of groups
Figure 14. DB index according to the number of groups.
The choice of a misclassified element as the initial representative of a cluster allows the discovery of small clusters, which may be more important in some cases, while random initialization can penalize such groups.
9.2
Search time
We measured the time required for retrieving or adding an image in a generic quadtree and for loading an image stored in a quadtree. The results were as follows:
Table 2: Reading time and writing an image following the structure used (ms).
Image 1 : 38021 Nodes Image 2 : 4633 Nodes Structure GQT QuadTree GQT QuadTree reading(ms) 900068,13 9,59 5653,24 4,85
writing(ms) 533202,36 37,25 68299 4,48
These results have motivated us to further promote the use of quadtrees for image storage because they also reduce the memory needed to store images without affecting system performance.
We measured the time needed to run a query image on an image database organized in clusters, and we compared this with the time consumed in the case of a mono cluster architecture. The image database we chose contains 147 images, and for each test we varied the number of clusters from 2 to 40. This allowed us to evaluate the improvement in the response time provided by our proposed architecture.
Image query1 image query 2 image query 3
Figure 15. Images query The time to search the image database organized in a mono cluster was
Query 1 : 57650,85 ms ; Query 2 : 51002.24 ms ; Query 3 : 49215,29 ms.
Figure 16 shows the search times for the same image queries (Figure. 15) in a database organized in clusters.
Figure 16. The influence of the number of clusters on the search time. We see that the search time in clusters decreases when their number increases.
The global search time is less important than the quality of the results; for this reason our solution to the number of clusters was to fix a maximum dissimilarity between clusters, and any object which exceeds this value with respect to the nearest cluster must build its own cluster. This allowed us to not only maintain the high quality of the results, but also to balance the clusters.
9.3
Search example
Figure 17 shows an example of an image search in a database of 160 images organized in clusters by the PAM method. The similarity distances chosen are Q or V.
Figure 17. Query Image
Figure 18: Result of Query:
10
Conclusion
In this article, we have presented a system for CBIR. In order to improve query processing time, our system incorporates a PAM clustering technique to significantly organize the image database. The algorithm developed was tested and evaluated using a large number of natural images. Each image was represented by a quadtree.
Our experimental results show that application of the PAM clustering algorithm is limited by the initialization procedure of randomly choosing initial cluster centres. This procedure is less than optimal because it does not solve the problem of convergence to a local minimum, and the search segmentation differs each time the algorithm is applied.
This motivated us to propose to use two optimization mechanisms. The first one determines the optimal number of clusters in the offline phase and controls the searching results in the online phase by setting a maximum dissimilarity between an image and its cluster representative. The second mechanism is an initialization algorithm which improves the results of clustering; it can be used for any clustering algorithm which requires initialization (EM, K-Means). Our experiments show that the organization of the clusters reduces search time and also maintains the quality of searches when the segmentation is good.
REFERENCES
[1] J.Landre, "Multiresolution analysis for search and indexing of the images contained in the database", PhD Thesis, University of Burgundy (UFR), 2005.
[2] A.K.Jain and M.Tuceryan, "Texture analysis", chapter 11 in the Handbook of pattern Recognition and computer vision by C.H.Chen 1992.
[3] G.Lu "An Approach to Image Retrieval Based on Shape", Journal of Information Science, 3(2): pages 119-127, 1997.
[4] Kaufman.L , and Rousseeuw.P.J . Finding Groups in Data: an Introduction to Cluster Analysis. John Wiley & Sons. 1990
[5] S. Berreti, A. D. Bimbo, and E. Vicario. ―Weighted walkthroughs between extended entities for retrieval by spatial arrangement”, IEEE Transactions on Multimedia, 5(1): pages 52–70, 2003.
[6] M. D. Mariscoi, L. Cinque, and L. Levialdi. ―Indexing pictorial documents by their content: a survey of current techniques”, Image and Vision Computing, 15(2): pages 119– 141, 1997.
[7] A. Natsev, R. Rastogi, and K. Shim. WALRUS:‖ a similarity retrieval algorithm for image databases”, IEEE Transactions on Knowledge and Data Engineering, 16(3): pages 301–316, 2004.
[8] G. Petrakis, A. Diplaros, and E. Milios. ―Matching and Retrieval of Distorted and Occluded Shapes Using Dynamic Programming”, IEEE Transactions on Pattern Analysis and Machine Intelligence, 24(11):pages 1501–1516, 2002. doi>10.1109/TPAMI.2002.1046166
[9]. C. S. McCamy, H. Marcus, and J. G. Davidson, ―A color-rendition chart”, Journal of Applied Photographic Engineering 2(3), 1976.
[10] M. Miyahara, ―Mathematical transform of (r,g,b) color data to munsell (h,s,v) color data”, SPIE Visual Commun. Image Process. 1001, 1988.
[11] J. Wang, W.-J. Yang, and R. Acharya, ―Color clustering techniques for color-content-based image retrieval from image databases”, in Proc. IEEE Conf. on Multimedia Computing and Systems, 1997.
[12] M. Stricker and M. Orengo, ―Similarity of color images”, in Proc. SPIE Storage and Retrieval for Image and Video Databases, 1995.
[13] S.K. Vipparthi and S.K. Nagar, ―Color Directional Quinary Patterns for Content Based Indexing and Retrieval‖, Human-centric Computing and Information Sciences, 4(1): pages 1-13, 2014.
[15] H. Tamura, S. Mori, and T. Yamawaki, "Textural Features Corresponding to Visual Perception",’ IEEE Transaction on Systems, Man, and Cybernetics, SMC-8, pages 460-472. 1978.
[16] M.Galloway, M., ―Texture Analysis Using Gray Level Run Lengths”, Computer Graphics and Image Processing, Vol 4 pages 172-179. 1975
[ 17]D. Zhang and G. Lu ―Review of shape representation and description techniques,‖ Pattern Recognition, Vol. 37, pages1-19, 2004
[18] W. Y. Kim and Y. S. Kim ―A region based shape descriptor using Zernike moments,‖ Signal Processing: Image Communication, Vol. 16, pages 95-102, 2000 doi:10.1016/S0031-3203(01)00104-2
[19] M. Zhenjiang ―Zernike moment - based image shape analysis and its application‖, Pattern Recognition Letters, Vol. 21, pages 169-177. 2000
[20] A.Khotanzad, Y.H.Hong ―Invariant image recognition by Zernike moments‖, IEEE Transactions on Pattern Analysis and Machine Intelligence, 12(5), pages 489-498.1990
[21] J. D. Zhou, H. Z. Shu, L. M. Luo, W. X. Yu, (2002) ―Two new algorithms for efficient computation of Legendre moments‖, Pattern Recognition, 35(5), pages.1143-1152.2002. doi:10.1016/S0031-3203(01)00104-2 [22] P.S. Hiremath and J. Pujari, ―Content Based Image Retrieval using Color, Texture and Shape features‖,
International Conference on Advanced Computing and Communications (ADCOM), pages 780-784, 2007 [23] A.Jain, ―Data clustering: 50 years beyond K-Means,” Pattern Recognition Letters, 31(8), no. 8, pages 651 –
666, June 2010.
[24] J. Huang, S. R. Kumar, and R. Zabith, ―An automatic hierarchical image classification scheme‖, in ACM Conf. Multimedia, pages. 219–228.1998.
[25] H. Greenspan, J. Goldberger, and L. Ridel, ―A continuous probabilistic framework for image matching”, J. Comput. Vis. Image Understand., vol. 84, pp. 384–406, 2001.
[26] J. Chen, C. A. Bouman, and J. C. Dalton, ―Hierarchical browsing and search of large image databases‖, IEEE Trans. Image Process., 9(3): pages. 442–455,2002. DOI:10.1109/83.826781.
[27] S. Krishnamachari and M. Abdel-Mottaleb, ―Hierarchical clustering algorithm for fast image retrieval‖ , in Proc. SPIE Conf. Storage and Retrieval for Image and Video Databases VII, San Jose, CA, Jan. pages 427– 435.1999.
[28]H.SAMET. "The Design and Analysis of Spatial Data Structures", Addition Wesley, 1989.
[29]M. Manouvrier. "Objets de grande taille dans les bases de données", PhD Thesis University of Paris, 2000. [30] M.Rukoz, M.Manouvrier, and G. Jomier. « Delta-distance: a family of dissimilarity metrics between
multi-level feature vectors‖. Information Retrieval, Springer Netherlands ,9(6):633--655, Dec. 2006. DOI 10.1007/s10791-006-9011-7
[31] Arun K. Pujari, ―Data Mining Techniques‖, Universities Press (India) Ltd, 2001.
[32] Sanjay Silakari, Dr. Mahesh Motwani and Manish Maheshwari, ―Color Image Clustering using Block Truncation Algorithm‖, IJCSI International Journal of Computer Science Issues, 4(2): pages. 31-35, 2009. [33] Sibson, "SLINK: an optimally efficient algorithm for the single-link cluster method". The Computer Journal
(British Computer Society) 16 (1): 30–34.1973.
[34]Fisher, Douglas H. "Knowledge acquisition via incremental conceptual clustering". Machine Learning 2: 139–172.1987.
[35]Guha, S., Rastogi, R., Shim K. "CURE: An Efficient Clustering Algorithm for Large Data sets", Published in the Proceedings of the ACM SIGMOD Conference. 1998.
[36]Karypis G., Han E. H. and Kumar .V. ―CHAMELEON: A hierarchical clustering algorithm using dynamic modeling‖, IEEE Computer journal 32(8): 68-75, 1999
[37] J.B. Kruskal.‖Multidimensional scaling by optimizing goodness of fit to a non metric hypothesis”. Psychometrika 29(1):1-27, 1964