0 INTRODUCTION
Mineral wool is a fibrous material commonly used for thermal and acoustic insulation and can be divided into subtypes, such as stone and glass wool. The production process of mineral wool is highly complex as it includes many physical phenomena at different lengths and time scales. To produce high quality mineral wool, a good understanding and control of several production phases is required.
Mineral wool quality is most significantly affected by the ratio of different raw materials, homogeneity of melt that is turned into fibres, fiberization process, pneumatic transport and deposition of fibres into the primary layer [1]. Additional processes that follow include overlaying the primary layer into the secondary layer, compressing and heating it in a curing oven to polymerize the binder added to the fibres.
Nowadays, the most commonly used method of forming fibres is the pouring of melt on solid fast-spinning wheels with horizontal axes or pouring it into hollow perforated rotors with vertical axes. The first method is used mostly for stone wool and the second for glass wool. The fiberization process was a
subject of several experimental and numerical studies for both solid wheel spinners (Širok et al. [1] and [2], Westerlund and Hoikka [3]) and perforated rotors (Panda [4], Qin et al. [5] and [6], Kraševec et al. [7] and [8]).
After fibres are formed, they are pneumatically transported by means of blow-away and suction airflows to the continuously moving accumulation grid where the primary layer of mineral wool is formed [1]. A good quality primary layer is defined by a low degree of spatial fluctuations in the thickness and density of the fibre deposit, and is very important for achieving the optimal insulation and mechanical properties of end products [1]. Thus far, measurement of aerodynamic characteristics and flow visualization were the main experimental approaches to investigating the primary layer formation process due to the high complexity of the multiphase nature of the flow.
The pneumatic transport of fibres in an axial airflow was modelled numerically by Lin et al. [9] and experimentally by Capone et al. [10] and Qi et al. [11]. In these studies, fibres were modelled as rigid bodies with relatively low aspect ratio (i.e. length to diameter ratio). Širok et al. [1] showed that mineral wool fibres
The Influence of Airflow Characteristics and Accumulation
Grid Velocity on the Formation of a Stone Wool Primary Layer
Peternelj, M. – Bizjan, B. – Širok, B.
Marko Peternelj* – Benjamin Bizjan – Branko Širok University of Ljubljana, Faculty of Mechanical Engineering, Slovenia
In this paper, the industrial process of stone wool primary layer formation has been investigated. The blow-away airflow, collecting chamber suction pressure, and peripheral velocity of collecting member effects on primary layer area density have been investigated. In total, 27 operating points have been measured by means of primary layer visualization. Computer-aided visualization has been carried out by two digital cameras. Each operating point was monitored at two locations: the first one at the beginning of fibre accumulation, forming the primary layer, and the secondary one at the end of the formation zone. The mass attenuation coefficient was calculated for each operating point and then used to calculate the primary layer area density. It was determined that primary layer bulk density distribution and primary layer texture are significantly influenced by accumulation grid peripheral velocity and blow-away airflow; however, suction pressure has a less pronounced effect on those characteristics. At the highest accumulation grid velocity and blow-away flow rate, the area density was 37 % lower than at the lowest grid velocity and blow-away flow, with a corresponding increase in a standard deviation of 750 %. Multiple regression models suggest very good agreement with the measured data (R2 = 0.94 to 0.98).
Keywords: mineral wool, fibre, primary layer formation, spinner, collecting chamber, pneumatic transport
Highlights
• Mineral wool primary layer formation has been investigated at a large-capacity industrial plant. • Primary layer was observed at its formation stage and at the end, where it is completely formed.
• Primary layer bulk density distribution, its standard deviation, and texture are significantly affected by accumulation grid peripheral velocity and blow-away airflow.
• A very good correlation (0.944 < R2 < 0.976) between measured data and multiple regression models for primary layer bulk
typically have aspect ratios in excess of 1000, leading to complex flows with mutual intertwining and breakage of fibres, and also inhomogeneous primary layer deposited on the accumulation grid. Other experiments and monitoring of production process in the stone wool industrial environment were conducted
by Blagojević et al. [12] and Bajcar et al. [13] who developed quantitative measures for the monitoring of the primary layer quality.
Numerous measures have been proposed to homogenize the blow-away flow velocity field by improved aerodynamic geometry of collecting chamber which reduce vortices and recirculation (Peternelj et al. [14]). Adding centrifugal rotors to the spinner wheels were proposed by Širok et al. [1] to reduce air velocity extremes at the accumulation grid, caused by the blow-away airflow.
This study was conducted as a further investigation of primary layer formation, already conducted by Bizjan et al. [15], where model spinning machine similar to the glass wool spinners was used. The primary layer formation in this study was investigated in an industrial stone wool plant and was also analysed by a visualization method, but at two stages simultaneously, first at the forming stage and second at the end of the formation zone. The primary layer quality was characterized by the bulk density distribution, its standard deviation and texture entropy. Multiple regression models were conducted to correlate the primary layer characteristics with the operating parameters.
Thus far, most experimental work on this subject was done in a laboratory environment in the form of
simplified models, and alternative working medium was used. The bulk density and its distribution is one of the most crucial parameters for high quality product from stone wool. The weighing scales normally used for measurement of the mineral wool mass flow are not suitable for measuring the mass of the primary layer, as it is thin and low density, traveling at high velocities and would have to be dynamically isolated from the surroundings, which is very difficult or even impossible to achieve in industrial environment. Furthermore, many weighing scales would have to be placed along the width of primary layer to obtain good measurement of bulk density distribution. The main novelty in this paper is the optical measurements of primary bulk density, not only at the end of the formation, but also from the very start of formation and to its end. This provides a clearer understanding of primary layer formation.
This paper is organized as follows. The experimental setup section describes the mineral wool primary layer formation and the experimental setup used to study this process. In the theoretical background section the primary layer visualization method used in our experiments is explained whereas in the results and discussion section, the qualitative and quantitative results of the primary layer image visualization analysis are presented.
1 EXPERIMENTAL SETUP
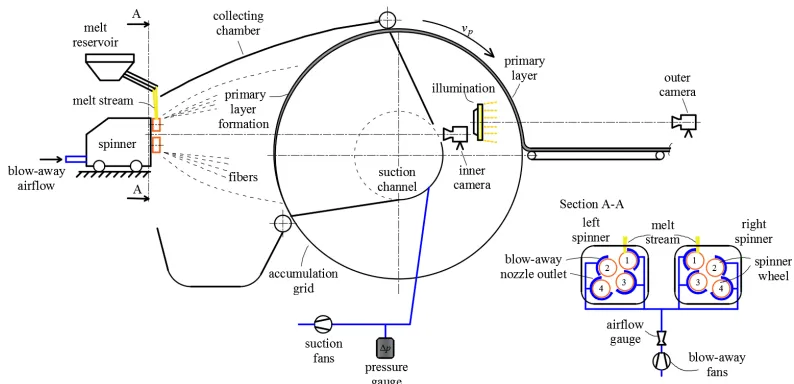
Measurements were conducted at an industrial stone wool production plant. Fig. 1 presents the experimental setup used; the longitudinal cross section of drum
type collecting chamber with fiberization machine and auxiliary systems is shown. Accumulation grid was a cylinder or drum type perforated sheet metal. Peripheral velocity of accumulation grid vp and consequently primary layer velocity was varied by a frequency inverter and was set to 88 m/min, 106 m/min and 124 m/min, respectively.
The fiberization machine consists of two symmetrical spinners, each equipped with four rotating wheels on a horizontal axis.
Melt is poured on the first wheel of each spinner where, due to centrifugal force, it is partially ejected to other wheels and partially transformed into ligaments. Around each wheel, a blow-away airflow nozzle is mounted to transport ligaments away from the wheel and turn them into solid fibres. Blow-away airflow is generated by radial fans. The total blow-away airflow was set to the range of 13.69 m3/s to 17.35 m3/s (Table 1).
Secondary (suction) airflow was achieved via suction fans, which are all connected to one suction channel. Suction airflow helps collecting fibres on the accumulation grid, where they form the primary layer. A pressure gauge was installed in the suction channel to regulate suction fans speed so that the pressure inside the channel remained constant during particular
operating points. Suction pressure Δp was set to the range of 500 Pa to 800 Pa.
Due to variations of the fibre mass flow rate, the secondary layer (overlapped primary layer) mass was measured using a weighing scale to calibrate light illumination absorption measuring method that was used later. The temperature of the ambient air during the experiments was between 0 °C and 10 °C. The temperature of the blow-away airflow was between 40 °C and 50 °C, and the temperature in the suction channel varied in the range of 35 °C to 50 °C. Due to the insignificant air temperature variability, the effects of temperature on the thermophysical properties of the air are not considered in this study. Temperature, dynamic viscosity, density and surface tension of melt were 1400 °C, 1.88 Pa·s [16], 2710 kg/m3 [17] and [18] and 0.41 N/m [19], respectively. The composition of input raw materials was not changed during experiments and the temperature of the melt from the furnace was also kept constant. The airflow velocity from blow-away nozzles was varied in the range of 100 m/s to 150 m/s, gradually decreasing to the range of 4 m/s to 10 m/s at the accumulation grid. Considering the blow-away flow as an example of a flow around a cylinder, the Reynolds number can be estimated to the order of magnitude of 107 in
the entire pneumatic transport zone, meaning that the flow is turbulent everywhere.
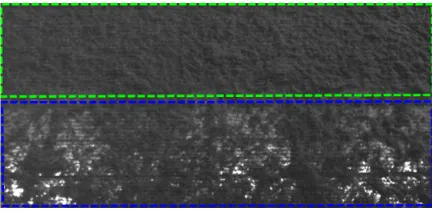
Fig. 2 shows the final primary layer structure when it exits the collecting chamber. On the top and bottom of the image, nonilluminated (lower green rectangular) and illuminated (upper blue rectangular) areas are marked. Illumination was achieved by a light source from the inside of the accumulation grid facing to the acA800-200gc Basler outer camera. Fourteen LED lights in a side-by-side arrangement were used for this purpose. Each light required 100 W of electric power. 200 mm away from LED lights, a light diffusion plastic sheet was mounted to create a homogenous light source. Images were taken by the inner and the outer camera which both recorded at 10 frames per second.
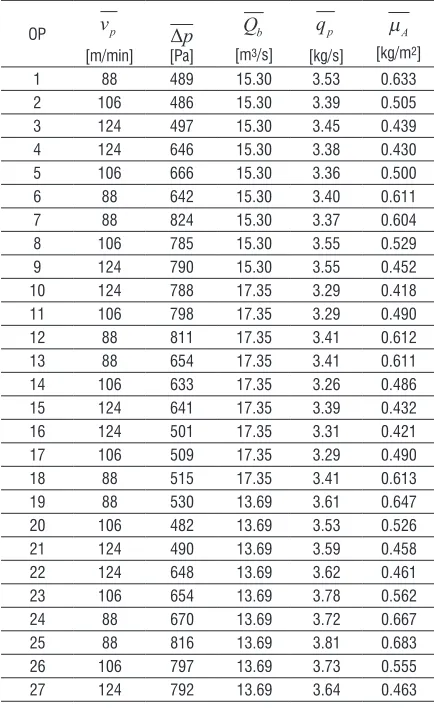
Table 1 provides the 27 operating points obtained by all possible combinations of operating parameters.
Fig. 2. Illuminated (blue (lower) frame) and nonilluminated (green (upper) frame) area of final primary layer
After steady state conditions of production had been achieved, measurement of the first operating point started. After 4 minutes, the values for the next operating point were set. To minimize the effect of transition between operating points due to the high inertia of fans, the accumulation grid peripheral velocity vp had been changed most frequently,
Table 1. Actual mean values of measured operating parameters for all operating points
OP vp
[m/min] Δ[Pa]p
Qb
[m3/s] qp
[kg/s]
µA p
p q v B
= ,
[kg/m2]
1 88 489 15.30 3.53 0.633
2 106 486 15.30 3.39 0.505
3 124 497 15.30 3.45 0.439
4 124 646 15.30 3.38 0.430
5 106 666 15.30 3.36 0.500
6 88 642 15.30 3.40 0.611
7 88 824 15.30 3.37 0.604
8 106 785 15.30 3.55 0.529
9 124 790 15.30 3.55 0.452
10 124 788 17.35 3.29 0.418
11 106 798 17.35 3.29 0.490
12 88 811 17.35 3.41 0.612
13 88 654 17.35 3.41 0.611
14 106 633 17.35 3.26 0.486
15 124 641 17.35 3.39 0.432
16 124 501 17.35 3.31 0.421
17 106 509 17.35 3.29 0.490
18 88 515 17.35 3.41 0.613
19 88 530 13.69 3.61 0.647
20 106 482 13.69 3.53 0.526
21 124 490 13.69 3.59 0.458
22 124 648 13.69 3.62 0.461
23 106 654 13.69 3.78 0.562
24 88 670 13.69 3.72 0.667
25 88 816 13.69 3.81 0.683
26 106 797 13.69 3.73 0.555
27 124 792 13.69 3.64 0.463
In Fig. 3,three sample images of the illuminated primary layer are shown for different operating settings. A significant effect of the operating parameters on the primary layer structure can be seen. In Fig. 3a, the lowest accumulation grid velocity and blow-away airflow is used at the maximum suction pressure, resulting in the most uniform bulk density distribution of primary layer. From Fig. 3a to c, the accumulation grid velocity and the blow-away airflow are increased, while the suction pressure is decreased, causing larger inhomogeneities in this order.
Fig. 4 shows three images of the primary layer formation on the accumulation grid for the same operating points as shown in Fig. 3. On each image two darker zones can be seen which are caused by higher fibre density in front of each spinner. Accumulation grid movement direction is shown and according to image gray level intensity, the primary layer density increases from the bottom to the top.
Fig. 3. Illuminated primary layer image taken by outer camera at operating points; a) vp1 – Δp3 – Qb1; b) vp2 – Δp2 – Qb2;
c) vp3 – Δp1 – Qb3
Fig. 4. Primary layer image taken by inner camera at operating points; a) vp1 – Δp3 – Qb1; b) vp2 – Δp2 – Qb2;
c) vp3 – Δp1 – Qb3
2 THEORETICAL BACKGROUND
The illuminated area in the image was horizontally split into 21 subsections (Fig. 5) and for each subsection, the average gray level Iill,ijwas calculated, where index i states image in a sequence and j
subsection from the left to right side of the image.
Fig. 5. Illuminated area subsections
To include background light variations, an additional area of the image was taken just below the illuminated area, where an average referenced gray level Iref,ij was calculated. As the grayscale images taken are 8-bit there are 256 gray levels and corrected gray level Iij can be defined as:
I I I
I
ij ill ij ref ij
ref ij
= −
(
−)
− 1
255 , ,
,
, (1)
and the normalized gray level as:
I I
n I
n ij ij
j n
ij
, = .
=
∑
1 1
A linear correlation between the normalized gray level In,ij and the primary layer area density μA,ij was used:
µA ij, =�µA⋅In ij, , (3) where µA p
p q v B
= ,
is the average primary layer area density:
µA p
p
q v B
= , (4)
and qp, νp and B are the measured average mass flow rate, velocity and width of primary layer, respectively. The primary layer area density in normalized form is then:
µ µ
µ
n ij A ij
A n ij
I
, ,
, .
= = (5)
To analyse the primary layer area density µA in formation stage, the Beer-Lambert law was used:
µ
α
A i j i j 0
m
I I
, ,
,
ln( / )
,
= (6)
where µ
α
A i j i j 0
m
I I
, ,
,
ln( / )
,
= is the temporally averaged gray level of the observed section, I0 is the grey level of image background (accumulation grid without fibres) and
α = 5.8 m2/kg is the mean mass attenuation coefficient, calculated for the illuminated primary layer observed with the inner camera.
3 RESULTS AND DISCUSSION
3.1 Primary Layer Mass Distribution Analysis
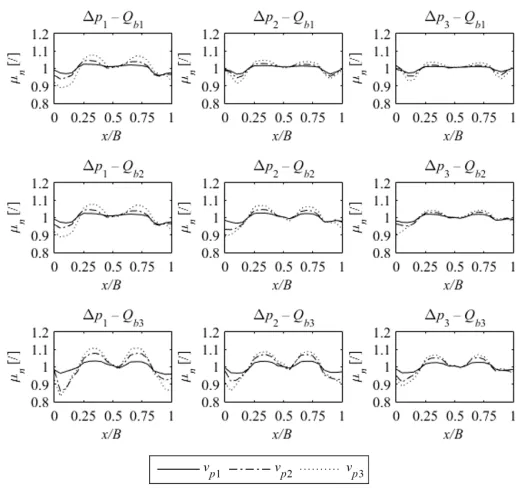
Fig. 3 displays 9 diagrams showing the relationship between the normalized primary layer area density
µn and the normalized coordinate x/B at different operating points. There are three curves on each diagram representing the normalized primary layer area density µn at different accumulation grid velocity vp , specific suction pressures Δp and blow-away airflows Qb. Diagrams are arranged so that the
intensity of suction pressure Δp increases from left to right, and the intensity of blow-away airflow Qb increases from top to bottom.
By comparing different operating parameters, it can be concluded that in all cases the normalized primary layer area density µn is significantly larger at intervals 0.2 < x/B < 0.4 and 0.6 < x/B < 0.8 where a convex shaped curve is formed with the maximum value at the middle of each interval. This increase is caused by the position of the spinner at this coordinate. Due to the higher concentration of fibres coaxially from the spinner, the primary layer area density µA is increased at those areas. At remaining intervals, a concave shaped curve is formed with the minimum value also approximately in the middle of each interval.
For all diagrams, it can be concluded that the increase of accumulation grid velocity vp, increases differences between maximum and minimum normalized primary layer area densities, which can be explained by the fact that a faster accumulation grid causes thinner primary layer inside the collecting chamber and the area on the accumulation grid directly in front of the spinner is less filled by fibres, and the airflow with fibres is not redirected on accumulation grid sides.
A similar effect can be seen by increasing the blow-away airflow Qb, especially in the first column of diagrams, where the blow-away airflow Qb inside the collecting chamber is increased from top to bottom. In this case, the increase between extreme normalized primary layer area densities can be explained by the fact that the coaxial velocity of the blow-away airflow is significantly higher at the spinner centre and it quickly decreases when moving transversally to off-centre positions. Consequently, at high blow-away airflows, the main fibre flow is concentrated closer to the spinner centre projected horizontally to the accumulation grid, and at its high vp, this effect is additionally magnified. This can be seen in the bottom
left diagram (Δp1 = 500 Pa, Qb3 = 17.35 m3/s), where at the accumulation grid velocity vp3 = 124 m/min, difference between µn,max and µn,min is about 25 %.
An increase of suction pressure Δp decreases the primary layer area density fluctuations along coordinate x as can be seen comparing diagrams from left to right. This is due to the fact that the airflow field caused by suction fans varies less in the transversal direction on the accumulation grid compared to coaxial blow-away airflow out of the spinner nozzles.
Increasing the suction pressure Δp homogenizes the flow velocity field in the collecting chamber, causing fibres to spread more evenly along the width of the accumulation grid (coordinate x).
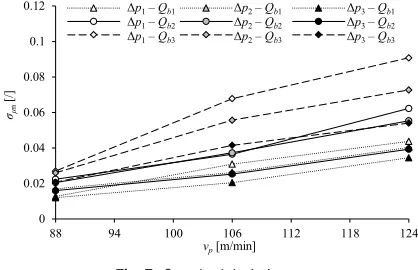
For a more in-depth comparison of the results presented in diagrams in Fig. 6, σµn is defined as a standard deviation of the normalized primary layer area density µn, where µn is a function of the normalized coordinate x/B. Results are presented in Fig. 7 where a relation between standard deviation
σµn and operating parameters settings are shown. It can be concluded that an increase of the accumulation grid velocity and of the blow-away airflow leads to a larger inhomogeneity of the primary layer area density along the width of the accumulation grid. In contrast, an increase of the suction pressure improves the homogeneity of the primary layer area density distribution.
0 0.02 0.04 0.06 0.08 0.1 0.12
88 94 100 106 112 118 124
σμn
[/]
vp[m/min]
Δp1–Qb1 Δp2–Qb1 Δp3–Qb1
Δp1–Qb2 Δp2–Qb2 Δp3–Qb2
Δp1–Qb3 Δp2–Qb3 Δp3–Qb3
Fig. 7. Standard deviation σµn
3.2 Primary Layer Formation inside Collecting Chamber
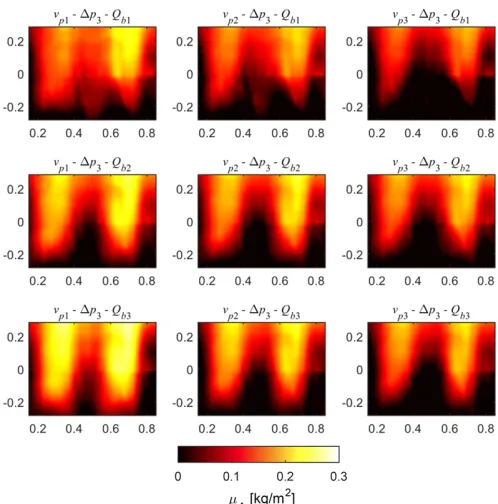
In Fig. 8 there are 9 diagrams of area density µA distribution at the forming stage in the collection chamber. The diagrams are arranged so that the parameter vp increases from left to right and Qb from top to bottom. As it turns out, these two parameters have the most significant influence on area density
distribution so parameter Δp is constant for all diagrams in Fig. 8. By a qualitative comparison of diagrams, one can conclude that by increasing accumulation grid velocity, area density µAdecreases and the bottom area with almost no fibre is increased. This area of fibre-free accumulation grid also represents energy losses due to suction flow through this area. At the topright diagram (vp3 – Δp3 – Qb1) around half of the observed area is practically without fibres. By increasing the blow-away airflow, the area density µA increases at spinner centre vertical planes (x/B ≈ 0.3 and x/B ≈ 0.7). This effect is clearly visible
in the bottomleft diagram, representing lowest vp and highest Qb operating points.
3.3 Texture Analysis of the Primary Layer
The image texture was analysed using the image entropy function, which is a statistical measure for randomness [20]. At high values of entropy, more random texture of primary layer is expected compared to low entropy values where the primary layer texture is more uniform and homogenous. Image grayscale entropy is defined as:
E p p
k M
k k
= −
=
∑
0 2
log ( ), (7)
chosen to calculate the entropy E. Furthermore, the mean value of entropy E (Eq. (7)) for each operating point was calculated and normalized to its maximum value (Eq. (8)).
E E
E
n OP OP
OP
,
, ,
=
max
(8)
The dimensional entropy E (Eq. (7)) was affected not only by the layer texture itself, but also by the mean brightness level, which varied slightly between operating points. The entropy E was normalized to its maximum value to eliminate brightness level variations, so direct comparison between operating points was possible. Results are presented in diagram in Fig. 9, where we can see that by decreasing suction pressure and even more significantly by increasing accumulation grid velocity, normalized entropy En decreases, meaning that the primary layer texture is less random.
At the lowest accumulation grid velocities, minimum entropy is obtained at medium blow-away airflow in all three cases of suction pressure, however, in all other cases normalized entropy decreases by increasing the blow-away airflow. According to the image grayscale, normalized entropy En maximum and minimum randomness of primary layer texture
is obtained at operating parameters vp1 – Δp3 – Qb1 (En = 0.34) and vp3 – Δp1 – Qb3 (En = 0.13), respectively.
0.1 0.15 0.2 0.25 0.3 0.35 0.4
88 94 100 106 112 118 124
En
[/]
vp[m/min]
Δp1–Qb1 Δp2–Qb1 Δp3–Qb1
Δp1–Qb2 Δp2–Qb2 Δp3–Qb2
Δp1–Qb3 Δp2–Qb3 Δp3–Qb3
Fig. 9. Normalized entropy
Higher normalized entropy at lower accumulation grid velocities can be explained by the fact that at low accumulation grid velocity, the area in front of the spinner has a high fibre concentration and consequently, a lower permeability. Coaxial blow-away airflow starts to tear apart the already formed primary layer and forming bigger clusters of fibres. As the accumulation grid velocity increases, the permeability of the accumulation grid increases, causing a finer and homogenous texture, indicated by low normalized entropy as a parameter.
To investigate texture dynamics, the DC component of entropy was eliminated from the signal so only the AC component was retained. A low-pass filter was used to reduce the high frequency noise in the signal. Power spectra are shown in Fig. 10, where peak amplitude is visible at low frequencies (bellow 0.2 Hz) and can be correlated with accumulation grid angular frequency and its multiples.
Fig. 10. Power spectrum of AC component of entropy En for three operating points
3.4 Multiple Regression Models
A strong correlation between operating parameters
(Δp, Qb, vp and qp) and primary layer characteristic properties (µA p
p
q v B
= ,
, σµn and En) is expected and the power law multiple regression models (Eq. (9)) were used to evaluate the effect of each parameter.
Πi i bp ∆ bc d pe
a v Qi i p qi i
= ⋅ ⋅ ⋅ ⋅ . (9)
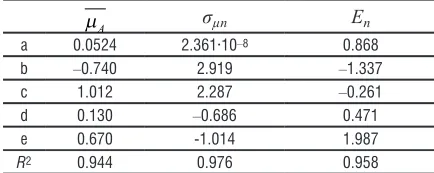
The exponents ai – eiwere determined by fitting the power law models in Eq. (9) to the measured data. The results are presented in Table 2, Figs. 11 to 13 where it is evident that most of the measurements are in good agreement with the proposed model.
Table 2. Regression model constant values
µA p p
q v B
= , σµn En
a 0.0524 2.361·10–8 0.868
b –0.740 2.919 –1.337
c 1.012 2.287 –0.261
d 0.130 –0.686 0.471
e 0.670 -1.014 1.987
R2 0.944 0.976 0.958
0.00 0.04 0.08 0.12 0.16 0.20
0.00 0.04 0.08 0.12 0.16 0.20
µA
(m
ode
l) [k
g/
m
2]
µA(measured) [kg/m2]
R2= 0.944
Fig. 11. Correlation between measured and modelled values of mean µA at observed forming stage
0.00 0.02 0.04 0.06 0.08 0.10
0.00 0.02 0.04 0.06 0.08 0.10
σµn
(m
ode
l) [
/]
σµn(measured) [/]
R2= 0.976
Fig. 12. Correlation between measured and modelled values of σµn of completely formed primary layer
0.00 0.10 0.20 0.30 0.40
0.00 0.10 0.20 0.30 0.40
En
(m
ode
l) [/
]
En(measured) [/]
R2= 0.958
Fig. 13. Correlation between measured and modelled values of Enof completely formed primary layer
4 CONCLUSIONS
area density was quantified with the light absorption method.
The area density, which should be as low and as uniform as possible, was found to significantly depend on all observed operating parameters (vp, Δp and Qb). A local increase in area density is caused by the higher intensity of the blow-away airflow, which causes an intense fibre concentration coaxially from the spinner. Lower and more uniform area density is achieved at higher accumulation grid velocities vp. However, high
vp cause smaller suction flow yield, because a large portion of the accumulation grid in the collecting chamber remains free of fibres, resulting in the suction flow passing this area. Another important measure for the primary layer quality is the homogeneity of its structure, which was quantified by the normalized standard deviation (σµn) of the layer area density and by the layer entropy (En). A low value of σµn and En is desired as it implies a good uniformity of the primary layer thickness and structure. It was determined that
σµn increases at higher vp and Qb and decreases at
higher Δp. However, the opposite trend was found for the layer entropy En, which decreases at higher vp and
Qb and increases at higher Δp. For all estimators, multi-regression models were carried out, where a very good agreement between measured data and model was obtained: RµA
2
0 944
= . , R n σµ
2
0 976
= . and
REn 2
0 958
= . .
Further experimental and numerical observations of the primary layer formation process will improve proposed models and implementing them into process control automatization in order to produce higher quality insulation materials with less energy and raw material consumed.
5 NOMENCLATURE
B accumulation grid width, [m]
E image grayscale entropy, [/]
En normalized image grayscale entropy, [/]
I0 gray level of image background, [/]
Iill gray level of image illuminated, area, [/]
In normalized gray level, [/]
Iref reference gray level, [/]
M number of gray levels, [/]
pk probability associated with gray level k, [/]
Qb total blow-away airflow, [m3/s]
Qin inner blow-away airflow, [m3/s]
Qout outer blow-away airflow, [m3/s]
qp primary layer mass flow rate, [kg/s]
vp accumulation grid peripheral velocity, [m/min]
x distance from left image edge, [m]
y distance from bottom image edge, [m]
α mass attenuation coefficient, [m2/kg]
Δp suction pressure, [Pa]
µA primary layer area density, [kg/m2]
µn normalized primary layer area density, [/]
σµn standard deviation of µn, [/]
6 REFERENCES
[1] Širok, B., Blagojević, B., Bullen, P. (2008). Mineral Wool: Production and Properties. Woodhead Publishing, Cambridge,
DOI:10.1533/9781845694456.
[2] Širok, B., Blagojević, B., Novak, M. (2002). Influence of blow away velocity field on the primary layer fibre structure in the mineral wool production process. Glass Technology, vol. 43, no. 5, p. 188-194.
[3] Westerlund, T., Hoikka, T. (1989). On the modeling of mineral fiber formation. Computers & Chemical Engineering, vol. 13, no. 10, p. 1153-1163, DOI:10.1016/0098-1354(89)87018-8. [4] Panda, S. (2006). The Dynamics of Viscous Fibers. PhD
Thesis, TU Kaiserslautern, Kaiserslautern.
[5] Qin, Y., Lv, X., Bai, C., Chen, P., Qiu, G. (2013). Dry granulation of molten slag using a rotating multi-nozzle cup atomizer and characterization of slag particles. Steel Research International,
vol. 84, no. 9, p. 852-862, DOI:10.1002/srin.201200325. [6] Qin, Y., Lv, X., Bai, C., Chen, P., Qiu, G., Jie, Z. (2014).
Mechanism of dry molten slag granulation using a rotating multi-nozzle cup atomizer. Steel Research International, vol.
85, no. 1, p. 44-52, DOI:10.1002/srin.201300007.
[7] Kraševec, B., Širok, B., Hočevar, M., Bizjan, B. (2014). Multiple Regression Model of Glass Wool Fibre Thickness on a Spinning
Machine. Glass Technology, vol. 55, no. 4, p. 119-125.
[8] Kraševec, B., Širok, B., Bizjan, B., Hočevar, M. (2015). Fibre
density distribution in a layer of glass wool. Glass Technology,
vol. 56, no. 5, p. 145-152.
[9] Lin, J.Z., Liang, X.Y., Zhang, S.L. (2012). Numerical simulation
of fiber orientation distribution in round turbulent jet of fiber
suspension. Chemical Engineering Research and Design, vol.
90, no. 6, p. 766-775, DOI:10.1016/j.cherd.2011.09.016. [10] Capone, A., Romano, G.P., Soldati, A. (2015). Experimental
investigation on interactions among fluid and rod-like particles in a turbulent pipe jet by means of particle image velocimetry.
Experiments in Fluids, vol. 56, paper no. 1, DOI:10.1007/ s00348-014-1876-4.
[11] Qi, G., Nathan, J.G., Lau, C.W.T. (2015). Velocity and orientation distributions of fibrous particles in the near-field of a turbulent
jet. Powder Technology, vol. 276, p. 10-17, DOI:10.1016/j. powtec.2015.02.003.
[12] Blagojević, B., Širok, B., Hočevar, M. (2003). Monitoring and control of quality of the primary layer of mineral wool on a disc spinning machine. Instrumentation Science & Technology, vol.
31, no. 1, p. 67-80, DOI:10.1081/CI-120018408.
[13] Bajcar, T., Blagojević, B., Širok, B., Dular, M. (2007). Influence of flow properties on a structure of a mineral wool primary
layer. Experimental Thermal and Fluid Science, vol. 32, no. 2, p. 440-449, DOI:10.1016/j.expthermflusci.2007.05.007. [14] Peternelj, M., Mihalič, P., Širok, B. (2015). Collecting chamber
[15] Bizjan, B., Peternelj, M., Širok, B. (2016). Mineral Wool Primary Layer Formation in Collecting Chamber. Strojniški vestnik - Journal of Mechanical Engineering, vol. 62, no. 3, p. 179-186,
DOI:10.5545/sv-jme.2015.2995.
[16] Urbain, G. (1987). Viscosity estimation of slags. Steel Research International, vol. 58, no. 3, p. 111-116, DOI:10.1002/ srin.198701513.
[17] Bottinga, Y., Weill, D., Richet, P. (1982). Density calculations for silicate liquids. I. Revised method for aluminosilicate compositions. Geochimica et Cosmochimica Acta, vol. 46, no. 6, p. 909-919, DOI:10.1016/0016-7037(82)90047-3.
[18] Allibert, M., Gaye, H., Geiseler, J., Janke, D., Keene, B.J., Kirner, D., Kowalski, M., Lehmann, J., Mills, K.C., Neuschütz, D., Parra, R., Saint-Jours, C., Spencer, P.J., Susa, M., Tmar, M., Woermann, E. (2012). Slag atlas, 2nd ed., Verlag Stahleisen, Düsseldorf.
[19] Kucuk, A., Clare, A.G., Jones, L. (1999). An estimation of the surface tension of silicate glass melts at 1400 °C using
statistical analysis. Glass Technology, vol. 40, no. 5, p. 149-153.