EnginEEring and ginning
Operator Feedback System for the Module Builder
Robert G. Hardin IV
*and Stephen W. Searcy
R.G. Hardin IV, USDA-ARS, Cotton Ginning Research Unit, 111 Experiment Station Road, Stoneville, MS 38776; S.W. Searcy, Department of Biological and Agricultural Engineering, Texas A&M University, 2117 TAMU, College Station, TX 77843
*Corresponding author: [email protected] aBSTraCT
Properly constructed cotton modules can prevent reduced lint value and increased ginning costs after significant rainfall occurs. Modules should be constructed with a convex top surface so that water will not collect on the module cover. Many modules are constructed with undesirable shapes because operators are inexperienced, must quickly construct modules, and have difficulty estimating the mass of cotton at various locations in the module. The objectives of this research were to design a system that would provide the operator an image of the predicted module shape, evaluate the accuracy of the system in predicting module shape, and determine the usefulness of this system. Final module shape was predicted by determining the height of the compressed cotton along the length of the module and this shape was graphically displayed for the operator. The display assisted the operator in moving cotton to appropriate locations for creation of desirably shaped modules. The heights of modules constructed with and without the feedback system were measured. The system correctly predicted the height with 67% accuracy. Use of the feedback system resulted in a 55% reduction in water collection area on the top surface of modules. Module builder operators indicated that the system was useful. The module builder feedback system is a simple and inexpensive tool that has the potential to provide rapid payback for producers.
INTRODUCTION
M
aintaining seed cotton quality during storage is a major concern for cotton producers andginners. Serious economic losses can result from moisture damage to seed cotton stored in modules (Parish and Shelby, 1974; Curley et al., 1988;
Simpson and Searcy, 2005). If significant rainfall
occurs, the degree of quality loss is affected by the condition of the module cover and the shape of the module. Quality loss occurs when rain collects in depressions on top of the module and leaks through the cover. New module covers
have significant resistance to water penetration
but used covers are often damaged and no longer waterproof (Simpson and Searcy, 2008). Weathering and rough handling of the covers over several years of use reduces the resistance of the cover material to water and creates holes, allowing water to leak into the cotton.
The module builder has been largely unchanged since its introduction by Wilkes and Jones (1973). The improved frame and transport wheel design by Orlando and Hendriks (1976) and the use of a hydraulic tramping cylinder (Johnston, 1976) have been incorporated in commercial designs. The chainless carriage drive, originally designed by Bass (1992), is offered as an option by module builder manufacturers. Automatic control systems similar to the original design by Shelby and Parish (1975) are also widely used on module builders. These systems do not include algorithms for distributing the cotton, requiring an operator to perform this task. Therefore, these systems can reduce labor, but the module shape remains solely dependent on the operator’s skill.
The economic loss due to decreased lint value of a poorly formed module has been estimated at over $200 per module if rainfall occurs, regardless of cover quality (Simpson and Searcy, 2005). Modules must be built with a shape that prevents collection
of rainwater to avoid significant economic losses.
However, a survey of Texas gins found that 50% of modules had depressions with evidence of water collection or the potential to collect water (Simpson and Searcy, 2004).
Several factors complicate this process. The operator has difficulty in visually estimating the mass of cotton in a particular location in the module, as certain regions may not have been compressed as much as other areas. Because the operator views the module surface from above, accurate assessment of differences in module
height is difficult, particularly at the end of the
module farthest from the operator platform. Visibility is also reduced when operating at night. Therefore, a system that provides information about module shape to the operator should result in convex shaped modules and consequently, higher quality lint and seed.
Hardin and Searcy (2008) concluded that more cotton must be placed in the center of the module to produce a convex top surface. If a greater mass of seed cotton is compressed under the tramper at one location in a module, then this region of
the module will have a greater final recovered
height than other areas of the module. Additional
compression of high areas will not significantly
affect the module shape. To properly construct a module, the operator must distribute the mass of cotton according to the desired module shape, moving cotton from areas with more mass into regions with less cotton. Therefore, a system that provides information about the relative mass of cotton in different areas of a module to the operator should assist in the construction of properly shaped modules that do not collect water.
Hardin and Searcy (2008) also demonstrated that with a constant force, the compressed height of seed cotton varies linearly with the mass of cotton compressed. The module builder tramper applies a constant maximum force to the seed cotton. Consequently, the compressed height of the cotton under the tramper when the maximum force is applied is proportional to the mass of cotton compressed. Measurements of the compressed height of seed cotton at multiple locations in the module could be used to predict module shape.
The goal of this study was to develop a system that provides information about module shape to the module builder operator while constructing modules. Modules should be built with a convex top surface to shed water. Since the operator can move cotton along the length of the module builder, this feedback system should indicate the predicted height of the module along its length. Using this information,
the operator could move cotton to the appropriate areas to produce a module with a convex shape. The objectives of this research project are to:
• Design a system to provide the operator an im-age of the predicted module shape based on the operator’s actions.
• Evaluate the accuracy of this system in predict-ing module shape.
• Evaluate the usefulness of the system to opera-tors and its effectiveness in improving module shapes.
MaTEriaLS and METHOdS
Feedback System Design. The following features were desired in the operator feedback system to facilitate adoption by cotton producers:
• Accurate prediction of module shape
• Inexpensive
• Easily retrofit to existing module builders • Simple to use
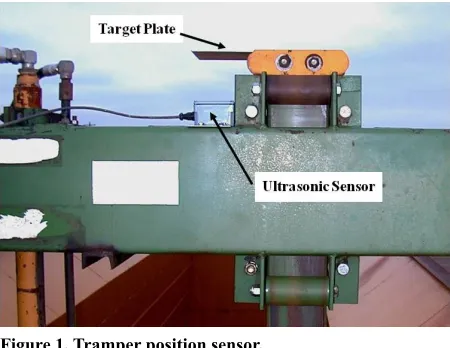
• Easily understood feedback on module shape Accurate prediction of module shape requires knowledge of the relative mass of cotton at different positions along the length of the module. Measurement of the minimum height of the tramper above the ground surface during compression provided information about the mass of cotton at that location in the module builder and was used to predict module shape. Determining the minimum height during a compression action required knowledge of the carriage and tramper positions. Sensors were installed on the module builder to record the position of these elements. Tramping strokes had to be differentiated from leveling actions, when the operator moved the tramper vertically and horizontally to redistribute cotton within the module builder. A microcontroller processed the sensor data and controlled an LCD display of the module shape.
Two 18 mm (0.71 in) diameter inductive proximity sensors (Automation Direct AK1-AN-3H, Cumming, GA) were used to track carriage motion (Figure 2). The sensors were mounted at the front of the module builder and detected a specially constructed apparatus mounted on the carriage drive shaft. This apparatus consisted of four steel teeth welded to each side of a split shaft collar. Each time a tooth passed the sensor, a pulse was produced. Counting the number of pulses indicated the distance the carriage had moved– 9.53 cm (3.75 in) per pulse. The two sets of teeth were offset 12° so that the direction of carriage travel was determined by comparing the sequence of values from the two sensors. The sensor mount was adjustable to create the optimum clearance between the sensors and the teeth for maximum accuracy.
Two 30 mm (1.2 in) inductive proximity sensors (Pepperl+Fuchs NBB10-30GM50-E2-V1, Twinsburg, OH) were previously installed on the module builder as part of an automatic tramping system and used to provide an absolute position reference for the carriage. These sensors detected when the carriage reached the front or rear of the module builder, preventing any position errors from accumulating.
The predicted module shape was displayed on a graphical LCD (Hantronix HDM64GS24L-2-Y10S, Cupertino, CA). An 8-bit microcontroller (Freescale M68HC11, Austin, TX) was used to process the sensor data and control the LCD. The LCD, microcontroller, and other electronics were contained in an enclosure mounted in the cab of the module builder (Figure 3). Several controls were provided for the operator – power switch, reset, LCD contrast adjustment, and LCD backlight switch. Table 1 shows the feedback system bill of materials and cost estimates.
Table 1. Feedback system bill of materials.
Component # Function Manufacturer Model Unit Cost
Ultrasonic sensor 1 Measure tramper height SensComp (Livonia, Mi) Mini-aE $75
18 mm proximity sensor 2 determine carriage
position
automation direct
(Cumming, ga) aK1-an-3H $25
30 mm proximity sensor 2 index carriage position
at ends
Pepperl+Fuchs
(Twinsburg, OH) nBB10-30gM50-E2-V1 $90
LCd 1 display module shape Hantronix (Cupertino, Ca) HdM64gS24L-2-Y10S $75
Microcontroller and
development board 1 data processing
Freescale (austin, TX), Technological arts
(Toronto, On)
M68HC11 microcontroller, adapt11C24dXboard
$70
Miscellaneous - electronic components, cables, enclosure, mounting hardware $100
Total Cost $550
Figure 1. Tramper position sensor.
Figure 2. Top view of the carriage position sensing apparatus.
These movement limits for outlier detection were determined during preliminary testing and set in the program software.
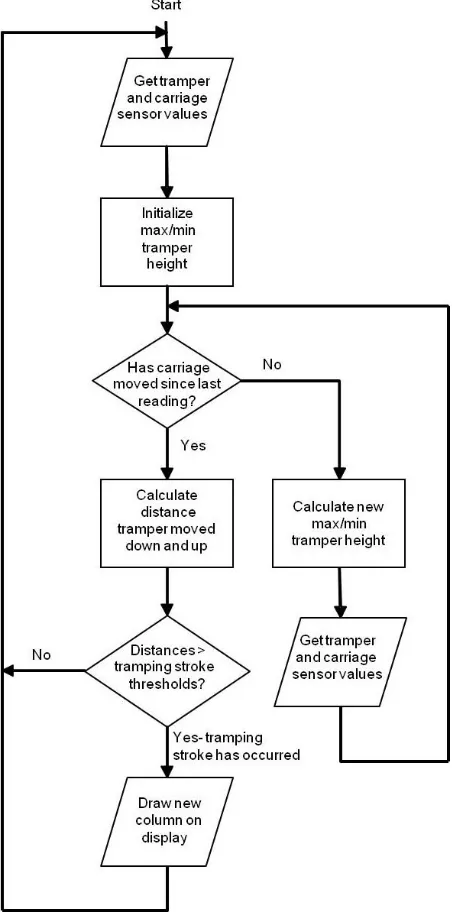
Figure 4 details the algorithm for predicting module shape. Execution of the program began when the feedback system was powered on and continued until the operator turned the system off. At every sensor reading, the position of an arrow on
the LCD screen indicating the carriage location was updated. Based on normal actions of the module builder operator, a compression stroke could only occur while the carriage was stationary. As a result, the system stored values of the tramper sensor when carriage movement stopped.
Algorithm. The feedback system must differentiate true compression (referred to as tramping) strokes from leveling actions, since the compressed height of cotton was proportional to the mass under the tramper.
The algorithm identified a tramping stroke when the
tramper moved down and back up a minimum distance while the carriage was stationary. Leveling actions included raising or lowering the tramper, followed by movement of the carriage. To correctly identify tramping strokes, the algorithm needed accurate readings of the carriage and tramper locations.
A falling edge on one carriage position sensor was used to generate a microcontroller interrupt. When the interrupt occurred, the value of the adjacent
carriage position sensor was read to determine if the carriage location should be incremented or decremented. The front and rear proximity sensors also generated interrupts, which set the carriage location to the minimum and maximum values, respectively. Therefore, the carriage location was continuously updated. The algorithm accessed this carriage location value and read the tramper sensor value every 0.1 s to determine if a tramping stroke had occurred.
Preprocessing of the tramper sensor values was done to improve accuracy. Output from the ultrasonic sensor measuring tramper height was converted to a digital value using the 8-bit analog to digital converter on the microcontroller. The digital output was smoothed using an exponential moving average with a smoothing factor of 0.4, calculated by the following formula:
Yt =αXt + −(1 α)Yt−1 [1] where
Yt = current smoothed value
α = smoothing factor
Xt = current tramper sensor value
Yt-1 = smoothed value from previous observation.
The exponential moving average was simple to implement in the feedback system program, since only the last smoothed value had to be stored due to the recursive nature of the smoothing algorithm. Based on preliminary data collected with the feedback system, a smoothing factor of 0.4 was selected to eliminate most signal noise without introducing a long time delay in the smoothed signal, which negatively impacts the accuracy of the algorithm.
Both carriage and tramper locations were compared to minimum and maximum values to eliminate physically impossible values. Outlier detection was also implemented, since the speed
Three values were identified with the carriage
stopped– the maximum height of the tramper before the compression stroke; the minimum compressed height; and the maximum height after compression. These values were used to calculate the distance the tramper moved, which was compared to a threshold distance of 29.1 to 43.5 cm (11.5 to 17.1 in). This threshold varied inversely with the minimum compressed height, since the operator generally does not have to raise the tramper as high to clear the cotton adjacent to the tramper as the module nears completion. The threshold values were empirically selected to maximize correct interpretation of the measured strokes.
When the system determined a tramping stroke had occurred, a column was displayed at the appropriate location on the LCD screen. The screen was divided into 30 columns, each 8 pixels wide. The module builder was a standard 9.75 m (32 ft) long, and the carriage was 1 m (3.3 ft) wide, resulting in total carriage travel of 8.75 m (28.7 ft). Therefore, each column corresponded to 29.2 cm (11.5 in) of carriage movement. The height of the column was directly proportional to the minimum compressed height– each additional increment in column height corresponded to an increase in the minimum compressed height of 2.8 cm (1.1 in). Figure 5 shows
the display of a finished module, with the carriage
at the rear of the module builder. This module shape was not desirable, as the ends were higher than the center of the module. A desired shape would show the highest column near the center, with decreasing column heights towards the ends. When starting a new module, the operator pressed the reset button to clear the display.
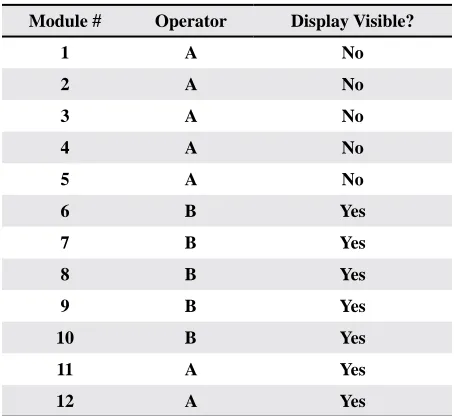
then mounted inside the cab (Figure 3) where it could be viewed by the operator. The original testing plan involved each operator using the module builder with the system installed where it was not visible and later with the system in the cab. Due to weather and mechanical problems with the module builder, this plan was not fully implemented. A total of 12 modules were built with the feedback system installed, under the conditions described in Table 2.
Table 2. Test conditions for modules constructed with feed
-back system installed.
Module # Operator display Visible?
1 a no
2 a no
3 a no
4 a no
5 a no
6 B Yes
7 B Yes
8 B Yes
9 B Yes
10 B Yes
11 a Yes
12 a Yes
Figure 5. A typical display of module shape (contrast en
-hanced for reproduction).
Testing. The feedback system was installed in November 2006 on a module builder in the High Plains of Texas. The harvesting crew that used the feedback system had almost no experience building modules. Originally, the display was installed in a location not visible to the operators, and the system was used to record their actions. The display was
The feedback system was equipped with a data collection system. At every sensor reading (0.1 s intervals), a status byte, time stamp, and the sensor values were transmitted over the microcontroller’s serial communications interface to a Bluetooth serial port device. When the algorithm determined that the carriage had moved, a status byte indicating whether a display occurred, a time stamp, the carriage position, the minimum tramper height, the maximum starting tramper height, and the maximum ending tramper height were all transmitted to the Bluetooth device. The data were collected wirelessly for further analysis using a Bluetooth-enabled laptop. The information collected was used to determine the
final height of the module predicted by the feedback
system. The data were also analyzed to determine the accuracy of the system in identifying compression strokes. Compression actions were identified manually and the algorithm’s performance evaluated.
the module, resulting in 12 height measurements. The height measurements were taken by placing a measuring tape over the top of the module and recording the distance from the ground on one side of the module to the ground on the other side (Figure 6). Module heights were estimated by subtracting 2.13 m (7 ft) from the measurement (for the top width of the module) and dividing by two. This method was used because it was faster than measuring the module height at a single point on the side of the module, and two people could make the measurements from the ground. Additionally, measuring the height at a single point would have required a subjective determination of where the top of the module began, since the top edges of a module were rounded. The estimated
module height was compared to the final displayed
column height at the corresponding location to determine the system accuracy in predicting module height.
collection area. This calculation does not address the possibility that water may drain across the width of the module; however, the operator has no means
of controlling the profile in this dimension, since
cotton cannot be moved across the width of the module. The water collection areas of modules built by operator B before and while using the feedback system were compared using a Wilcoxon rank-sum test (PROC NPAR1WAY, SAS 9.2, SAS Institute, Inc., Cary, NC)
Figure 6. Module height measurement technique.
The heights of five additional modules built
by operator B with a different module builder before he used the feedback system were also measured. Since the harvesting crew used three module builders that were the same model, module shapes produced while using the system could be compared to module shapes created without the
system. These modules were compared to the five
built by operator B using the system to determine if feedback had any effect on module shape. To pro-vide an objective assessment of module shape, the measured heights were used to generate a module
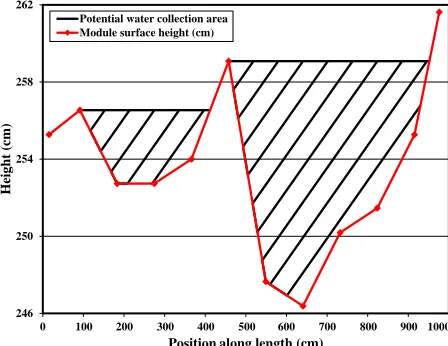
profile along the 9.75 m (32 ft) side. The size of the areas in this profile where water could potentially
collect was calculated. Figure 7 shows an example
of a module height profile and the potential water
246 250 254 258 262
0 100 200 300 400 500 600 700 800 900 1000
Height
(cm
)
Position along length (cm) Potential water collection area
Module surface height (cm)
Figure 7. Profile of height of module number 7 (scale is distorted to illustrate height differences).
The system remained installed on the module builder after initial testing, and the harvesting crew continued to use the system. Modules built with
the feedback system were marked for identification. While the operator who constructed a specific module
was unknown, the operators rotated equipment, so each operator constructed modules with and without the feedback system. The heights of 18 modules built by this harvesting crew were measured at the gin while covered. Half of the modules had been built using the feedback system. Again, the potential water collection areas for the modules built with the system and without were compared using a Wilcoxon rank-sum test.
RESULTS AND DISCUSSION
Display Accuracy. The feedback system
identified 74.4% (5369 of 7218) of the compression strokes correctly. However, a significant proportion of compression strokes not identified or identified at
Initially, a tramper sensor value was considered an outlier and discarded if the difference with the previous smoothed value was more than 45.6 cm (18.0 in). The tramper was observed to regularly exceed this limit between sensor readings during construction of module numbers one and two. This source of error accounted
for 17% of all compression strokes not identified
correctly, even though the lower limit was only used for two modules (Figure 8). Therefore, the outlier limit was changed to 79.8 cm (31.4 in) for the remainder of testing, largely eliminating this source of error.
indexing the carriage to the front. Additionally, the carriage position sensors and the sensing hub became
misaligned while constructing module five, resulting
in mechanical damage to one proximity sensor. Module numbers six and seven were the only other modules with less than 80% of compression
strokes correctly identified. While building these
modules, the tramping cylinder hoses were occasionally detected by the tramper sensor. This
erroneous height measurement was a significant
source of error for these two modules.
These errors due to invalid sensor values and the incorrectly set tramper outlier threshold were all corrected during the course of testing. If these sources of error are excluded, 85.3% of the compression
strokes were correctly identified by the algorithm.
This value is comparable to the compression stroke
identification rates for module numbers 3, 4, and
8-12. The remaining compression strokes were not
identified correctly due to the design of the algorithm
or the values of the parameters used in the algorithm. The primary cause of compression strokes not displaying was that the difference between the minimum smoothed tramper value and the maximum smoothed tramper value before the carriage moved was less than the threshold necessary to consider an operator action a tramping stroke. The actual distance retracted by the tramper was often larger than the threshold; however, the exponential moving average introduced a delay into the smoothed values (Figure 9). This delay is given by the following formula (Hines, 2006):
τ = 1α−α [2]
where
τ = delay (number of observations)
α = smoothing factor (weight of current observation).
Figure 8. Errors in identifying tramping strokes. 17%
18%
7% 41%
8%
3% 4%2%
Tramper outliers less than 79.8 cm threshold (module # 1, 2 only) Carriage sensor errors Tramper sensor errors Tramper up threshold not met Tramper down threshold not met Carriage threshold error Data collection error Tramper outliers greater than 79.8 cm threshold
Another significant cause of failure to identify
compression strokes properly was carriage sensor
errors that occurred on module number five. One
source of carriage sensor error was the use of the automatic tramping system. Actuating the
electro-hydraulic valves required significant current. The
alligator clips connecting the automatic tramping system cable to the tractor battery terminals were
corroded and a significant voltage drop occurred across
these clips. The voltage could become too low to power the proximity sensors that indexed the carriage. When the solenoid was de-energized, the proximity sensors were powered again. Any time power was supplied to these proximity sensors, a pulse was generated,
0 30 60 90 120
80 82 84 86 88 90
Raw
sensor
value
Time (s)
Carriage Carriage, No Outliers Tramper Smoothed Tramper Display
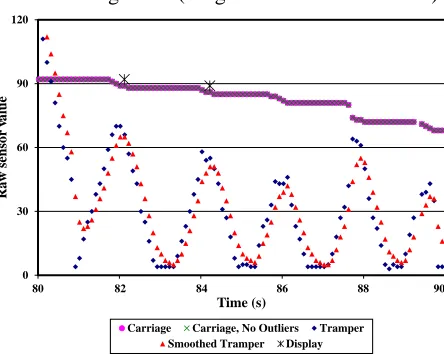
Figure 9. Lag in smoothed tramper data resulting in no display.
Table 3. Accuracy of algorithm in identifying compression strokes by module.
Module # % Compression Strokes Identified Correctly
1 64.7%
2 64.4%
3 82.6%
4 89.6%
5 56.2%
6 69.6%
7 78.5%
8 85.6%
9 89.5%
10 84.5%
11 89.4%
12 80.8%
The smoothed values, shown in red, lagged the actual sensor values, displayed in blue, by 1.5 observations.
In this sequence of module builder actions,
three tramping strokes were not displayed. The first
non-displayed tramping stroke occurred between 84 and 86 s, the second between 86 and 87.7 s, and the third between 87.7 and 89.5 s. In all three cases, the difference between the minimum smoothed tramper height and the maximum smoothed value was larger than the threshold required to qualify as a tramping stroke; however, the delay introduced by the smoothing algorithm resulted in the maximum smoothed height occurring after the carriage moved. When carriage movement began, the difference in the
current smoothed tramper value and the minimum value was less than the threshold value, so the program determined that a tramping stroke had not occurred.
A simple solution may be to account for the delay introduced by smoothing the tramper sensor data. Since the delay was not an integer number of observations, the software could associate a given smoothed tramper value with the carriage position one or two readings prior. Additionally, the smoothing factor could be changed to produce an integer delay– a factor of 0.33 would have a delay of two observations, while a factor of 0.5 would correspond to a one-observation delay.
Reducing the tramper movement threshold could provide further improvement, since some tramping strokes did not display due to the tramper not extending an adequate distance at the start of a tramping stroke. This threshold can easily be changed in the system software and should not adversely affect system performance since no
leveling actions were classified as tramping strokes.
Examining the data collected by the feedback system indicated that a tramper movement threshold of 22.9 cm (9 in) may be more appropriate, especially as the
module is finished.
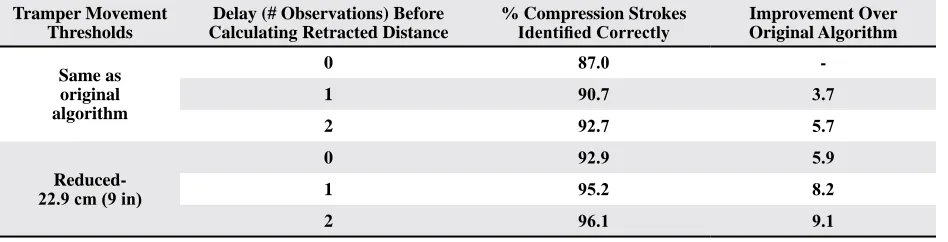
The data collected on the modules was post-processed to determine the effects of reducing the tramper movement threshold and accounting for the delay caused by smoothing the tramper sensor data (Table 4). The data from modules 3, 4, and 8-12 was analyzed, as these were the modules unaffected by sensor errors or improperly set program parameters. While reducing the tramper movement threshold and adding a delay of two observations increased the
identification rate to 96% (3382 of 3519 tramping
strokes), only eight non-tramping actions were displayed as compression strokes.
Height Prediction. The measured heights of the 12 modules with feedback system data were plotted against display heights (Figure 10). The R2 value
of 0.48 for the regression equation was lower than desired; however, a great deal of uncertainty existed in determining the actual height. The measuring tape may not have been completely straight across the top or sides of the module and an uneven top surface of the module could result in additional error. The location at which the compression stroke occurred may have differed slightly from where the measurement was made. For these reasons, the height measurement error was estimated to be 7.62 cm (3 in), and 67% of data points fell within ±7.62 cm (3 in) of the regression line.
Figure 10. Measured and displayed height for all modules. Table 4. Accuracy of proposed algorithm changes in identifying compression strokes.
Tramper Movement Thresholds
delay (# Observations) Before Calculating retracted distance
% Compression Strokes
Identified Correctly improvement Over Original algorithm
Same as original algorithm
0 87.0
-1 90.7 3.7
2 92.7 5.7
reduced-22.9 cm (9 in)
0 92.9 5.9
1 95.2 8.2
2 96.1 9.1
y = 1.8422x + 181.47
R² = 0.4801
210 230 250 270 290
33 38 43 48 53
Measur
ed
height
(cm)
Displayed column height (pixels) Module # 1, 3-12 Module # 2
A more in-depth analysis of the data revealed that all of the data points in module 2 had measured heights less than the minimum error bound and almost all measured heights for other modules. One possible explanation is this module was built at night before wet weather moved into the region, resulting in higher seed cotton moisture content in module 2. Data from Hardin (2004) suggests that higher moisture content may result in this overprediction of module height. The regression line with the module 2 data excluded was y = 1.9005x + 180.51. The R2 value increased to 0.65 and 77% of the data
points fell within ±7.62 cm (3 in) of the regression
line. Because the system successfully identified
tramping strokes and the displayed height had a linear relationship to the measured height, the shape of the module was accurately displayed.
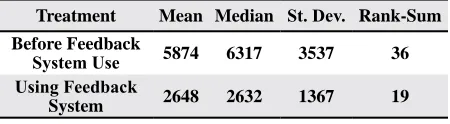
Effect of System on Module Shape. Summary statistics for the calculated potential water collection areas for modules built by operator B before and while using the feedback system are shown in Table 5. The modules built with the feedback system are module numbers 6-10 in Table 2. Because the data was not normally distributed, a Wilcoxon rank-sum test was performed to determine if the means were
significantly different. The resulting p-value was 0.095, suggesting a possible effect of using the feedback system. Visual observations indicated that the modules constructed with the feedback system
had shapes that were more desirable. With only five
samples in each treatment group, nearly all water collection areas of the modules built using the feedback would have to be smaller than all areas of the modules constructed before using the feedback
system to have a statistically significant difference
at the 5% level.
time were well constructed. Furthermore, the mean water collection areas for modules constructed with the feedback system in Tables 5 and 6 were similar. A single operator may have built most or all of the modules using the feedback system that were measured at the gin. In this case, the difference in means would likely result from an operator effect. The feedback system may also have served as a useful training tool for the operators, enabling them to build well-constructed modules without the system.
Table 5. Potential water collection areas (cm2) from initial
testing.
Treatment Mean Median St. Dev. rank-Sum
Before Feedback
System Use 5874 6317 3537 36
Using Feedback
System 2648 2632 1367 19
A comparison of the potential water collection areas of the modules measured at the gin is shown in Table 6. The p-value from the Wilcoxon rank-sum test was 0.063, indicating that the modules constructed without the feedback system may have had improved shapes with smaller water collection areas. However, all the modules observed at this
Table 6. Potential water collection areas (cm2) of modules
measured at the gin.
Treatment Mean Median St. Dev. rank-Sum
Feedback System 2576 1589 1954 107
no Feedback
System 1319 502 1799 64
Acceptability of System. The module builder operators both stated that the feedback system
definitely helped them shape the module. They used
the display to direct the boll buggy to unload cotton in regions that had a lower height on the display and found that the feedback system was most useful
when finishing a module. All operators agreed that
the shape of the module was accurately represented by the feedback system display. When asked how frequently they used the display, the operators
replied, “all the time”, which confirmed observations
made during testing. The module builder operators found the feedback system particularly useful at night and when operating at the far end of the module builder. The feedback system was simple to use, as
both operators were successfully trained on the first
module each built with the system.
The supervisor’s comments echoed the response of the operators. He believed that the feedback system would definitely help his crew. He also thought the display was an accurate representation of the module shape. The supervisor and one of the operators stated that the system lets the operator know where to tramp more. However, cotton needs to be moved to regions of the module with a lower height. Module builder operators need to be aware of this in order to build high quality modules.
CONCLUSIONS
and an optimal tramper sensor outlier threshold, 87% of tramping strokes could be identified.
Implementing two simple algorithm modifications–
reducing the tramping stroke threshold and accounting for the delay introduced by smoothing–
increased the tramping stroke identification rate
above 95% when post-processing recorded data. The minimum tramper height calculated during a tramping stroke was an accurate predictor of module height. With the exception of one module, 77% of predicted heights were within 7.62 cm (3 in) of the actual module heights.
A possible improvement in module shape was
observed when the feedback system was first used
by an operator, with the potential water collection area of the modules measured reduced by 55%. Later modules were generally constructed with desirable shapes regardless of system use. For these modules, differences between operators could not be distinguished from the effect of system use.
The system was easily used and understood. Operators used the system to guide boll buggy operators to unload in areas with less cotton. Operators also found the system useful when operating at the far end of the builder or at night. The feedback system was a useful tool in building modules with shapes that did not collect water,
potentially resulting in significant economic savings
for cotton producers.
aCKnOWLEdgMEnTS
This research was supported by the Cotton Foundation, Cotton Incorporated–Texas State Support Program, the Food and Fibers Research Grant Program of the Texas Department of Agriculture and Texas AgriLife Research.
diSCLaiMEr
Mention of a trade name, proprietary product, or
specific equipment does not constitute a guarantee
or warranty by the U. S. Department of Agriculture and does not imply approval of the product to the exclusion of others that may be available.
rEFErEnCES
Bass, B.H., III. 1992. Cotton module builder including a hydraulically motorized bridge assembly. U.S. Patent 5,167,185. Date issued: December 1.
Curley, R., B. Roberts, T. Kerby, C. Brooks, and J. Knutson. 1988. Effect of moisture on moduled seed cotton. ASAE Paper No. 881049. ASAE, St. Joseph, MI.
Hardin, R.G., IV. 2004. Viscoelastic properties of seed cotton and their effect on module shape and density. MS thesis. Texas A&M University, College Station, TX.
Hardin, R.G., IV and S.W. Searcy. 2008. Viscoelastic properties of seed cotton. Trans. ASABE 51(3): 803-810. Hines, W.G.S. 2006. Geometric moving averages. In S.
Kotz, N. Balakrishnan, C. Read, B. Vidakovic, and N.L. Johnson (ed.)Encyclopedia of Statistical Sciences. John Wiley and Sons, Hoboken, NJ.
Johnston, D. 1976. Tramper for cotton module maker. U.S. Patent 3,961,572. Date issued: June 8.
Orlando, F.P. and J. Hendriks. 1976. Cotton module builder. U.S. Patent 3,941,047. Date issued: March 2.
Parish, R.L. and K.R. Shelby. 1974. The effect of seedcotton storage on seed and lint quality. Trans. ASAE 17(6): 1078-1079, 1084.
Shelby, K.R. and R.L. Parish. 1975. An automatic control system for a cotton module builder. Trans. ASAE 18(8): 231-232, 235.
Simpson, S.L. and S.W. Searcy. 2004. Performance of module covers in resisting moisture penetration. p. 3040-3048.
In Proc. Beltwide Cotton Conf., San Antonio, TX. 5-9 Jan. 2004. Natl. Cotton Counc. Am., Memphis, TN.
Simpson, S.L. and S.W. Searcy. 2005. The benefits of
replacing used module covers. p. 3029-3044. In Proc. Beltwide Cotton Conf., New Orleans, LA. 4-7 Jan. 2005. Natl. Cotton Counc. Am., Memphis, TN.
Simpson, S.L. and S.W. Searcy. 2008. Module tarp performance in weathering tests. p. 778-786. In Proc. Beltwide Cotton Conf., Nashville, TN. 8-11 Jan. 2008. Natl. Cotton Counc. Am., Memphis, TN.