in the population sciences published by the Max Planck Institute for Demographic Research Konrad-Zuse Str. 1, D-18057 Rostock·GERMANY www.demographic-research.org
DEMOGRAPHIC RESEARCH
VOLUME 19, ARTICLE 60, PAGES 2011-2042
PUBLISHED 10 DECEMBER 2008
http://www.demographic-research.org/Volumes/Vol19/60/ DOI: 10.4054/DemRes.2008.19.60
Research Article
Educational differences in all-cause mortality
by marital status – Evidence from Bulgaria,
Finland and the United States
Iliana V. Kohler
Pekka Martikainen
Kirsten P. Smith
Irma T. Elo
c
°2008 Kohler et al.
1 Introduction 2012
2 Background 2014
2.1 Choice of countries 2014
2.2 Educational attainment and marital status 2016
3 Data 2016
3.1 The Bulgarian data 2017
3.2 The Finnish Data 2017
3.3 The U.S. Data 2019
3.4 Coding of educational attainment and marital status 2020
4 Methods 2020
5 Results 2021
5.1 Educational differences in male mortality 2022 5.2 Educational differences in female mortality 2026
6 Discussion 2028
6.1 Main findings and their interpretations 2028
6.2 Data coverage and comparability 2029
6.3 Conclusions 2030
7 Acknowledgements 2031
References 2032
Appendix 1A: Observed and fitted death rates 2038
Appendix 1B: Estimated coefficients from Gompertz models for men 2039
Appendix 1C: Estimated coefficients from Gompertz models for women 2040
Appendix 2: Estimation of standard errors and 95% confidence
Educational differences in all-cause mortality by marital status –
Evidence from Bulgaria, Finland and the United States
Iliana V. Kohler1
Pekka Martikainen2
Kirsten P. Smith3
Irma T. Elo4
Abstract
Using life table measures, we compare educational differentials in all-cause mortality at ages 40 to 70 in Bulgaria to those in Finland and the United States. Specifically, we assess whether the relationship between education and mortality is modified by marital status. Although high education and being married are associated with lower mortality in all three countries, absolute educational differences tend to be smaller among married than unmarried individuals. Absolute differentials by education are largest for Bulgarian men, but in relative terms educational differences are smaller among Bulgarian men than in Finland and the U.S. Among women, Americans experience the largest education-mortality gradients in both relative and absolute terms. Our results indicate a particular need to tackle health hazards among poorly educated men in countries in transition.
1University Research Associate, Population Studies Center, University of Pennsylvania, 239 McNeil
Build-ing, 3718 Locust Walk, Philadelphia, PA 19104-6298. Tel.: +1-(215)-898-7990. Fax: +1-(215)-898-2124. E-mail: [email protected].
2Helsinki Collegium for Advanced Studies, P.O.Box 4, FIN-00014 University of Helsinki, Finland.
Tel.: +358-9-191 23889, E-mail: [email protected].
3Postdoctoral fellow and research associate, Department of Health Care Policy, Harvard University,
180 Longwood Ave., Boston, MA 02115. Tel.: +1-(617)-432-5216, E-mail: [email protected].
4Associate Professor of Sociology, Population Studies Center, University of Pennsylvania, 239 McNeil
1. Introduction
A well established pattern in the demographic, sociological, and epidemiological litera-ture is that people with high education, high income, and high status occupations expe-rience lower risks of death than do individuals from lower socioeconomic strata. This inverse relationship has been extensively documented for many industrialized countries (Adler et al. 1994; Antonovsky 1967; Drever et al. 1996; Elo and Preston 1996; Valko-nen 1987, 1989; ValkoValko-nen and Martelin 1988, Mackenbach et al. 1997, 2000). A growing body of literature has also examined whether inequalities by socioeconomic status (SES) are uniform and to what extent they vary among countries (e.g., Valkonen 1989; Kunst and Mackenbach 1994; Sihvonen et al. 1998; Kunst et al. 1998; Mackenbach et al. 1997, 1999, 2000, 2003; Huisman et al. 2005; Shkolnikov et al. 2006). Several studies have revealed considerable variation in the magnitude of socioeconomic inequalities in mor-tality among developed countries, with inverse gradients typically larger for men than for women (Valkonen 1989; Mackenbach et al. 2004; Borell et al. 2005). Despite the consid-erable theoretical and health-policy relevance of comparative research, the evidence thus far has been based mostly on Western European countries and the United States. East-ern European countries have had limited representation in this comparative work with the exception of Estonia, Hungary, the Czech Republic, Russia, and recently, Lithuania (Carlson 1989; Hajdu et al. 1995; Carlson 2000; Mackenbach et al. 1999; Shkolnikov et al. 1998, 2004, 2007). Nonetheless, evidence suggests that socioeconomic differentials in mortality in both relative and absolute terms also exist in the former socialist countries of Central and Eastern Europe, and these differentials appear to be even larger than are those observed in Western Europe and other industrialized countries (Hajdu et al. 1995; Watson 1995).
as Bulgaria. The United States in turn is characterized by large income inequality. In addition, the country lacks a uniform national health insurance policy, with the result that many working-age adults have no or only limited health insurance coverage, while the elderly are covered by the national Medicare program (DeNavas-Walt et al. 2004). This large income inequality and unequal health-care coverage is also found in eastern European countries in transition, including Bulgaria. Given these contextual differences and similarities, a comparison of the three countries provides insights regarding the extent to which national differences in social, economic and health care policies may contribute to SES inequalities in mortality.
A specific aim of the present study is to quantify educational differentials in Bulgar-ian mortality in the 1990s and to place them in an international perspective. We further add an additional - much less often studied - perspective by including marital status and examining whether marital status and educational attainment interact in their association with mortality. Numerous studies have shown marital status to be closely associated with mortality, with the association typically stronger for men than for women (e.g., Hu and Goldman 1990; Valkonen et al. 2004). Evidence also suggests that mortality differentials by marital status are large in comparison with other socioeconomic characteristics (e.g., Martikainen et al. 2005). We hypothesize that the association between education and mortality also depends on the marital status of individuals. For instance, Smith and Wait-zman (1994) found that individual-level poverty status interacted with marital status in the United States in the early 1980s such that poor, unmarried men between ages 25 and 64 were at highest risk of death. We examine whether a similar pattern also holds true in the 1990s in different social and economic contexts. We expect that education-marital status interactions will be most pronounced in Bulgaria, which was undergoing rapid economic and social transformations during the period under investigation. During this transition individuals with low levels of schooling were particularly disadvantaged. We hypothesize that the economic and psychosocial support from a spouse may have helped mitigate the negative consequences of severe economic hardship for underprivileged individuals.
We translate educational and marital status differentials in mortality into life-table measures that facilitate a straightforward comparison of the association of education and marital status with survival. We examine bothrelativedifferentials, which demonstrate how unequally the risk of death is distributed among social groups (Kunst et al. 2004), and absolutedifferences in survival, which reflect "more directly the public health significance of excess mortality of high risk groups" (Valkonen et al. 2004: 307).
(for a discussion of this type of bias see for example Kunst et al. 2004; Shkolnikov et al. 2007).
The remainder of this paper is organized as follows. In the next section, we discuss relevant differences among the three countries and our choice of education and marital status as explanatory variables. Next, we describe our data and analytic strategy. We then report our findings, and we end with a discussion of our main findings.
2. Background
2.1 Choice of countries
Our discussion of educational and marital status inequalities in Bulgarian mortality dur-ing the 1990s is set in the context of Finland and the United States, two Western countries included in previous comparative studies (e.g. Mackenbach et al. 1999, 2000, 2003; Valkonen 1989; Leclerc et al. 1990; Lorant et al. 2005; Sihvonen et al. 1998; Elo et al. 2006). The three countries are characterized by considerable divergence in histori-cal mortality trends, especially since the 1950s, as well as substantial socioeconomic and political differences during the 20th century. During the first half of the 20th century, the three countries underwent very similar demographic developments, namely large im-provements in life expectancy for both sexes resulting primarily from steep declines in infectious diseases and infant mortality. By the beginning of the 1960s, life expectancy at birth was highest among Bulgarian men (67.47 years), followed by U.S. men (66.63 years) and Finnish men (65.40 years). In contrast, a lower life expectancy was recorded for Bulgarian women (70.94 years) than for Finnish women (72.39 years) or U.S. women (73.31) (Human Mortality Database 2008).
recent period, Bulgaria also remained an outlier in terms of other demographic patterns, including substantial out-migration and a decline in fertility to unprecedentedly low levels (Council of Europe 2003; Kohler et al. 2002).
Consistent with trends in other Western European countries, life expectancy in Finland improved substantially after the early 1960s, and by the mid-1990s male life expectancy was 72.8 years, and female life expectancy was 80.2 years. Although male and female mortality fell in all age groups, a large sex difference in life expectancy was still evident in the mid-1990s. A severe economic recession in the early 1990s was not associated with negative changes in life expectancy trends in Finland, in sharp contrast to the pattern observed in Bulgaria.
In the United States, following a period of stagnation in mortality improvements dur-ing the 1950s and early 1960s (Crimmins 1981), death rates began to fall in the late 1960s, and life expectancy increased in subsequent years. By the mid-1990s, U.S. life expectancy at birth had increased to 72.7 years for men and 79.2 years for women (Human Mortal-ity Database 2008). Because of enduring racial disparities in health, life expectancy for whites exceeded that for the nation as a whole. In 1995, life expectancy was 73.4 years for white men and 79.6 years for white women (National Center for Health Statistics 1998).
2.2 Educational attainment and marital status
For substantive and methodological reasons, we focus our analyses on educational differ-entials in mortality at ages 40 to 70. Although the socioeconomic status of a population or of individuals can be assessed using several social and economic indices, education is preferable for this study for a number of reasons. First, education is a composite so-cioeconomic measure that is related to many other social and economic factors, such as social class, earnings and income, cognitive abilities, and health behaviors (Elo and Pre-ston 1996). Level of schooling also indexes the socioeconomic position of individuals early in adulthood, as well as the stock of human capital available to them during their life course (see also Feldman et al. 1989; McDonough et al. 1999; Preston and Taubman 1994). In addition, other indices of SES, such as occupation or income, are problematic in the context of a transition economy such as Bulgaria’s or when we are interested in measuring health and mortality differentials among women, some of whom have never worked or do not have independent sources of income.
Compared to other individual-level characteristics besides education, marriage has been found to have a particularly large impact on health outcomes, with married men and women showing a clear survival advantage over the unmarried. Moreover, several studies have demonstrated that the health benefits of marriage tend to be larger for men than for women (Hu and Goldman 1990; Murphy et al. 1997; Murray 2000; Lillard and Waite 1995; Rogers 1991; Waite and Lehrer 2003). Previous research further suggests that marital status accounts for at least some of the variation in educational differen-tials in mortality. In the Finnish context, for example, although the relative magnitude of unadjusted educational inequalities in mortality is larger for men than for women, these differences partly diminish once marital status is taken into account (Koskinen and Martelin 1994). By introducing marital status into the analysis, we further explore whether the educational gradient is different for the married and the unmarried, thus adding a new dimension to comparative research on educational inequalities in mortal-ity.
3. Data
United States, and the Roma and Turkish ethnic groups in Bulgaria, have lower levels of education than do non-Hispanic Whites or ethnic Bulgarians, respectively. Furthermore, these groups face racial/ethnic discrimination that can affect both access to health-care services and other health-related resources. In addition, linkages to national death records are likely to be more complete for non-Hispanic whites than for non-whites in the United States (National Center for Health Statistics 2000). For these reasons, we have restricted our data for the United States to non-Hispanic whites and for Bulgaria to ethnic Bulgar-ians who report Bulgarian ethnicity and Bulgarian mother tongue in the census. We also restrict the Bulgarian and the Finnish data to the non-institutionalized civilian population to make them comparable to the data for the United States.
3.1 The Bulgarian data
The data for Bulgaria are individual-level and come from a linkage between the 1992 population census taken on December 4th and death certificates for the period Decem-ber 5, 1992 to DecemDecem-ber 31, 1998. The link between the census and death records was performed by the National Statistical Institute of Bulgaria on the basis of a personal iden-tification number that is uniquely assigned to each Bulgarian citizen and is included on death and census records. Approximately 93% of all death certificates for the study pe-riod were linked to the 1992 census records. Non-linkage of death records stems from incorrectly coded information on either the death or the census record and from internal and international migration during the 1990s that made it difficult or impossible to locate a deceased individual. As evidence of the latter, linkage rates are lower (about 89%) in regions that experienced high international migration during the 1990s. It is worth noting that these data are unique among Eastern European countries and represent an innovation for countries of Central and Eastern Europe.
Our mortality estimates for Bulgaria pertain to the period January 1, 1993 to De-cember 31, 1997. Information on exact date of death comes from death records, and information on age at baseline, education, and marital status are obtained from the census records. The Bulgarian dataset is the largest of the three datasets used in this paper and comprises 3,339,817 men and women ages 40 to 70 during the period of observation (see Table 1). The mean length of follow-up for men is 4.17 (s.d. 1.4) years and for women is 4.23 (s.d. 1.4) years. During the study period, 6.9% of Bulgarian men and 3.2% of women at ages 40 to 70 died.
3.2 The Finnish Data
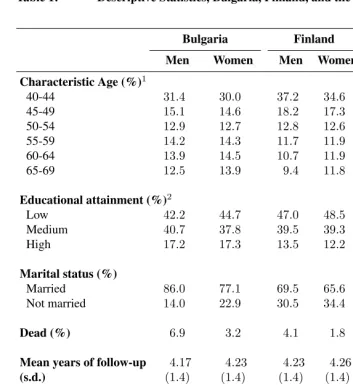
Table 1: Descriptive Statistics, Bulgaria, Finland, and the United States
Bulgaria Finland United States
Men Women Men Women Men Women
Characteristic Age (%)1
40-44 31.4 30.0 37.2 34.6 40.9 39.6
45-49 15.1 14.6 18.2 17.3 15.5 15.1
50-54 12.9 12.7 12.8 12.6 12.5 12.1
55-59 14.2 14.3 11.7 11.9 10.8 10.8
60-64 13.9 14.5 10.7 11.9 10.5 11.0
65-69 12.5 13.9 9.4 11.8 9.9 11.4
Educational attainment (%)2
Low 42.2 44.7 47.0 48.5 15.4 14.5
Medium 40.7 37.8 39.5 39.3 35.4 43.3
High 17.2 17.3 13.5 12.2 49.1 42.2
Marital status (%)
Married 86.0 77.1 69.5 65.6 82.7 74.7
Not married 14.0 22.9 30.5 34.4 17.3 25.3
Dead (%) 6.9 3.2 4.1 1.8 3.7 2.3
Mean years of follow-up 4.17 4.23 4.23 4.26 4.5 4.5
(s.d.) (1.4) (1.4) (1.4) (1.4) (2.0) (2.0)
Mean age at death 59.8 61.4 59.1 60.0 59.7 59.9
(s.d.) (7.8) (7.4) (8.4) (8.2) (8.2) (8.0)
Number of deaths 111,124 54,557 4,976 2,169 2,963 1,980
Number of 1,619,026 1,720,791 120,175 124,047 80,585 86,977 observations
Bulgarian data. The individual-level dataset includes 244,222 men and women ages 40 to 70. The different Finnish data sources - census, population registration and death records - have been linked by Statistics Finland using a unique personal identification code. Non-linkage of death records to census records is less than 0.5%. Socio-demographic char-acteristics of respondents – age at baseline, educational attainment, and marital status – come from census records, and the date of death is based on the linked death record. These data have been used in previous studies to analyze mortality differentials by edu-cation (Martikainen and Valkonen, 1998), occupation (Valkonen et al. 2000), and family income (Martikainen et al., 2001), and to compare SES differentials in mortality in Fin-land to those in the United States (Elo et al. 2006).
For Finland, our mortality estimates pertain to the period January 1, 1994 to December 31, 1998. The mean years of follow-up are 4.23 (s.d. 1.4) for men and 4.26 (s.d. 1.4) for women. During the study period, 4.1% of men and 1.8% of women died.
3.3 The U.S. Data
The main difference between the US data and the Bulgarian and Finnish data is that the US data come from a nationally representative survey rather than a full census. We use the 1990-1994 waves of the National Health Interview Survey (NHIS) that have been linked to the National Death Index (NDI) through 1997 (Massey et al. 1989; National Center for Health Statistics 2000). The NHIS is an annual health survey of the civilian, non-institutionalized population of the United States dating back to 1957 and is the pri-mary source of annual data on the health status of the US population. The survey’s health and demographic core questionnaire collects information on socio-demographic charac-teristics of individuals residing in surveyed households, including information on age, race/ethnicity, marital status, and education. The National Center for Health Statistics has estimated that about 6% of female and 3% of male deaths are missed in the linkage to the NDI, with higher percentages estimated for non-whites (National Center for Health Statistics 2000).The NHIS-MCD linked data are considered the most reliable, large, na-tionally representative data source for the study of SES differentials in mortality in the United States in the 1990s (Rogers et al. 2000).
3.4 Coding of educational attainment and marital status
Education was classified into three categories. Our low education category corresponds to 0-8 completed years of education in Bulgaria, 0-9 completed years of education in Finland, and to 0-11 completed years of schooling in the United States. Our medium education category corresponds to 9-12 completed years of education in Bulgaria, 10-12 completed years of schooling in Finland, and 10-12 completed years or a high school education in the United States. In all three countries, the highest educational category refers to 13+ completed years of education.
We use this coding of educational attainment to reflect substantive differences in ed-ucational systems across the three countries. We use two marital status categories: cur-rently married and curcur-rently unmarried. The latter category includes those who were never married, divorced, separated, or widowed at the time of the census or the baseline NHIS interview. Due to sample size considerations, we were unable to make finer distinctions in the currently unmarried group.
4. Methods
We focus our analyses on ages 40 to 70. Mortality differentials by education and marital status are large at these ages, and deaths in this age range are considered premature (e.g. Elo and Preston 1996; Koskinen and Martelin 1994). To facilitate a comparison of edu-cational inequalities in mortality, we calculate several life table measures using estimated age-specific death rates obtained from a parametric specification of the mortality hazard based on the following Gompertz model:
m(x) =a(z)eb(z)x
The model assumes that the death ratem(x)is an exponential function of age and a vector of covariatesz= (z1, ..., zn), i.e., in our case education and marital status. The parameter a(z) = exp(α0+α1z1+...+αnzn)determines the overall level of mortality for a given
set of socioeconomic characteristics. The parameterb(z) = β0+β1z1 +...+βnzn
indicates how the risk of death changes with age for a given socioeconomic group. The Gompertz model is appealing in the present analyses for several reasons. It is well documented that it aptly describes the age-specific mortality patterns at adult ages, where the logarithm of the risk of death increases linearly with age. In addition, we can calculate age-specific death rates by sex, educational attainment, and marital status using the parameter estimates obtained from the model.
analysis and is observed until either death or the end of the observation period, whichever comes first. In addition, we censor individuals at age 70. This strategy ensures that our mortality estimates pertain to ages 40 to 70 during the observation period. We estimate separate models by sex and country.
An illustrative example of the fit of the Gompertz model to our data is shown in Appendix 1A, which plots the observed and the fitted sex-specific death rates obtained from the model for each country. The fitted rates closely trace the observed death rates. The best fit of the model is observed for Bulgaria, where we have the largest number of observations. The model also provides a good fit to the data in all countries when disaggregated by educational attainment and marital status (results not shown).
The level and slope coefficients for education and marital status from all models are shown for men in Appendix 1B and for women in Appendix 1C. We find significant ef-fects of education and marital status on mortality in all countries among both men and women, with some variation in the magnitude of these effects among countries and be-tween men and women.
We used the coefficients shown in Appendix tables 1B and 1C to calculate the follow-ing life table measures to facilitate comparison among the three countries: the expected number of years of life lost (LE-lost) due to mortality between ages 40 and 70 (i.e., 30 years minus expected number of years lived between age 40 and 70), and the probability of dying by age 70 among those who survived to age 40. In addition, we also provide the approximate 95% confidence intervals for the LE-lost to reflect the uncertainty of our estimates. Appendix 2 describes the methodology we used to perform these latter calculations. To provide a measure of absolute inequality in mortality we calculate the differences in LE-lost and the probability of dying among the following groups:
(1) those at the highest and at the middle levels of education, (2) those at the highest and at the lowest levels of schooling, and
(3) between the married and the unmarried. We assess relative inequality in mortality by calculating the ratio of the estimated probability of dying for those at the low and middle levels of schooling relative to those with the highest level of education.
5. Results
men and women in Bulgaria and Finland fall into the lowest level of education compared to only about 15% in the United States.
Bulgarian men have the highest mortality and can expect to live fewer years between ages 40 and 70 (25.6 years = 30-4.4) than either Finnish (27.1 years) or American men (27.6 years) (Table 2). Similarly, Bulgarian women have higher overall mortality than do Finnish and American women, although the cross-country differences are smaller for women than for men (Table 2). Because there is considerable variation in mortality pat-terns by gender within and between countries, we begin the next section with presenting first the results for men, followed by our findings for women.
5.1 Educational differences in male mortality
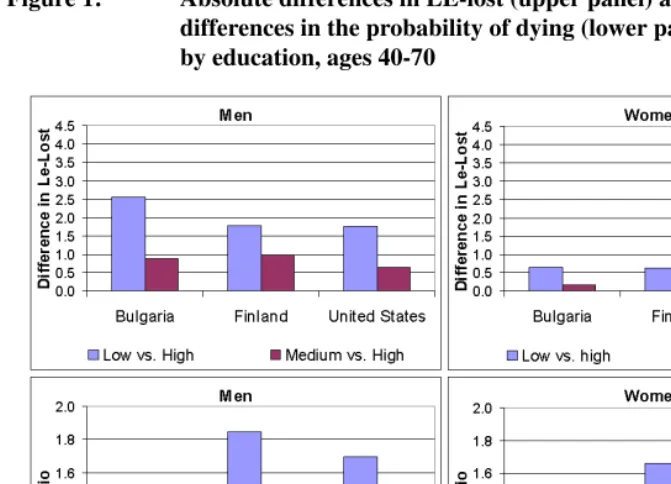
We find a clear education gradient in LE-lost in all three countries: the higher the level of education, the longer the lifespan between ages 40 and 70 and the fewer the expected years of life lost due to mortality. At the same time, male mortality is higher in Bulgaria than in Finland and the United Sates at all levels of education, with the largest cross-country difference found for men with low education. Men with low education reaching age 40 can expect to live about 2 years longer before age 70 in Finland and the United States than in Bulgaria, a difference that is statistically significant. These differences translate into the steepest education gradient in LE-lost in absolute terms in Bulgaria, where men with high education can expect to live 2.56 years longer than men with low education. The respective figure for Finland and the United States is 1.79 years (Table 2 and Figure 1). Moreover, 46% of 40 year-old Bulgarian men with low education will perish before reaching their 70thbirthday, compared to 31% of men with high education. The respective percentages are 33% and 18% in Finland and 36% and 21% in the United States (Table 3). The greater absolute educational inequality in male LE-lost in Bulgaria reflects in part higher mortality at each level of education compared to Finland and the United States (upper left panel of Figure 1).
When educational inequalities in mortality are translated into relative terms, a some-what different picture emerges. When measured as the ratio of the probability of dying between ages 40 and 70 at low relative to high levels of education, educational differences appear to be smaller in Bulgaria than in Finland and the United States: 1.52 in Bulgaria compared to 1.84 in Finland and 1.68 in the United States (Figure 1, lower left panel). When those with medium educational levels are compared to those with high education, the largest relative difference in the probability of dying is observed in Finland (1.47), while the values for Bulgaria and the United States are similar (1.23 and 1.20, respec-tively) (Table 2 and Figure 1, lower left panel).
Table 2: Life expectancy lost (LE-lost) by educational attainment and marital status, males and females, Finland, Bulgaria, and the United States in the 1990s [approximate 95%-confidence interval]
Table 3: Probability of dying between ages 40 and 70 by educational attain-ment and marital status, males and females, Finland, Bulgaria, and the United States in the 1990s
Educational Men Women
attainment & Bulgaria Finland US Bulgaria Finland US marital status Probability of dying between age 40 and age 70
All 0.405 0.297 0.258 0.205 0.129 0.160
Educational attainment
Low 0.463 0.332 0.355 0.226 0.143 0.238
Medium 0.374 0.265 0.254 0.178 0.119 0.148
High 0.305 0.180 0.212 0.163 0.086 0.130
Marital status
Married 0.382 0.235 0.233 0.194 0.110 0.142
Unmarried 0.546 0.445 0.380 0.239 0.164 0.201
Marital status & educational attainment Married
Low 0.432 0.257 0.324 0.214 0.121 0.217
Medium 0.354 0.214 0.223 0.166 0.098 0.134
High 0.291 0.160 0.198 0.150 0.085 0.113
Unmarried
Low 0.615 0.471 0.472 0.267 0.181 0.287
Medium 0.498 0.419 0.413 0.212 0.156 0.188
Figure 1: Absolute differences in LE-lost (upper panel) and relative differences in the probability of dying (lower panel) by education, ages 40-70
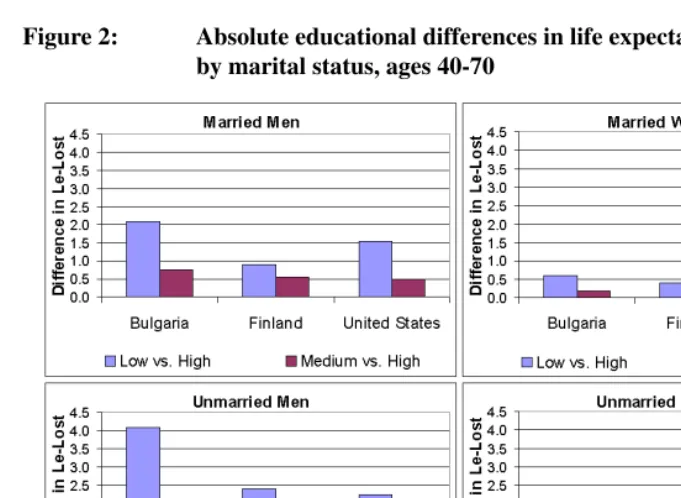
than do unmarried men. The difference in LE-lost by marital status is smaller in the United States (about 2 years) (Table 2). Within and between countries, these marital sta-tus differences are statistically significant. We further find that marital stasta-tus modifies the association between education and mortality (Figures 2 and 3). Within each marital status group the absolute difference in LE-lost between men with low and high education is again most pronounced in Bulgaria: 2.08 years for married men and 4.07 for unmarried men compared to 0.90 years and 2.41 years, respectively, in Finland and 1.57 years and 2.37 years, respectively, in the United States. Although in all three countries unmarried men with low education have the highest mortality, this disadvantage is particularly strik-ing in Bulgaria. Only 39% of 40 year old unmarried Bulgarian men with low education can expect to reach their 70thbirthday. At the other extreme are highly educated married men in Finland, for whom the corresponding figure is 84% (Table 3).
Figure 2: Absolute educational differences in life expectancy lost (LE-Lost) by marital status, ages 40-70
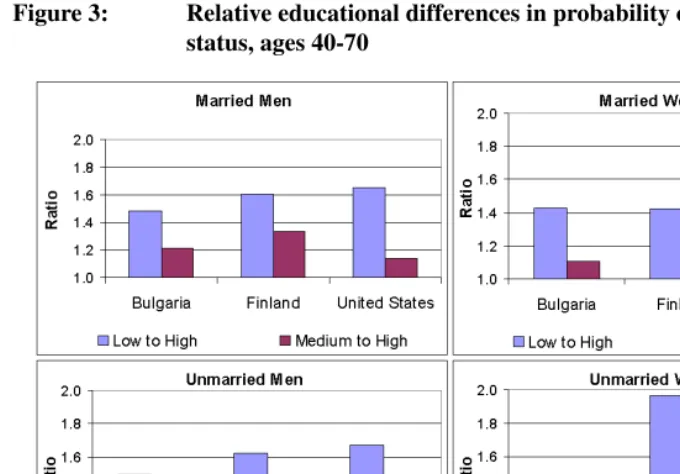
in relative terms the pattern of mortality differentials by education within marital status changes. Among married men, the relative low to high education differential in the prob-ability of dying between ages 40 and 70 is largest in Finland and smallest in the U.S., while Bulgaria takes an intermediate position. Similar country ranking is observed when comparing medium to high education differences among married men (Figure 3, upper left panel). In contrast, Bulgarian unmarried men are characterized by the smallest rela-tive differences in the probability of dying30q40when comparing men with low versus high and medium versus high education. These differences are similar in Finland and the United States (Figure 3, lower left panel).
5.2 Educational differences in female mortality
Figure 3: Relative educational differences in probability of dying by marital status, ages 40-70
about a third of a year higher than the estimate for American women (1.49 years). These overall differences in LE-lost among the countries are statistically significant. We also observe clear educational and marital status differences in LE-lost in all three countries (Table 2).
are not statistically significant. This Bulgarian female advantage, however, does not ex-tend to higher levels of education (Table 2). Because of the higher mortality of the US women at the lowest level of education, the educational gradient in LE-lost also appears to be somewhat steeper in the United States than in Bulgaria.
Relative educational differentials in the probability of dying are smaller in Bulgaria than in the United States among both married and unmarried women. These differentials are also less pronounced among unmarried Bulgarian than unmarried Finnish women and they are similar in magnitude among married women in Bulgaria and Finland. The rela-tive educational differentials in the probability of dying between ages 40 to 70 are most pronounced among unmarried Finnish women and married American women (Figure 3).
6. Discussion
6.1 Main findings and their interpretations
The present analyses focus on educational and marital status differentials in all-cause mortality in three developed countries - Bulgaria, Finland and the United States. For Bul-garia - and for Eastern Europe more generally - these analyses are of particular relevance, as they refer to the 1990s, a time period characterized by profound political, social and economic transitions. Furthermore, Bulgaria has not been previously included in compar-ative research, and little is known about how educational and marital status differentials in mortality in Bulgaria compare to those observed in other developed countries. An ad-ditional strength of our analysis is that we examine both relative and absolute differences in mortality using life table measures.
Consistent with previous literature, we document a clear education gradient in male and female mortality in Bulgaria, Finland, and the United States during the 1990s. We find greater absolute inequality in male mortality in Bulgaria than in Finland or the United States. This pattern, however, is less consistent in relative terms; relative differentials tend to be somewhat smaller in Bulgaria than in the other countries. These latter results are in contrast to findings by Mackenbach et al. (1999) and Shkolnikov et al (2004), who documented larger relative mortality differentials by educational attainment for men in the Czech Republic, Hungary, Estonia and Russia, compared to the United States, Finland, Norway, and Turin, Italy. These studies and ours, however, are not directly comparable as they cover different periods and age groups and use different methodologies.
mortality in the past as the combination of low education and being unmarried is strongly associated with social marginalization in Eastern Europe. We speculate that in Bulgaria the high mortality of unmarried men is partially due to the consequences of rapid social transformations, e.g., increases in male unemployment, declining access to health care, and worsening health behaviors (i.e., heavy drinking and high prevalence of smoking). Evidence from elsewhere shows that Bulgarian male mortality increased around the mid-1990s, with mortality from cardiovascular diseases being particularly high (Cruijsen and Ekamper 2004). Severe resource constraints in the health care sector may have also been a contributing factor by limiting access to more intensive cardiovascular care among men at the margins of society.
In contrast to men, Bulgarian women do not exhibit a similar mortality disadvantage. If anything, poorly educated Bulgarian women can expect to live somewhat longer than poorly educated American women between ages 40 and 70. Furthermore, the relative educational disparities in female mortality in Bulgaria are smaller than in Finland or the United States. At the same time, among women, the Finns are clearly better off in terms of LE-lost than Bulgarians or Americans. Finnish women have significantly lower mortality whether we stratify by educational attainment and/or marital status than American or Bulgarian women.
We also find that in each country, the LE-lost between the lowest and highest educa-tion group at ages 40 to 70 is bigger among men than women. Evidence from previous studies (Koskinen and Martelin 1994, Mackenbach et al. 1999) suggests that at least a part of this gender difference is due to differences in cause-of-death patterns among men and women. Such variation in causespecific patterns may also underlie the results reported here, but the investigation of this hypothesis is beyond the scope of this paper.
6.2 Data coverage and comparability
Although we have used the best data sources available for comparative analyses, we should note several limitations. Our first concern has to do with a difference in the type of data used. Both the Finnish and Bulgarian data come from censuses, which should better capture the entire population than do the survey data which cover only the non-institutionalized population as was the case in the United States. Nevertheless, the US data are considered highly reliable for analyses of SES differentials in US mortality (Rogers et al. 2000). To increase comparability, we excluded the institutionalized populations in Bulgaria and Finland.
or the census record. Furthermore, a large segment of unlinked deaths are likely due to high migration after 1989 among such population subgroups as the Turkish minority and young individuals. Because we have excluded both the Turkish and Roma minorities, as well as the under 40 year-olds, we believe this non-linkage is unlikely to bias our results. In addition, non-linkage may bias estimates of mortality levels rather than educational differentials.
One of the challenges in conducting international comparisons of mortality differen-tials by any measure of SES is developing comparable measures (Valkonen 1993; Mar-tikainen and Valkonen 1999). This issue is particularly important for our analysis, which compares educational differences in mortality in countries with different historical trajec-tories and socioeconomic and political contexts. To increase comparability, we classify educational attainment into three broad groups: low, medium, and high levels of school-ing. Because of differences in educational systems, the low and medium educational categories differ slightly across countries in the number of completed years of educa-tion. In Bulgaria and Finland it is common for students who do not expect to advance to post-secondary-school education to enroll in vocational and technical schools that provide training for specific occupations. Because such training is commonly regarded as equiva-lent to completing a secondary school degree, we have included completion of such pro-grams in the middle education categories in Bulgaria and in Finland. In the United States, on the other hand, completing a high school education is normative and regarded as a necessary precursor to enrollment in other educational venues. We believe that this cod-ing of educational attainment better reflects differences in the educational systems across the three countries, as well as differences in educational achievement, life styles and the employment opportunities that schooling provides, than had we used the same number of completed years of schooling in each country. Furthermore, previous comparative analy-ses of Finland and the US show that these choices make relatively little difference (Elo et al. 2006).
6.3 Conclusions
edu-cational gradient in mortality for Bulgarian men than for Finnish and American men. In contrast, the absolute education gradient in female mortality is not consistently larger in Bulgaria than in Finland or the United States.
Our results indicate that there may be a particular need to tackle health inequalities among men in Eastern European countries in transition. Although we are not able to ex-amine trends in educational differentials in mortality in Bulgaria, evidence from Estonia (Leinsalu et al. 2003) indicates that life-expectancy differences by educational attain-ment at age 25 increased rapidly in that country during the 1990s. This increase was brought about by declining mortality at higher levels of education and increasing mor-tality at lower levels of schooling. Evidence from Estonia, together with our results for Bulgaria, suggests that men with low educational attainment are particularly vulnerable during the transition from socialist to free-market regimes. Whether high education con-fers benefits through increased income, life style choices that are health-related, or some other mechanism is not possible to examine with our data. Analysis of cause-specific mortality could help point to plausible explanations driving these patterns and shed light on whether cause-specific contributions to educational inequalities are similar across the three countries.
7. Acknowledgements
References
Adler, N., Boyce, T., Chesney, M. A., Cohen, S., Folkman, S., Kahn, R., and Syme, L. S. (1994). Socioeconomic status and health: The challenge of the gradient. American Psychologist49(1): 15–24.
Antonovsky, A. (1967). Social class, life expectancy and overall mortality. Milbank Memorial Fund Quarterly45: 31–73.
Borell, C., Plasència, A., Husiman, M., Costa, G., Kunst, A., Andersen, O., Bopp, M., Borgan, J.-K., Deboosere, P., Glickman, M., Gadeyne, S., Minder, C., Regidor, E., Spadea, T., Valkonen, T., and Mackenbach, J. P. (2005). Educational level inequalities and transportation injury mortality in the middle aged and elderly in European settings. Injury Prevention11: 138–142.
Carlson, E. (1989). Concentration of rising Hungarian mortality among manual workers. Sociology and Social Research73(3): 119–128.
Carlson, P. (2000). Educational differences in self-rated health during the Russian transi-tion. evidence from Taganrog 1993-1994. Social Science and Medicine51(9): 1363– 1374.
Chiang, C. (1984).The Life Table and Its Applications.Krieger Publishing Co.
Cockerham, W. (1997). The social determinants of the decline of life expectancy in Russia and Eastern Europe: A lifestyle explanation. Journal of Health and Social Behaviour 38: 117–130.
Cockerham, W. C., Hinote, B. P., Abbott, P., and Haerpfer, C. (2004). Health life styles in central Asia: the case of Kazakhastan and Kyrgyzstan.Social Science and Medicine 59: 1409–1421.
Council of Europe (2003). Recent Demographic Developments in Europe. Strasbourg: Council of Europe Publishing.
Crimmins, E. (1981). The changing pattern of american mortality decline, 1940-77, and its implications for the future.Population and Development Review7: 229–254. Cruijsen, H. and Ekamper, P. (2004). Mortality in the 10 new EU member states and 2
accession countries: past and future patterns and trends at national level; final report. The Hague: NIDI.
Delcheva, E., Balabanova, D., and McKee, M. (1997). Under-the-counter payments for health care: Evidence from Bulgaria. Health Policy42(2): 89–100.
DeNavas-Walt, C., Proctor, B. D., and Mills, R. J. (2004). Income, Poverty, and Health Insurance Coverage in the United States: 2003. Washington, DC: U.S. Government Printing Office. Current Population Reports, P60-226, U.S. Census Bureau.
Drever, F., Whitehead, M., and Roden, M. (1996). Current patterns and trends in male mortality by social class (based on occupation). Population Trends86: 15–20. Elo, I. T., Martikainen, P., and Smith, K. P. (2006). Socioeconomic differentials in
mor-tality in Finland and the United States: The role of education and income. European Journal of Population22: 179–203.
Elo, I. T. and Preston, S. H. (1996). Educational differentials in mortality: United States, 1979-85.Social Science and Medicine42(1): 47–57.
Fawcett, J., Blakely, T., and Kunst, A. E. (2005). Are mortality differences and trends by education any better or worse in New Zealand? A comparison study with Norway, Denmark and Finland, 1980-1990s. European Journal of Epidemiology20(8): 683– 691.
Feachem, R. (1994). Health decline in Eastern Europe. Nature367: 313–314.
Feldman, J., Makuc, D. M., Kleinman, J. C., and Cornoni-Huntley, J. (1989). National trends in educational differentials in mortality.American Journal of Epidemiology129: 919–933.
Field, M. G. (2000). The health and demographic crisis in Post-Soviet Russia: A two-phase development. In: Field, M. G. and Twigg, J. L. (eds.).Russia’s Torn Safety Nets: Health and Social Welfare during the Transition., pp. 11–42, New York: St. Martin’s Press.
Green, W. H. (1997).Econometric Analysis. London: Prentice Hall.
Hajdu, P., McKee, M., and Bojan, F. (1995). Changes in premature mortality differentials by marital status in Hungary and in England and Wales. European Journal of Public Health5: 259–264.
Hu, Y. and Goldman, N. (1990). Mortality differentials by marital status: An international comparison. Demography27(2): 233–250.
365: 493–500.
Human Mortality Database (2008). University of California, Berkeley (USA), and Max Planck Institute for Demographic Research (Germany). [electronic resource]. Available at www.mortality.org or www.humanmortality.de (data downloaded on January 3rd, 2008).
Kohler, H.-P., Billari, F. C., and Ortega, J. A. (2002). The emergence of lowest-low fertility in Europe during the 1990s. Population and Development Review28(4): 641– 681.
Kohler, I. (2007). Adult and Old-Age Mortality Dynamics in Bulgaria and Russia. Odense: University Press of Southern Denmark.
Koskinen, S. and Martelin, T. (1994). Why are socioeconomic mortality differences smaller among women than among men? Social Science and Medicine38(10): 1385– 1396.
Kunst, A. E., Bos, V., Andersen, O., Cardano, M., Costa, G., Harding, S., Hemström, Ö., Layte, R., Regidor, E., Reid, A., Santana, P., Valkonen, T., and Mackenbach, J. P. (2004). Monitoring of trends in socioeconomic inequalities in mortality: Experiences from a European project.Demographic ResearchSpecial Collection S2(9): 229–254. Kunst, A. E., Groenhof, F., Borgan, J.-K., Costa, G., Desplanques, G., Faggiano, F.,
Hemström, Ö., Martikainen, P., gerö, D. V., Valkonen, T., and Mackenbach, J. P. (1998). Socio-economic inequalities in mortality. methodological problems illustrated with three examples from Europe. Revue d`epidemiologie et de sante publique46(6): 467–479.
Kunst, A. E. and Mackenbach, J. P. (1994). The size of mortality differences associated with educational level in nine industrialized countries. American Journal of Public Health84(932).
Leclerc, A., Lert, F., and Fabian, C. (1990). Differential mortality: Some comparisons between England and Wales, Finland and France, based on inequality measures. Inter-national Journal of Epidemiology19(4): 1001–1010.
Leinsalu, M., V˙agerö, D., and Kunst, A. E. (2003). Estonia 1989-2000: Enormous in-crease in mortality differences by education. International Journal of Epidemiology 32: 1081–1087.
Lillard, L. A. and Waite, L. J. (1995). Til death do us part: Marital disruption and mortal-ity.American Journal of Sociology100(5): 1131–1156.
Psychiatry187: 49–54.
Mackenbach, J., Kunst, A., Groenhof, F., Borgan, J.-K., Costa, G., Faggiano, F., P. Józan, M. L., Martikainen, P., Rychtarikova, J., and Valkonen, T. (1999). Socioeconomic inequalities in mortality among women and among men: An international study. Amer-ican Journal of Public Health89(12): 1800–1806.
Mackenbach, J. P., Bos, V., Andersen, O., Cardano, M., Costa, G., Harding, S., Reid, A., Hemström, O., Valkonen, T., and Kunst, A. E. (2003). Widening socioeconomic inequalities in mortality in six Western European countries. International Journal of Epidemiology32: 830–837.
Mackenbach, J. P., Cavelaars, A. E. J. M., Kunst, A. E., and Groenhof, F. (2000). So-cioeconomic inequalities in cardiovascular disease mortality: An international study. European Heart Journal21(14): 1141–1151.
Mackenbach, J. P., Huisman, M., Andersen, O., Bopp, M., Borgan, J.-K., Borrell, C., G. Costa, P. D., Donkin, A., Gadeyne, S., Minder, C., Regidor, E., Spadea, T., Valko-nen, T., and Kunst, A. E. (2004). Inequalities in lung cancer mortality by the educa-tional level in 10 European populations. European Journal of Cancer40(1): 126–135. Mackenbach, J. P., Kunst, A. E., Cavelaars, A. E. J. M., Groenhof, F., and Geurts, J. J. (1997). Socioeconomic inequalities in morbidity and mortality in Western Europe. the EU working group on socioeconomic inequalities in health. Lancet349(9066): 1655– 1659.
Martelin, T., Mäkelä, P., and Valkonen, T. (2004). Contribution of deaths related to alco-hol or smoking to the gender difference in life expectancy: Finland in the early 1990s. European Journal of Public Health14: 422.427.
Martikainen, P., Martelin, T., Nihtilä, E., Majamaa, K., and Koskinen, S. (2005). Differences in mortality by marital status in Finland from 1976 to 2000: Analyses of changes in maritalstatus distributions, socio-demographic and household composition, and cause of death.Population Studies59(1): 99–115.
Martikainen, P., Mäkelä, P., Koskinen, S., and Valkonen, T. (2001). Income differences in mortality: A register-based follow-up study of three million men and women. Inter-national Journal of Epidemiology30: 1397–1405.
Martikainen, P. and Valkonen, T. (1998). Do education and income buffer the effects of death of spouse on mortality? Epidemiology9: 530–534.
Massey, J. T., Moore, T. F., Parsons, V. L., and Tadros, W. (1989). Design and estima-tion for the Naestima-tional Health Interview Survey, 1985-1994. Naestima-tional Center for Health Statistics.Vital and Health Statistics Series2(110): 1–33.
McDonough, P., Williams, D. R., House, J. S., and Duncan, G. J. (1999). Gender and the socioeconomic gradient in mortality. Journal of Health and Social Behavior 40: 17–31.
Murphy, M., Glaser, K., and Grundy, E. (1997). Marital status and long-term illness in Great Britain.Journal of Marriage and the Family59(1): 156–164.
Murray, J. E. (2000). Marital protection and marital selection: Evidence from a historical-prospective sample of American men.Demography37(4): 511–521.
National Center for Health Statistics (1998). Vital statistics of the United States, 1995. [preprint]. Volumne II, Mortality, Part A, Section 6: Life tables. Hyattsville: National Center for Health Statistics.
National Center for Health Statistics (2000). National health interview survey. multiple cause of death public use files. 1986-1994 survey years. dates of death 1986-1997. [documentation]. Hyattsville, Maryland: National Center for Health Statistics. Preston, S. H. and Taubman, P. (1994). Socioeconomic differences in adult mortality and
health status. In: Martin, L. and Preston, S. (eds.).Demography of Aging., pp. 279–318, Washington, D.C.: National Academy Press.
Rogers, R. G. (1991). Marital status and mortality. (Population Program Working Paper No. WP-91-2).
Rogers, R. G., Hummer, R. A., and Nam, C. B. (2000). Living and Dying in the U.S.A: Behavioral, Health, and Social Differentials of Adult Mortality.New York: Academic Press.
Shkolnikov, V. M., Andreev, E. M., Jasilionis, S., Leinsalu, M., Antonova, O. I., and McKee, M. (2006). The changing relationship between education and life expectancy in central and eastern Europe in the 1990s. Journal of Epidemiology and Community Health60: 875–881.
Shkolnikov, V. M., Deev, A. D., Kravdal, Ø., and Valkonen, T. (2004). Educational differ-entials in male mortality in Russia and northern Europe. a comparison og an epidemi-ological cohort from Moscow an St. Petersburg with the male populations of Helsinki and Oslo.Demographic Research10: 1–26.
Lithuania.Social Science and Medicine64: 1392–1406.
Shkolnikov, V. M., Leon, D. A., Adamets, S., Andreev, E., and Deev, A. (1998). Edu-cational level and adult mortality in Russia: An analysis of routine data 1979 to 1994. Social Science and Medicine47(3): 357–369.
Sihvonen, A.-P., Kunst, A. E., Lahelma, E., Valkonen, T., and Mackenbach, J. P. (1998). Socioeconommic inequalities in health expectancy in Finland and Norway in the late 1980s. Social Science and Medicine47(3): 303–315.
Smith, K. R. and Waitzman, N. J. (2004). Double jeopardy: Interaction effects of marital status and poverty status on the risk of mortality. Demography31(3): 487–507. U.S. Census Bureau (2001). Health insurance coverage: 1995. [electronic resource].
URL: http://www.census.gov/hhes/hlthins/cover95.html.
Valkonen, T. (1987). Social inequality in the face of death. In:European Population Con-ference 1987. Plenaries., pp. 201–261, Helsinki: Central Statistical Office of Finland. Valkonen, T. (1989). Adult mortality and level of education: A comparison of six
coun-tries. In: Fox, J. (ed.).Health Inequalities in European Countries., pp. 142–162, Aldter-shot: Gower.
Valkonen, T. (1993). Problems in the measurement and international comparisons of socioeconomic differences in mortality.Social Science Medicine36: 409–418. Valkonen, T. and Martelin, T. (1988). Occupational class and suicide: An example of the
elaboration of a relationship. Research Reports Nr. 222.
Valkonen, T., Martikainen, P., and Blomgren, J. (2004). Increasing excess mortality among nonmarried elderly people in developed countries.Demographic Research Spe-cial Collection S2(12): 305–330.
Valkonen, T., Martikainen, P., Jalovaara, M., Koskinen, S., Martelin, T., and Mäkelä, P. (2000). Changes in socioeconomic inequalities in male mortality during economic boom and recession in Finland. European Journal of Public Health10: 274–280. Waite, L. J. and Lehrer, E. L. (2003). The benefits from marriage and religion in the
United States: A comparative analysis. Population and Development Review29(3): 255–277.
Appendix 1B: Estimated coefficients from Gompertz models for men
Bulgaria Finland U.S.
Level Slope Level Slope Level Slope
Model 1 - no covariats
−8.558 0.078 −9.523 0.087 −10.138 0.095 (0.023) (0.000) (0.105) (0.002) (0.145) (0.002)
Model 2 - by educational attainment
Constant −8.878 0.081 −9.403 0.083 −9.365 0.082
(medium education) (0.038) (0.001) (0.182) (0.003) (0.205) (0.003)
Low education 1.445 −0.019 0.522 −0.004 0.427 −0.019 (0.051) (0.001) (0.231) (0.004) (0.407) (0.007)
High education −0.621 0.006 −0.911 0.008 −1.301 0.018 (0.078) (0.001) (0.434) (0.008) (0.315) (0.005)
Model 3 - by marital status
Constant (unmarried) −6.987 0.059 −8.436 0.078 −10.779 0.103 (0.045) (0.001) (0.142) (0.002) (0.187) (0.003)
Married −2.063 0.026 −2.474 0.028 2.092 −0.025 (0.053) (0.001) (0.210) (0.004) (0.360) (0.006)
Model 4 - by marital status and educationa
Married
Constant −9.262 0.087 −10.521 0.098 −9.846 0.087
(medium education) (0.043) (0.001) (0.258) (0.004) (0.273) (0.004)
Low education 1.204 −0.016 −0.083 0.005 0.387 0.001 (0.059) (0.001) (0.343) (0.006) (0.432) (0.007)
High education −0.500 0.004 −0.595 0.004 −1.670 0.025 (0.087) (0.001) (0.548) (0.009) (0.388) (0.006)
Unmarried
Constant −7.509 0.065 −8.785 0.082 −8.496 0.077
(medium education) (0.079) (0.001) (0.265) (0.005) (0.395) (0.007)
Low education 1.533 −0.020 0.955 −0.013 0.721 −0.009 (0.100) (0.002) (0.323) (0.006) (0.765) (0.013)
High education −0.720 0.008 −0.078 −0.006 −0.044 −0.007 (0.172) (0.003) (0.747) (0.013) (0.571) (0.010)
Appendix 1C: Estimated coefficients from Gompertz models for women
Bulgaria Finland U.S.
Level Slope Level Slope Level Slope
Model 1 - no covariats
−10.642 0.099 −10.605 0.090 −10.328 0.089 (0.037) (0.001) (0.164) (0.003) (0.175) (0.003)
Model 2 - by educational attainment
Constant −10.374 0.092 −10.872 0.093 −10.049 0.083
(medium education) (0.062) (0.001) (0.285) (0.005) (0.268) (0.004)
Low education 0.279 −0.002 1.034 −0.014 1.325 −0.013 (0.084) (0.001) (0.363) (0.006) (0.478) (0.008)
High education −0.217 0.002 −0.223 −0.002 −0.615 0.008 (0.116) (0.002) (0.669) (0.012) (0.483) (0.008)
Model 3 - by marital status
Constant (unmarried) −9.714 0.086 −9.537 0.076 −10.423 0.088 (0.071) (0.001) (0.234) (0.004) (0.227) (0.004)
Married −1.075 0.014 −1.604 0.019 0.743 −0.006 (0.083) (0.001) (0.326) (0.005) (0.393) (0.006)
Model 4 - by marital status and educationa
Married
Constant −10.380 0.091 −11.402 0.098 −10.046 0.081
(medium education) (0.072) (0.001) (0.401) (0.007) (0.315) (0.005)
Low education 0.046 0.004 1.044 −0.013 1.052 −0.009 (0.098) (0.002) (0.510) (0.009) (0.558) (0.009)
High education −0.298 0.003 −0.164 0.000 −0.721 0.009 (0.139) (0.002) (0.864) (0.015) (0.508) (0.009)
Unmarried
Constant −9.718 0.084 −9.836 0.081 −9.587 0.080
(medium education) (0.124) (0.002) (0.401) (0.007) (0.473) (0.008)
Low education 0.811 −0.009 0.985 −0.014 1.751 −0.021 (0.164) (0.003) (0.513) (0.009) (0.788) (0.013)
High education −0.201 0.002 −0.281 −0.005 −0.457 0.006 (0.217) (0.004) (1.069) (0.018) (0.835) (0.014)
Appendix 2: Estimation of standard errors and 95% confidence
intervals based on Gompertz model
To account for uncertainty of our estimates, we calculate standard errors and 95%-confidence intervals using the following approach. The life expectancy30e40 and 30elost40 are defined as the persons years lived,30e40 = 30L40l40 , and the person years not lived,30elost40 = 30−30e40between ages 40 and 70, conditional on surviving to age 40.
In the Gompertz model, both30e40and30elost40 are nonlinear functions of the model parametersaandb, and the approximate variance of30e40and30elost40 can thus be obtained using theDelta Method(Green 1997) that is, the general technique for determining the asymptotic distribution of non-linear functions of estimated model parameters. Other methods that have been suggested for the calculating the variance of the life expectancy in life tables (e.g., Chiang 1984), are not applicable to the present context because the calculation of30e40is not based on a period life table (in which thenmxare independent
across age groups) but rather on a Gompertz model that is estimated on individual-level survival data, or cohort data.
The Gompertz model is implemented in STATA 10 asµ(x) = exp(a+bx)and can be estimated via maximum likelihood estimation based on individual-level mortality data. In particular, the STATA commandstregis used in our analyses to estimate the parameters aandbof this Gompertz model along with their variance-covariance matrixV. For the U.S. data, the estimation is additionally adjusted for the complex sampling design of the National Health Interview Survey (NHIS) using thesvycommand. The probabilitynpx
of surviving from agextox+nis then calculated from the Gompertz parameters as
npx=e
µ(x)−µ(x+n)
b ,
whereµ(x) =ea+bx. In addition, the derivatives d
da npxandddb npx, which are necessary
for the Delta Method below, are given by
d
danpx=npx·log(npx)
and
d
dbnpx=npx·
x µ(x)−(x+n)µ(x+n)−log(npx)
b .
Summing the survivorship probabilitiesnpxacross ages then yields
30e40= 30L40
l40 =
70 X
x=41
1
2l40(lx−1+lx) = 30 X
n=1
1
Using the Delta Method, the (asymptotic) variance of the estimated30e40and30elost40 can then be obtained using var(30ˆe40) =var(30eˆlost40) =GV Gˆ 0, whereVˆ is the variance-covariance matrix of the estimated Gompertz parametersaˆandˆb, andGis the gradient vector G=¡d
da30e40,ddb30e40
¢ , with
d
da30e40= 30 X
n=1
1 2(
d
dan−1p40+ d danp40)
and
d
db30e40= 30 X
n=1
1 2(
d