AUT J. Model. Simul., 49(2)(2017)133-142 DOI: 110.22060/miscj.2016.850
NGTSOM: A Novel Data Clustering Algorithm Based on Game Theoretic and
Self-Organizing Map
M. Ghayekhloo1*, M. B. Menhaj2, R. Azimi1, E. Shekari3
1 Young Researchers and Elite Club, Qazvin Branch, Islamic Azad University, Qazvin, Iran 2 Dept. of Electrical Engineering, Amirkabir University of Technology, Tehran, Iran
3 Dept. of Decision Science and Knowledge Engineering, University of Economic Sciences, Tehran, Iran ABSTRACT: Identifying clusters is an important aspect of data analysis. This paper proposes a novel data clustering algorithm to increase the clustering accuracy. A novel game theoretic self-organizing map (NGTSOM ) and neural gas (NG) are used in combination with Competitive Hebbian Learning (CHL) to improve the quality of the map and provide a better vector quantization (VQ) for clustering data. Different strategies of Game Theory are proposed to provide a competitive game for non-winning neurons to participate in the learning phase and obtain more input patterns. The performance of the proposed clustering analysis is evaluated and compared with that of the K-means, SOM and NG methods using different types of data. The clustering results of the proposed method and existing state-of-the-art clustering methods are also compared which demonstrates a better accuracy of the proposed clustering method.
Review History:
Received: 13 October 2015 Revised: 11 April 2016 Accepted: 29 October 2016 Available Online: 15 November 2016
Keywords:
Clustering game theory self-organizing map vector quantization
1- Introduction
Identifying clusters is an important factor in data analysis. Generally, for extracting data, eliminating duplicate data, and making these data usable, several techniques have been proposed as data mining methods [1]. As a result, data mining has emerged as an important area of research [2]. Clustering can be considered as the most important thing in unsupervised learning. Clustering involves finding a structure within a collection of unlabeled data. The cluster is referred to as sets of data that are similar to each other. In clustering, data can be split into clusters where the similarity between the data in each cluster is minimum and the similarity between the data within different clusters is maximum [3]. So far, numerous data clustering approaches have been proposed.
Below, we provide a short overview of the most important clustering algorithms proposed in the literature.
In [4], the K-means clustering algorithm is proposed. The K-Means method is one of the partition-based data clustering methods in data mining. This method, despite its simplicity, is a basic method for many other methods of questing (such as Fuzzy-based decompositions). In the K-means algorithm, at first, the K number of input patterns are randomly selected for algorithm initialization. Then, the n-K remaining members are assigned to the nearest cluster. After assigning all members, the cluster centers are recalculated and assigned to the clusters according to the new centroids, and this continues until the centroids of the clusters stay constant. In [5], the K-Medoids algorithm was proposed to solve the problem of the K-means algorithm. Each cluster was defined by the most central medoid in which it is located. First, K data are considered as initial centroids (medoid) and then each data is assigned to the closest Medoid, and the initial clusters are
formed. In an iteration-based process, the most central data in each cluster is considered as the new centroid and each data is assigned to the nearest centroid. The remaining steps of this algorithm match the K-means algorithm. The Fuzzy C-means (FCM) algorithm [6], [7] puts forward a concept called partial membership. In fact, in the FCM algorithm, each data belongs to all clusters. The degree of belonging is represented by a partial membership determined by a fuzzy clustering matrix. A genetic algorithm-based K-means (GA-K-means) algorithm was proposed in [8] to provide a global optimum for the clustering. In this method, the K-means clustering algorithm was used as a search operator instead of a crossover. A biased mutation operator was also proposed for clustering that helps the K-means algorithm to avoid local minima. In [9], the global K-means method was developed which is a gradual method for clustering; in this algorithm, at each step, a cluster centroid is dynamically calculated using a global search method based on iterative running the K-means algorithm and adds the appropriate initial points. However, it is not appropriate for clustering medium-sized and large-scale datasets due to its heavy computational burden. K-means++ algorithm was proposed in [10] for obtaining initial centroids for K-means algorithm that yields the near-optimal solution. The main drawback of the K-means++ is its inherent sequential nature, which limits the effectiveness of the method for the high-volume data. An artificial bee colony K-means (ABC-K-means) clustering approach was proposed in [11] for optimal partitioning of data objects into a fixed number of clusters. The reference [12] introduced a hybrid algorithm, named DE-K-means, that is a combination of differential evolution and K-means algorithms. The differential evolution optimization algorithm was used as a global optimization method and the resultant clustering solutions were fine-tuned and corrected using the K-means algorithm.
Data clustering with SOP [13] has found wide applications in artificial neural networks. However, SOM clustering method often fails to deliver satisfactory results, especially when clusters have arbitrary shapes. Therefore, the weakness of this method at accurately and efficiently detecting the non-spherical clusters makes it more effective on synthetic datasets rather than the real dataset.
The reference [13] developed a hybrid clustering technique of the K-means++ and SOM algorithm to improve the clustering accuracy. However, the aforementioned limitation of the K-means++ was not addressed [22].
In this paper, we propose a novel data clustering method called NGTSOM that presents more accurate clustering results for the various types of synthetic and real datasets, compared to SOM algorithm and its improved version. The proposed method is a combination of game theory-based optimization techniques and SOM to develop a novel clustering method. In the game theory, each player has a pay-off function and a strategy set. Where each player’s strategy is optimal given the strategies of all other players. In [14] different strategies were proposed to provide a more selective mechanism for the weight adaptation of neurons. This enables the winning neuron to select one among its neighbors to update its weight and therefore avoids the complexity of the original SOM algorithm where the weight vectors of all neighboring neurons are updated.
Unlike the previous studies where the weight vectors of dead neurons are far from the input patterns without having any chance to contribute in the learning phase, several different strategies are assigned to the non-winning neurons to provide a competitive game and improve the vector quantization. The neighborhood is defined based on the neurons’ distances in the input space to accelerate the learning process and enhance the quality of the map when compared to the original SOM where the neighborhood is defined based on the neurons’ distances in the two-dimensional lattice. A NGTSOM is proposed in this paper based on a new technique to make a proper selection of initial values of neuron’s weights. Besides, five new strategies are proposed to increase the non-winning neuron’s participation in the learning phase and enhance the clustering performance.
The rest of the paper is organized as follows. Section 2 provides a brief description of the original SOM algorithm and game theory concepts. It also explains the proposed clustering method. Section 3 demonstrates a case study where the mean squared errors (MSEs) are calculated for the proposed method and the existing K-means, the original SOM, SOM++ and NG clustering. Finally, section 4 concludes the paper.
2- Methodology A. SOM Algorithm
SOM is an unsupervised artificial neural network (ANN) that performs the VQ or clustering tasks [15]. The distribution of the n-dimensional input patterns is estimated using the neurons arranged in a two-dimensional lattice in the network.
Let X = [x1, x2… xn] represent an arbitrary input pattern and
Mi = [mi1, mi2, …, min] denote the weight vector of neuron i.
An iterative process is used for the training of SOM. For each iteration, the Euclidean distances between the neurons and a pattern randomly selected from the set of input patterns are calculated. The neuron whose distance is the minimum is chosen as the winning neuron with the weight vector mc. The
best matching unit (BMU) is the winning neuron calculated by:
The weight vectors of the neurons are then updated according to
where hci is the neighborhood function given by
In the above relation, 0<α(t)<1 is the learning rate.
rc and ri∈R2 are the positions of the winning neuron and neuron i in the two-dimensional lattice of units. The parameter σ is used to control the neighborhood size.
B. Game Theory
Game theory is the study of situations where players with conflicting interests are involved [16]. A strategy set and a payoff function are defined for each player. The strategies determine players’ actions in each stage of the game. The pay-off for each player is governed by both his and the other players’ actions. The players’ objective is to maximize their payoffs. Two major classes of the game are non-cooperative and cooperative games. Each player’s action is independent of others’ in a non-cooperative game, whereas in the cooperative games the players can choose to form coalitions and establish cooperation.
C. The Proposed Data Clustering Method
A NGTSOM is proposed in this paper to achieve better clustering results. The proposed clustering method uses a hybrid approach based on a new technique to make a proper selection of initial values of neurons’ weights for SOM method along with the game theories approach to provide a better clustering performance. The steps of NGTSOM algorithm are as follows:
2- 1- Proposed method for a proper selection of initial values of neurons’ weights
Let X=[x1,…,xn] be a set of n data. The selection of K initial
points as the initial weights of neurons is as follows:
1. Remove duplicate data vectors (temporarily) and store them in the new dataset X`=[x`1,…,x`m], (XX`).
2. Sort the data vectors in the dataset X in ascending order based on their infinity (Chebychev) norms. The Chebychev norm of any vector V=[V1,V2,…,Vn] in a d-dimensional space,
Rd, is calculated by:
3. Divide the dataset X`, consisting of m elements, into K sub-datasets, with P=|m / k| , according to Eq. (6), such that the elements of are distributed among the sub-datasets X`1 to X`k.
{
}
c i
X M− = mini X M− (1)
(2)
(3)
(5)
(6)
(
)
( )
( ) ( )
( )
i i ci i
M t 1 M t h t X t M t+ = + −
( )
( )
.exp
2( )
22
−
=α
−
σ
c ici
r r
h t
t
t
1 2
V = max V , V ,..., V∞
{
d}
' ' '
1 1 P
' ' '
2 P+1 2P
' ' '
K (K-1)×(P)+1 KP
K
' '
k k=1
X = [x ,..., x ], X = [x ,..., x ],
X = [x ,..., x ].
X = X
4. Now, we have K sub-datasets where each one is used to determine only one of the K initial weights of neurons. Eq. (7) is used to determine each of the K initial weights from the sub-datasets {X`1, X`2,..., X`k}.
where xi is the related data for the l-th sub-dataset.
Fig. 1 shows the flowchart of the proposed method to determine the initial weights of neurons.
2- 2- Proposed strategies to improve the quality of the map
To resolve the shortcomings of the original SOM and enhance the quality of the map, five strategies are proposed as follows:
Strategy A: Winning neuron and its neighbors adjust their
weights to approach the input pattern and minimize the Euclidean distance.
The following strategies are assigned to the non-winning neurons based on their situations and the current iteration number.
Strategy O: An equal probability is considered for the patterns
distributed within the input space. Therefore, the non-winning neurons may increase their chance of reaching a pattern by moving in the opposite direction of the winning neuron. This strategy is more appropriate at early iterations.
Strategy S: Another strategy for the non-winning neurons is
to stay in their current positions. This is more applicable to the recent winning neurons or the neurons which have won many times as they most likely approached regions with sufficient input patterns.
Strategy R: The neurons, which have not won for a long time
are probably wandering in regions without sufficient or any input patterns. Strategy R requires random moves for these neurons to increase their chance of approaching regions with sufficient input patterns. This strategy is more applicable at early iterations.
Strategy B: The last strategy for the non-winning neurons
involves approaching the neuron defined as the best player. The best player is identified using an error variable Ec calculated by:
The error variable is the sum of the cumulative error of the neuron and the Euclidean distance between the input pattern and BMU. A counter is calculated for the number of wins the neuron achieved to become BMU.
The average cumulative error is then calculated by dividing the error variable of (5) by the counter variable. Then, The neurons with small average cumulative errors are selected as the best players.
Table 1 summarizes the proposed strategies considered for each neuron.
The topology of the input data is preserved by the topographic mapping of SOM. It means that the close input patterns remain close to the trained map [15].
The topology preserving the property of the map needs defining the neighborhood function based on the distance between neurons in the 2-D lattice, which this lattice domain is not appropriate for the proposed strategies. NG as a SOM-based method is used in this paper to define the neighborhood based on the neurons’ distances in the input space rather than their distances in the lattice [21].
The neurons are ranked based on their distances from the input pattern where an integer ki is assigned to represent their
(7) (8) P =1 ' (1 ) ( )
init =
∑
ix
, ≤ ≤l
i
l K
WTF
P
Sort data set X in ascending order Inputs:
Input pattern: X={x1,…,xn} Number of Final Cluster: K
Split into K sub-data sets{X ,X ,...,X }1 2 K
m=1
Calculate to calculate m-th initial neuron weight1
(x )
/
P m i i initWT
P
= =∑
Add initWTm to InitWTArray
initWTF = InitWTArray; Output:
Initial neuron weight: initWTF={w01,…,w0K} Is m < K?
m=m+1 Yes
No
End X
Fig. 1. Flowchart for the proposed method to determine the initial weights of neurons
Table 1. proposed strategies for neurons
Neuron Strategy
Winning neuron and its neighbors
A (Approach): Winning neuron and its close neighbors move
towards the input pattern
Non-winning neurons
O (Opposite): Neurons move in the opposite direction of the
winning neuron S (Stay): Neurons stay in their
current positions R (Random): Neurons move to
random positions in the input space
B (Best player to approach): Neurons approach a neuron
surrounded by ample input patterns
( )
=
(
− +
1
)
−
c c c
competes equally with FCM, SOM, NG, and SOM++. The time complexity of K-means++ and K-means is better than that of our proposed algorithm. However, as the data volume increases, the K-means++ algorithm may not be as efficient as our proposed method due to its sequential initialization [18].
3- Case Studies
This section evaluates the clustering accuracy of the proposed NGTSOM and its comparison with the K-means, SOM, and NG, based on the type of the test data. Dynamic validity index (DVI) [19] and Mean Squared Error (MSE) are used as the performance indicators given by:
where the IntraRatio and InterRatio are defined as follows.
Here, IntraRatio stands for the overall compactness of clusters whereas the InterRatio represents the overall separation of clusters. The lesser is the value of DVI, the more is the quality of the clusters [20].
where N is the number of data points in the cluster k, and Xi(k)
is a data point in the cluster k.
DVI and MSE values are calculated for different clustering algorithms, including the proposed NGTSOM, K-means, original SOM and NG method.
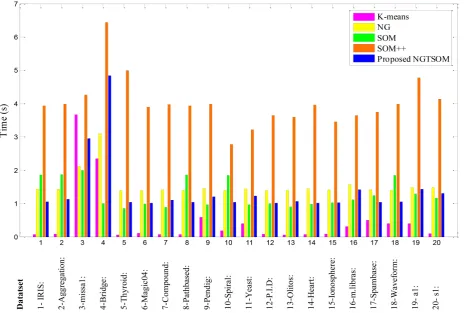
Tables 3 to 9 and Table 11 show the comparison results of different clustering methods for image data, Birch-sets, S-sets, A-sets, Dim-sets, Unbalance, Categorical, Shape sets, UCI datasets and large datasets respectively, that are presented in Figures 3 to 9, and Table 10 respectively. These data are available online at joensuu [23], uci websites [24]. Fig. 10 shows the processing time of different clustering algorithms on the twenty-sample dataset.
A. Image data
proximities. For example, 0 is assigned for neuron i0 as the
closest neuron, 1 for neuron i1 as the second-closest and so on.
NG adjusts the weight vectors of the neurons as:
The neighboring relationship between neurons is determined using CHL in combination with NG [21].
Fig. 2 shows the flowchart for the developed NGTSOM.
D. Time complexity
The Proposed NGTSOM algorithm has a time complexity of the order n2.K, i.e. O(n2.K), where n is the total number of
data, K is the number of clusters.
Table 2 provides the time complexity orders for the proposed method and well-known clustering algorithms, namely K-means++, original K-means, K-medoids, FCM, SOM, SOM++ algorithm.
Time complexities comparison in Table 2 shows that the proposed NGTSOM algorithm is faster than K-medoids and
(
+ =1)
( )
+ α( )
expσ−( )
( )
−( )
i
i i k i
M t M t t * X t M t
t (9) (10) (11) (12) (13) (14) (15) (16)
Initialize the neurons’ weight vectors and place the close values
in the center of the input space
Is the termination criteria satisfied?
Yes No
End
Randomly select and apply an input pattern to determine the winning and non-winning neurons
Update the neurons’ weight vectors
Is neuron the BMU? Yes
No
Apply strategies O, S, R, and B
based on the neurons’ situations
and the current iteration number Apply strategy A
Fig. 2. Flowchart for the proposed clustering method (NGTSOM)
Table 2. Comparison of time complexities in the proposed NGTSOM algorithm and several well-known clustering
algorithms.
Fig. 3. The image datasets used for the case study Algorithm Time complexity
K-means++ O(n.K)
K-means O(n.K)
K-medoids O(n2.K)
FCM O(n.K2)
SOM O(n2.K)
NG O(n2.K)
SOM++ O(n2.K)
NGTSOM O(n2.K)
1,2,...,
min { ( ) ( )}
=
= +
k K
DVI IntraRatio k InterRatio k
( ) (k)= Intra k
IntraRatio
MaxIntra
( ) (k)= Intra k
InterRatio MaxInter 1 1 ( ) = − =
∑ ∑
− i ki x C
Intra k x c
N
1,2,...,
( )= =max ( ( ))
i K
Intra k Intra i
(
)
(
)
2 , 2 2 1 1 1 ( ) = ≠ = − = − − ∑
∑
k i j i jk i
i j i j i j
j
Max c c Inter k
Min c c c c
2 ( ) 1 1 1
. = =
=
∑ ∑
K N k −i k
k i
MSE X C
B. Birch-sets
C. S-sets
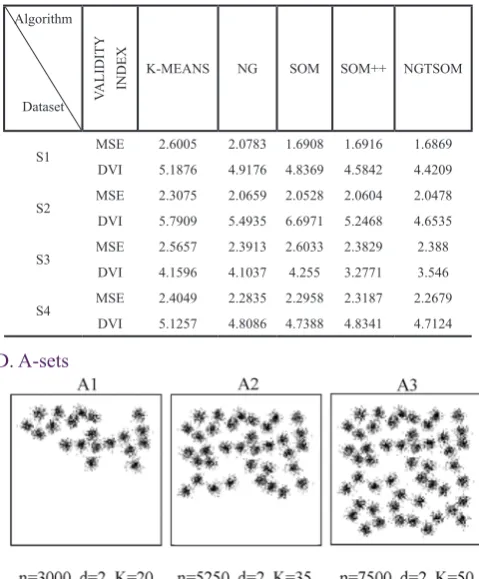
D. A-sets
E. Dim-sets
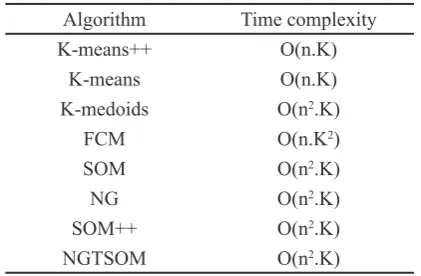
Table 3. dvi and mse values for different clustering techniques
Fig. 4. The Birch-sets data
Fig. 6. The A-sets data
Table 6. mse errors for different clustering techniques (*103)
Table 4. mse errors for different clustering techniques (*104)
Fig. 5. The S-sets data Fig. 7. The Dim-sets data
Table 5. mse errors for different clustering techniques (*104)
DATASET
VALIDITY INDEX
Algorithm
K-MEANS NG SOM SOM++ NGTSOM
Missa1 DVI 0.5430 0.5790 0.5429 0.5761 0.5226
MSE 8.5057 8.7217 8.5051 8.7043 8.3833
Bridge DVI 3.0756 3.2438 3.0558 3.3010 3.03225
MSE 23.7018 24.7107 23.5826 25.0539 23.4412
House DVI 2.9509 2.7775 2.6919 2.5666 2.5326
MSE 22.9531 21.9127 21.3991 20.6473 20.4433
DATASET
VALIDITY INDEX
Algorithm
K-MEANS NG SOM SOM++ NGTSOM
Birch1 DVI 5.6669 6.1914 5.9981 6.3002 5.2162
MSE 1.5933 1.6245 1.6056 1.4758 1.4304
Birch1 DVI 4.6916 5.0187 4.8518 4.9087 4.5475
MSE 0.1626 0.1269 0.1174 0.1206 0.1206
Birch1 DVI 1.5424 1.3588 5.7178 5.6998 4.8064
MSE 0.9075 0.8711 0.9303 0.8468 0.805
Algorithm
Dataset VALIDITY
INDEX K-MEANS NG SOM SOM++ NGTSOM
S1 MSE 2.6005 2.0783 1.6908 1.6916 1.6869
DVI 5.1876 4.9176 4.8369 4.5842 4.4209
S2 MSE 2.3075 2.0659 2.0528 2.0604 2.0478
DVI 5.7909 5.4935 6.6971 5.2468 4.6535
S3 MSE 2.5657 2.3913 2.6033 2.3829 2.388
DVI 4.1596 4.1037 4.255 3.2771 3.546
S4 MSE 2.4049 2.2835 2.2958 2.3187 2.2679
DVI 5.1257 4.8086 4.7388 4.8341 4.7124
Algorithm
Dataset VALIDITY
INDEX K-MEANS NG SOM SOM++ NGTSOM
A1 MSE 1.0289 0.9889 0.8985 0.9541 0.9045
DVI 7.4801 7.1703 6.2614 7.3365 6.2857
A2 MSE 1.2635 0.918 0.9077 0.9778 0.9157
DVI 6.8725 5.0229 5.8155 5.8148 5.6643
A3 MSE 1.0208 0.9846 0.9914 0.9662 0.9588
DVI 4.4269 4.1524 4.6915 4.6384 4.3779
Number of Objects: n, Number of Attributes: d, Number of Clusters: k
Number of Objects: n, Number of Attributes: d, Number of Clusters: k
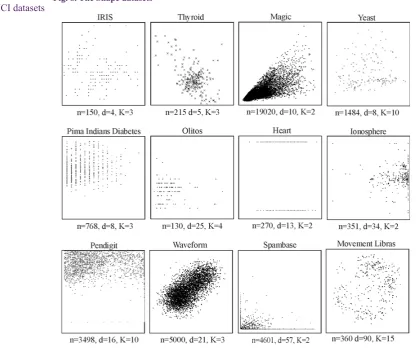
F. Shape sets
G. UCI datasets Algorithm
Dataset VALIDITY
INDEX K-MEANS NG SOM SOM++ NGTSOM
dim0128 MSE 1.2187 0.8003 0.8411 0.1184 0.1014
DVI 6.1818 7.5285 6.4593 4.3152 4.1253
dim0256 MSE 1.1413 0.8158 0.9016 0.3293 0.1516
DVI 4.3574 3.858 3.3955 3.4779 3.2682
Dim0512 MSE 1.143 0.6788 0.2209 0.4409 0.0353
DVI 9.6591 8.6686 6.013 7.2092 4.7449
Dim1024 MSE 0.3041 0.4117 0.1646 0.456 0.1451
DVI 5.8128 6.3031 4.8413 6.5526 4.5804
Algorithm
Dataset VALIDITY
INDEX K-MEANS NG SOM SOM++ NGTSOM
Aggregation MSE 1.2102 1.1972 1.1931 1.1811 1.1546
DVI 5.1546 5.1251 5.1802 5.1595 5.0771
Compound MSE 1.0207 0.9045 0.9027 0.9105 0.9017
DVI 4.0955 4.1309 3.995 3.6298 3.6667
Pathbased MSE 1.6132 1.617 1.6133 1.6118 1.6115
DVI 5.9863 5.2928 5.3845 5.3392 5.2758
Spiral MSE 1.9629 1.9668 1.9664 1.9623 1.9601
DVI 7.1675 7.4465 6.9785 6.6029 6.2503
Table 7. mse errors for different clustering techniques (*105)
Fig. 8. The Shape datasets
Fig. 9. UCI datasets
Table 8. mse errors for different clustering techniques
H. Large datasets
Algorithm
Dataset VALIDITY INDEX
K-MEANS NG SOM SOM++ NGTSOM
ConfLongDemo MSE 47.51651 44.70387 40.199705 43.300355 37.2299 DVI 96.24162 91.50179 86.54654 88.52581 76.35052
MiniBooNE MSE 342.651 336.173 331.4545 359.9345 331.4545
DVI 693.9291 677.8689 663.3355 721.0998 663.3355 MNIST MSE 120.651 121.60603 107.76003 103.76453 100.24753
DVI 246.145 249.5109 216.0154 209.584 206.847
KDDCUP04Bio MSE 8105.0631 8105.0631 8653.4586 8905.1184 8105.0631 DVI 16212.94 16212.94 17311.81 17811.7 16212.94 Algorithm
Dataset Number of objects Number of attributes Number of clusters
ConfLongDemo 164,860 3 11
MiniBooNE 130,065 50
---MNIST 10000 748 10
KDDCUP04Bio 145751 74 2000
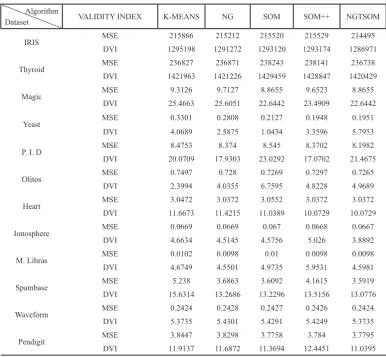
Algorithm
Dataset VALIDITY INDEX K-MEANS NG SOM SOM++ NGTSOM
IRIS MSE 215866 215212 215520 215529 214495
DVI 1295198 1291272 1293120 1293174 1286971
Thyroid MSE 236827 236871 238243 238141 236738
DVI 1421963 1421226 1429459 1428847 1420429
Magic MSE 9.3126 9.7127 8.8655 9.6523 8.8655
DVI 25.4663 25.6051 22.6442 23.4909 22.6442
Yeast MSE 0.3301 0.2808 0.2127 0.1948 0.1951
DVI 4.0689 2.5875 1.0434 3.3596 5.7953
P. I. D MSE 8.4753 8.374 8.545 8.3702 8.1982
DVI 20.0709 17.9303 23.0292 17.0702 21.4675
Olitos MSE 0.7497 0.728 0.7269 0.7297 0.7265
DVI 2.3994 4.0355 6.7595 4.8228 4.9689
Heart MSE 3.0472 3.0372 3.0552 3.0372 3.0372
DVI 11.6673 11.4215 11.0389 10.0729 10.0729
Ionosphere MSE 0.0669 0.0669 0.067 0.0668 0.0667
DVI 4.6634 4.5145 4.5756 5.026 3.8892
M. Libras MSE 0.0102 0.0098 0.01 0.0098 0.0098
DVI 4.6749 4.5501 4.9735 5.9531 4.5981
Spambase MSE 5.238 3.6863 3.6092 4.1615 3.5919
DVI 15.6314 13.2686 13.2296 13.5156 13.0776
Waveform MSE 0.2424 0.2428 0.2427 0.2426 0.2424
DVI 5.3735 5.4301 5.4291 5.4249 5.3735
Pendigit MSE 3.8447 3.8298 3.7758 3.784 3.7795
DVI 11.9137 11.6872 11.3694 12.4451 11.0395
Table 9. mse errors for different clustering techniques
Table 10. large datasets used for the case study
The calculated MSE values show that the proposed NGTSOM improves the quality of the clustering when compared to the other clustering methods.
Based on the results presented in Fig.10, the proposed NGTSOM algorithm has a faster processing time than the SOM++ and NG method and is comparable with SOM clustering approach.
4- CONCLUSION
In this paper, a novel Game theory-based data clustering algorithm is proposed by combining a new initialization method, Game theory, and SOM algorithm. The performance of the proposed NGTSOM is evaluated using several different synthetics and real datasets and the results show a significant accuracy improvement for the proposed data clustering model. This is due to the more competitive game provided by the proposed strategies. It resolves the major problem of the existing clustering techniques where the weight vectors of non-winning neurons are far from the input patterns without having any chance to contribute in the learning phase. The proposed NGTSOM were compared with K-means, NG, SOM and SOM clustering algorithm. The comparison results demonstrate the improved clustering quality of the proposed NGTSOM.
REFERENCES
[1] R. Duwairi, M. Abu-Rahmeh, A novel approach for initializing the spherical K-means clustering algorithm, Simulation Modelling Practice and Theory, 54 (2015) 49-63.
[2] H. Mashayekhi, J. Habibi, S. Voulgaris, M. van Steen, GoSCAN: Decentralized scalable data clustering, Computing, 95(9) (2013) 759-784.
[3] S.M.R. Zadegan, M. Mirzaie, F. Sadoughi, Ranked k-medoids: A fast and accurate rank-based partitioning algorithm for clustering large datasets, Knowledge-Based Systems, 39 (2013) 133-143.
[4] J. MacQueen, Some methods for classification and analysis of multivariate observations, in: Proceedings of the fifth Berkeley symposium on mathematical statistics and probability, Oakland, CA, USA., 1967, pp. 281-297. [5] H.-S. Park, C.-H. Jun, A simple and fast algorithm for
K-medoids clustering, Expert systems with applications, 36(2) (2009) 3336-3341.
[6] J.C. Dunn, A fuzzy relative of the ISODATA process and its use in detecting compact well-separated clusters, (1973).
[7] S. Miyamoto, K. Umayahara, Methods in hard and fuzzy clustering, in: Soft computing and human-centered machines, Springer, 2000, pp. 85-129.
[8] T. Johnson, S.K. Singh, Genetic algorithms based enhanced K Strange points clustering algorithm, in: Computing and Network Communications (CoCoNet), 2015 International Conference on, IEEE, 2015, pp. 737-741.
[9] A. Likas, N. Vlassis, J.J. Verbeek, The global k-means clustering algorithm, Pattern recognition, 36(2) (2003) 451-461.
of careful seeding, in: Proceedings of the eighteenth annual ACM-SIAM symposium on Discrete algorithms, Society for Industrial and Applied Mathematics, 2007, pp. 1027-1035.
[11] C. Zhang, D. Ouyang, J. Ning, An artificial bee colony approach for clustering, Expert Systems with Applications, 37(7) (2010) 4761-4767.
[12] W. Kwedlo, A clustering method combining differential evolution with the K-means algorithm, Pattern Recognition Letters, 32(12) (2011) 1613-1621.
[13] T. Kohonen, The self-organizing map, Proceedings of the IEEE, 78(9) (1990) 1464-1480.
[14] S. Wu, T.W. Chow, Clustering of the self-organizing map using a clustering validity index based on inter-cluster and intra-inter-cluster density, Pattern Recognition, 37(2) (2004) 175-188.
[15] Y. Dogan, D. Birant, A. Kut, SOM++: integration of self-organizing map and k-means++ algorithms, in: International Workshop on Machine Learning and Data Mining in Pattern Recognition, Springer, 2013, pp. 246-259.
[16] A. Neme, S. Hernández, O. Neme, L. Hernández, Self-Organizing Maps with Non-cooperative Strategies (SOM-NC), in: WSOM, Springer, 2009, pp. 200-208.
[17] A.P. Engelbrecht, Computational intelligence: an introduction, John Wiley & Sons, 2007.
[18] L. Pavel, Game theory for control of optical networks, Springer Science & Business Media, 2012.
[19] J. Shen, S.I. Chang, E.S. Lee, Y. Deng, S.J. Brown, Determination of cluster number in clustering microarray data, Applied Mathematics and Computation, 169(2) (2005) 1172-1185.
[20] S. Subramani, S. Balasubramaniam, Post mining of diversified multiple decision trees for actionable knowledge discovery, in: International Conference on Advanced Computing, Networking and Security, Springer, 2011, pp. 179-187.
[21] T. Martinetz, K. Schulten, A” neural-gas” network learns topologies, (1991).
[22] B. Bahmani, B. Moseley, A. Vattani, R. Kumar, S. Vassilvitskii, Scalable k-means++, Proceedings of the VLDB Endowment, 5(7) (2012) 622-633.
[23] http://cs.uef.fi/sipu/datasets.
[24] https://archive.ics.uci.edu/ml/datasets.
Please cite this article using: