AUT J. Model. Simul., 50(2) (2018) 189-194 DOI: 10.22060/miscj.2018.14958.5117
3D Gabor Based Hyperspectral Anomaly Detection
Maryam ImaniFaculty of Electrical and Computer Engineering, Tarbiat Modares University, Tehran, Iran
ABSTRACT: Hyperspectral anomaly detection is one of the main challenging topics in both military and civilian fields. The spectral information contained in a hyperspectral cube provides a high ability for anomaly detection. In addition, the costly spatial information of adjacent pixels such as texture can also improve the discrimination between anomalous targets and background. Most studies miss the worthful spatial characteristics. Moreover, some works that include the spatial features in the anomaly detection process extract features from each hyperspectral band that is a two dimensional image while the original structure of hyperspectral cube contains three dimensions. Ignoring the nature of hyperspectral image leads to lose the contained spectral-spatial correlations in the hyperspectral cube. To deal with this difficulty, in this work, the fused spectral and spatial features obtained by applying 3D Gabor filters are proposed for hyperspectral anomaly detection. Exploiting the 3D structure of hyperspectral cube by capturing multiple scales, orientations and its spectral-dependent characteristics provides an appropriate spectral-spatial feature space for anomalous targets detection. The extracted features are applied to the regularized RX detector to provide the detection map. The experiments show the superior performance of the proposed Gabor 3D based detector in terms of detection accuracy and computation time.
Review History:
Received: 10 September 2018 Revised: 14 October 2018 Accepted: 27 October 2018 Available Online: 8 November2018
Keywords:
Anomaly detection 3D Gabor filter RX detector Hyperspectral image
1- Introduction
Hyperspectral images by providing significant spectral information contained in hundreds of contiguous and narrow spectral channels have attracted much attention for target detection. In a target detection problem, the aim is to recognize a specific target from the image background. Dependent on available prior knowledge about the spectrum of interested target, the target detection problems are divided into two main groups. In the first group, the spectral signature of considered target is known and the problem is supervised [1-3] while in the second group, the spectrum of target is unknown and problem is unsupervised [4-6]. The unsupervised target detection is also called anomaly detection that is our main focus in this paper. Anomalies are interested targets with a low probability of occurrence and different spectral signature compared to local background samples. The Reed-Xiaoli (RX) detector is one of the most known and widely used detectors [7]. The RX detector by assuming Gaussian distribution for background pixels measures the likelihood of belonging a pixel to the background data. The RX detector can be applied globally or locally where the mean vector used in the Mahalanobis distance is estimated globally or locally, with a local estimate of that. Due to the limited number of pixels surrounding the pixel under test and the high dimensionality of hyperspectral image, the covariance matrix likely becomes singular. To deal with this difficulty, the regularized RX detector has been proposed [8].
Most of anomaly detectors just use the high volume of spectral information and ignore the valuable spatial information. Adjacent pixels usually have similar spectral, shape and textural features which can simplify the
discrimination between two classes of anomalous target and background clutter. The recently proposed anomaly detector and morphology-based collaborative representation (MCR) detector use the structural shapes of image scene as a costly source of spatial features [9]. The MCR detector estimates the background by applying the collaborative representation [10] to the morphological profile of hyperspectral image [11]. MCR by utilizing the multi-scale morphological filters provides a range of different shape features of data. Another powerful tool for extraction of spatial features especially texture characteristics is Gabor filters. Gabor filters can extract components in different scales and orientations from images [12]. These filters by ability of joint localization in both original and transform feature space are powerful tools for texture extraction. 2D Gabor filters have been widely used for texture analysis in different applications of image processing [13-14]. 2D Gabor filters have been also used for hyperspectral image processing band by band or by applying a feature reduction method such as principal component analysis (PCA) [15]. Due to the 3D spectral-spatial structure of hyperspectral image and the tightly packed correlation between spectral and spatial information, the use of 3D Gabor filters may be preferred. Some works have used the 3D Gabor filters for hyperspectral image classification [16].
In this paper, for the first time, the 3D Gabor filters are introduced for hyperspectral anomaly detection. Instead of straightly applying the anomaly detector to the original spectral channels of hyperspectral (HS) image, the 3G Gabor filters are firstly applied to HS to simultaneously extract spectral-spatial features. The energy of each 3D Gabor filtered image is considered as a new feature. Then, the Regularized RX detector is applied to the 3G Gabor features for anomaly detection. The experimental results done on a
real hyperspectral image acquired by AVIRIS remote sensor show the superior performance of the proposed method with respect to several competitors.
2- 3D Gabor filter-based detector
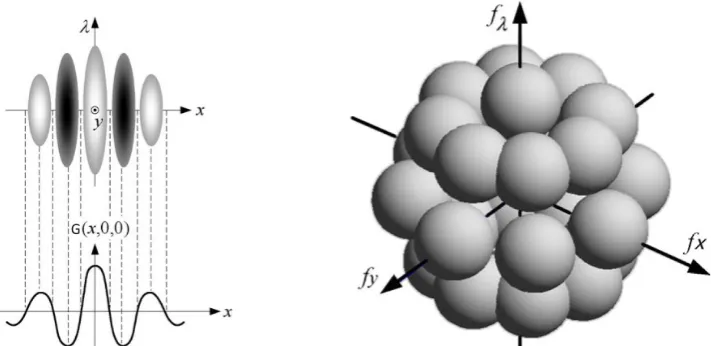
A Gabor filter is obtained through modulating a normal (Gaussian) envelope by a sinusoidal function. For example, an illustration of a 3D Gabor filter in the radiance domain and a filter bank in the frequency domain are shown in Fig. 1. A 3D Gabor filter in the spectral-spatial feature space is defined by:
(
)
(
) (
)
, , , , , , , , ,
f
G ϕ θ x yλ =N x y λ E x yλ (1) where
(
)
( )
(2 2 2) 2
1 2 3
3 2 1
, , ,
2
x y
N x y λ e σ λ
π σ
− + +
= (2)
composes the Gaussian envelope component, and
(
, ,)
(
2(
x y)
)
E x y λ =exp j π f x f y f+ + λλ (3)
indicates the sinusoidal component. The pair
( )
x y, and λ are used as spatial and wavelength variables, respectively. The width of the Gaussian envelope and also the filter scale is determined by parameterσ
. The frequency of component(
, ,)
E x y λ , i.e.
(
f f fx, ,y λ)
, determines the central frequencyof the 3D Gabor filter where it makes the orientation of the filter:
(
, ,) (
, ,)
/ ; 2 2 2x y λ f f fx y λ f f fx fy fλ
σ σ σ = = + + (4)
The Gabor filter in radiance domain can be related to the one in the frequency domain according to the following geometry (see Fig. 2):
sin cos , sin sin , cos
x y
f = f ϕ θ f = f ϕ θ fλ = f ϕ (5) To have a sufficient characterization of the background and anomalous targets, a 3D Gabor filter bank containing I J K× × orientations and frequencies should be designed through a set of Gabor filters as follows [17]:
(
)
, , , , ; ; , ;2
i j k
m
f i i j k
f j k
G x y f
J K
ϕ θ λ = ϕ = π θ = π
0, , 1; 0, , 1; 0, , 1
i= … −I j= … −J k= … K− (6)
where fi is the amplitude,
(
ϕ θj, k)
makes the orientation of the central frequency, and fm indicates the highest value of variable f . The half-peak orientation( )
Bo and radial( )
Br bandwidths are defined by:1 2ln2
2tan 2 o
B
f πσ
−
=
(7)
2 2 2ln2
log
2 2ln2
r f
B
f πσ πσ
+
=
−
(8)
By having
f
andB
o, the value ofσ
is calculated by:2ln2 tan
2 2o
B f
σ π
=
(9)
According to previous experiments [17-18], to provide a sufficient spectral-spatial characterization of hyperspectral images, the parameters of 3D Gabor filter are selected as:
45 ; 4; 0.5
o m
B = I J K= = = f =
[
0.5, 0.25, 0.125, 0.0625]
f =
, 0,45 ,90 ,135
θ ϕ =
For each scale, 13 orientations are considered. Therefore,
Fig. 1. A single 3D Gabor filter viewed with orientation (1, 0, 0) and two dimensions in the radiance domain (left) and 13 filters in three dimensions for a single scale in the frequency domain (right).
Fig. 2. Illustration of θ and φ angles for 3D Gabor filter
for 4 scales, a total of 4
×
13=52 Gabor filters are provided. Generally it is assumed that the 3D Gabor filter is designed for applying to a R C B× × cube with R C B= = . But, in practice, for a hyperspectral image, a region of hyperspectral cube with R rows and C columns(
R C=)
has B spectral bands where BR C, . Thus, the Gabor filter should be modified by substituiting λ′ =kλ, k = B/R in (1)-(3) to provide stretching Gabor filters by the factor k along direction λ.The output of each Gabor filter is a cube with the same size of hyperspectral image. Let p x yi
(
, ,λ)
be the output of filteringobtained by ith 3D Gabor filter. Its energy defines the Gabor features for pixel
( )
x y, as follows:( )
1(
)
2 01
, B , ,
i i
q x y p x y Bλ
λ −
=
=
∑
(10)The vector q
( )
x y, =q x y1( )
, , ,…q x y52( )
, that captures52 three dimensional Gabor features is obtained by applying a 3D Gabor filter bank containing 52 filters. The 3D Gabor feature cube is then used as the input of the Regularized RX detector as follows:
(11)
where μ and are the mean vector and covariance matrix estimated by N pixels of background, respectively; β is the regularization parameter and I denotes the identity matrix. Each testing pixel
( )
x y, with a large value of D x y( )
, is an anomalous target with a higher probability. In contrast, a( )
,D x y with a small value means that the associated pixel belongs to the background.
3- Experiments
To assess the performance of anomaly detectors, the false alarm rate (FAR) is calculated by:
fd
N FAR
N
= (12) where Nfd indicates the number of anomalous pixels falsely
detected andN is the total number of samples under test in the image. In addition, the probability of detection (PD) is defined as follows:
cd
t
N PD
N
= (13)
where Ncd denotes the number of correctly detected samples
and Nt represents the number of target samples. To have an accurate comparison, the receiver operating characteristic (ROC) curve is plotted where it illustrates the relationship between PD and FAR. The closer ROC to the top left corner is, the more accurate detector will be. In other words, obtaining a higher PD at the same FAR with respect to other methods means a more accurate detection. To provide a quantitative comparison, the area under ROC curve (AUC) that is a value between 0 and 1 is calculated where a higher AUC close to 1 is equivalent with more accuracy.
The experiments are carried out on the real San Diego hyperspectral image acquired by AVIRIS with the spatial resolution of 3.5 m per pixel [19]. This dataset contains 224 original spectral bands where the range of wavelength is 0.37-2.51 um and 189 bands are remained after removing water absorption bands and the ones with low SNR. The results of anomaly detection using 3D Gabor features (Gabor3D) is compared to the original spectral bands of
hyperspectral image (HS), 2D Gabor features (Gabor2D), 2D Gabor features stacked on HS (Gabor2D+HS) and also the MCR anomaly detector. While HS and Gabor2D just use the spectral and spatial information, respectively, the Gabor2D+HS, Gabor3D and MCR methods use both spectral and spatial information. It should be noted that there is a significant difference between Gabor2D+HS and Gabor3D. In Gabor2D+HS, at first the PCA transformation is applied to the HS image to find the first principal component (PC1). Then, a Gabor filter bank with 4 scales and 13 orientations (totally 52 filters) is applied to the PC1 to provide 52 two-dimensional Gabor features. Then, the 2D Gabor features are stacked on the spectral features (HS) to provide a spectral-spatial representation of data. But, the 3D Gabor filter bank is directly applied to the hyperspectral cube to provide the spectral-spatial feature space. In other words, Gabor2D+HS without considering the 3D structure of hyperspectral image individually extracts 2D Gabor features and, then, combines them with the spectral ones.
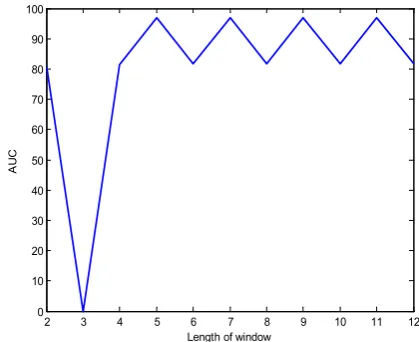
In contrast, Gabor3D by considering the 3D nature of hyperspectral image fuses the spectral and Gabor features implicitly. For implementation of 3D Gabor filter, different window sizes are experimented and the window size of 5
×
5(
R C= =5)
is selected for applying filters (see Fig. 3). The factork
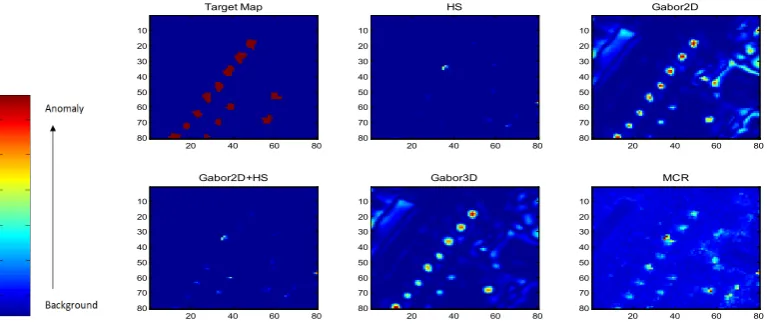
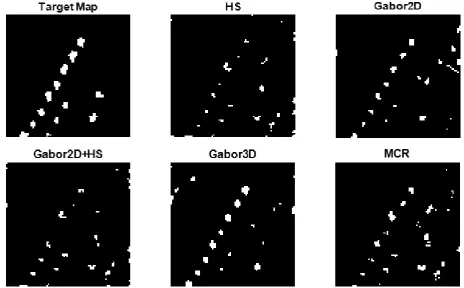
is equal to k B R= / =189 / 5 for San Diego dataset. To have a fair comparison between Gabor2D and Gabor3D, the both are implemented with window size of 5×5, 4 scales and 13 orientations.The ROC curves of different methods are shown in Fig. 4. The AUC value and computation times are reported in Table 1. The detection maps are also shown in Fig. 5. The detector output for each pixel of hyperspectral image is a value as a measure of belonging to the anomalous target. In each detection map, a color nearer to red indicates a higher likelihood to belong to the anomaly and a color nearer to blue means a higher likelihood to belong to the background. To provide a binary detection map with white color as targets and black one as background, a threshold value is considered on the detection maps. The appropriate threshold value for each anomaly detection method is obtained by experiments. The binary detection maps are shown in Fig. 6. According to the obtained results, the lowest detection accuracy is related to HS which only uses the spectral features. While the accuracy of Gabor2D is 95.13, Gabor2D+HS provides
2 3 4 5 6 7 8 9 10 11 12
0 10 20 30 40 50 60 70 80 90 100
Length of window
A
UC
82.67. In other words, stacking the original spectral features on the 2D Gabor features decreases the detection accuracy. This result may be because of disregarding the 3D nature of hyperspectral image where the spectral and spatial features have an internal relationship and correlation which is not considered in Gabor2D+HS. From the computation time point of view, Gabor2D (with 52 features) runs faster than the original spectral features of HS (189 bands). Among the spectral-spatial anomaly detectors, Gabor2D+HS (with 52+189 features), which has less than 1 minute running time, is the fastest and MCR (with 27 morphological features where it was shown in previous work that 27 features provide the best detection accuracy), spends more than 9 minutes running time and is the slowest method. The proposed Gabor3D (with 52 features) runs in 1.32 minutes that is a reasonable speed compared to other methods where it can obtain the highest detection accuracy too.
About the computational complexity of different anomaly
detectors, the following points can be mentioned:
1) The MCR method is implemented in several steps. In the first step, the PCA transformation is applied to extract the principal components (PCs) of HS. Then, the morphological filters (opening and closing operators by reconstruction) are applied to each PC to extract useful spatial features such as shape and structural characteristics from it. After that, the collaborative representation is applied to the morphological profile of each PC in order to anomaly detection. Eventually, the majority voting rule is used as a decision fusion method to find the final anomaly map. According to what said, MCR has high computational burden due to computations of PCA transformation, morphological filters, collaborative representation and decision fusion framework. So, it is expected that MCR is the slowest anomaly detector in comparison with other methods. 2) By comparing the outputs of the regularized RX detector
on HS and Gabor2D, it can be found that the use of original hyperspectral image (HS) provides higher computational burden than the use of Gabor2D features. It would be expected as HS cube has dimensionality of 189 while the Gabor2D cube has dimensionality of 52. In other words, by applying two-dimensional Gabor filters to HS Gabor2D extracts useful spatial features from the image and does not contain the redundant information of HS. So, the use of Gabor2D is not only preferable due to computational simplicity but also it is useful in terms of detection accuracy.
3) By comparing Gabor2D and Gabor2D+HS results, it can found that adding the original hyperspectral image bands to the features extracted by the Gabor2D filter adds redundant information to the Gabor2D cube that reduces the detection accuracy. Moreover, as expected the Gabor2D+HS cube with dimension of 52+189 has higher computations than Gabor2D with dimension of 52 and HS with dimension of 189.
4) Applying three dimensional Gabor filters for simultaneous extraction of spectral and spatial features in order to preserve the 3D nature of hyperspectral cube imposes more computations than Gabor2D. 0 0.1 0.2 0.3 0.4 0.5 0.6 0.7 0.8 0.9 1
0 0.1 0.2 0.3 0.4 0.5 0.6 0.7 0.8 0.9 1
False alarm rate
P robabi lit y of det ec tion HS Gabor2D Gabor2D+HS Gabor3D MCR
Fig. 4. ROC curve of different anomaly detectors.
Table 1. AUC values and running time of different anomaly
HS Gabor2D Gabor2D+HS Gabor3D MCR
AUC 71.80 95.13 82.67 96.98 95.39
Time 24.63 4.23 46.27 78.98 556.29
Target Map
20 40 60 80 10 20 30 40 50 60 70 80 HS
20 40 60 80 10 20 30 40 50 60 70 80 Gabor2D
20 40 60 80 10 20 30 40 50 60 70 80 Gabor2D+HS
20 40 60 80 10 20 30 40 50 60 70 80 Gabor3D
20 40 60 80 10 20 30 40 50 60 70 80 MCR
20 40 60 80 10 20 30 40 50 60 70 80
4- Conclusion
A 3D Gabor filter based anomaly detector was proposed for hyperspectral images in this paper. The experiments showed that the proposed 3D Gabor-based method can provide the highest detection accuracy. It considers the 3D nature of hyperspectral cube and implicitly fuses the spectral and spatial features. The experiments show the superior performance of the proposed anomaly detector compared to several methods such as 2D Gabor filter-based anomaly detector and MCR with a reasonable computation time.
References
[1] Y. Niu, B. Wang, Extracting Target Spectrum for Hyperspectral Target Detection: An Adaptive Weighted Learning Method Using a Self-Completed Background Dictionary, IEEE Transactions on Geoscience and Remote Sensing, 55(3) (2017) 1604-1617.
[2] M. Imani, Attribute profile based target detection using collaborative and sparse representation, Neurocomputing, 313 (2018) 364-376.
[3] M. Diani, M. Moscadelli, G. Corsini, Improved Alpha Residuals for Target Detection in Thermal Hyperspectral Imaging, IEEE Geoscience and Remote Sensing Letters, 15(5) (2018) 779-783.
[4] E. Lo, Hyperspectral anomaly detection based on a generalization of the maximized subspace model, 2013 5th Workshop on Hyperspectral Image and Signal Processing: Evolution in Remote Sensing (WHISPERS), Gainesville, FL, 2013, pp. 1-5.
[5] L. Lee, D. Paylor, C. Chang, Anomaly discrimination and classification for hyperspectral imagery, 2015 7th Workshop on Hyperspectral Image and Signal
Processing: Evolution in Remote Sensing (WHISPERS), Tokyo, 2015, pp. 1-4.
[6] M. Imani, Hyperspectral Anomaly Detection Using Differential Image, IET Image Processing, 12(5) (2018) 801-809.
[7] S. Reed, X. Yu, Adaptive multiple-band CFAR detection of an optical pattern with unknown spectral distribution, IEEE Transactions on Acoustics, Speech, and Signal Processing, 38 (10) (1990) 1760–1770.
[8] N. M. Nasrabadi, Regularization for spectral matched filter and RX anomaly detector, Proc. SPIE, 6966 (696604) (2008).
[9] M. Imani, Anomaly detection using morphology-based collaborative representation in hyperspectral imagery, European Journal of Remote Sensing, 51(1) (2018) 457– 471.
[10] M. Imani, H. Ghassemian, Weighted Joint Collaborative Representation Based On Median-Mean Line and Angular Separation, IEEE Transactions on Geoscience and Remote Sensing, 55(10) (2017) 5612 – 5624.
[11] J. López-Fandiño, D. B. Heras, F. Argüello, R. J. Duro, CUDA multiclass change detection for remote sensing hyperspectral images using extended morphological profiles, 2017 9th IEEE International Conference on Intelligent Data Acquisition and Advanced Computing Systems: Technology and Applications (IDAACS), Bucharest, 2017, pp. 404-409.
[12] T. Viarbitskaya, A. Dobrucki, Elimination of distortions in the recorded sound of the violin using cascade-integrator-comb filters based on Gabor transform and pitch-shifting algorithm, 2016 Signal Processing:
Algorithms, Architectures, Arrangements, and Applications (SPA), Poznan, 2016, pp. 56-61.
[13] L. Tao, H. K. Kwan, Fast Parallel Approach for 2-D
DHT-Based Real-Valued Discrete Gabor Transform, IEEE Transactions on Image Processing, 18(12) (2009) 2790-2796.
[14] M. Imani, H. Ghassemian, GLCM, Gabor, and
Morphology Profiles Fusion for Hyperspectral Image Classification, IEEE proceedings of the 24th Iranian Conference on Electrical Engineering (ICEE 2016), Shiraz, Iran, 2016, pp. 460-465.
[15] W. Li, Q. Du, Gabor-Filtering-Based Nearest Regularized Subspace for Hyperspectral Image Classification, IEEE Journal of Selected Topics in Applied Earth Observations and Remote Sensing, 7(4) (2014) 1012-1022.
[16] L. He, J. Li, A. Plaza, Y. Li, Discriminative Low-Rank Gabor Filtering for Spectral–Spatial Hyperspectral Image Classification, IEEE Transactions on Geoscience and Remote Sensing, 55 (3) (2017) 1381-1395.
[17] S. Jia, L. Shen, J. Zhu, Q. Li, A 3-D Gabor Phase-Based Coding and Matching Framework for Hyperspectral Imagery Classification, IEEE Transactions on Cybernetics, 48(4) (2018) 1176-1188.
[18] T. C. Bau, S. Sarkar, G. Healey, Hyperspectral Region Classification Using a Three-Dimensional Gabor Filterbank, IEEE Transactions on Geoscience and Remote Sensing, 48(9) (2010) 3457-3464.
[19] M. Imani, RX Anomaly Detector with Rectified
Background, IEEE Geoscience and Remote Sensing Letters, 14(8) (2017) 1313-1317.
Pleasecitethisarticleusing:
Maryam Imani, 3D Gabor Based Hyperspectral Anomaly Detection,