SUMMER 2017, Vol 3, No 1, JOURNAL OF HYDRAULIC STRUCTURES Shahid Chamran University of Ahvaz
Journal of Hydraulic Structures J. Hydraul. Struct., 2017; 3(1):57-70
DOI: 10.22055/jhs.2017.13317
Proposing a Discharge Coefficient Equation for Triangular
Labyrinth Spillways Based on Laboratory Studies
Majid Heydari1 Akbar Mohammadiha2 Shima Abolfathi2
Abstract
Labyrinth spillways are considered as suitable and economic structures because, firstly, their discharge flow rate, under low hydraulic heads, is high, and secondly, they occupy less space. The flow over these spillways is three-dimensional and is influenced by several parameters. This study endeavors to offer a new equation for the calculation of the discharge flow of triangular labyrinth spillways by using the Buckingham Theory, Genetic Algorithm, the equations offered by other researchers and non-dimensional laboratory parameters. To do so, several experiments were carried out in the hydraulic laboratory of the Department of water science at BuAli Sina University in Hamedan. These experiments were done on triangular labyrinth spillways in a straight condition in certain flumes which were 10 meters long, 0.83 meters wide, and 0.5 meters height. To verify the recommended equation, the authors used the information related to the labyrinth spillway design of Bartletts Ferry dam in the US and the equation for triangular spillways suggested by previous researcher. The results indicated that the equation recommended in this study is far more accurate than the previous one.
Keywords: Triangular Labyrinth Spillway, Discharge Coefficient, Buckingham Theory, Genetic Algorithm.
Received: 16 March 2017; Accepted: 25 May 2017
1. Introduction
Multidimensional (Labyrinth) spillways are made of several interconnected sides whose crest axis is, unlike spillways with a linear crest whose axis is straight, a broken line, and this is one of the defining characteristics of these spillways. One of the advantages of these spillways, compared with normal ones, is the fact that in a certain width, they have longer crests which
1 Dept. of Water Science and Engineering, Faculty of Agriculture, Bu-Ali Sina Univ., Hamadan, 65174,
Iran, [email protected] (Corresponding author)
2 Dept. of Water Science and Engineering, Faculty of Agriculture, Bu-Ali Sina Univ., Hamadan, 65174,
SUMMER 2017, Vol 3, No 1, JOURNAL OF HYDRAULIC STRUCTURES Shahid Chamran University of Ahvaz
enables them to provide more discharge (Mehboudi 2015, Crookston 2010). For instance, the labyrinth spillway built over the Beni Badhel dam in Algeria before the Second World War has 12 times the discharge capacity of a standard ogee spillway (Erpicum et al. 2012). Labyrinth spillways are more efficient in low hydraulic heads, and the increase in the head will result in the gradual decrease of their water transmissity (Taylor 1968). These spillways can have such different shapes as rectangular, triangular and trapezoidal (Crookston 2010). Existing documents suggest that the majority of labyrinth spillways have been built since 1970 (Falvey 2003). An overview of these spillways can be seen in Figure 1.
These multifaceted spillways can be used in different situations and conditions, and this is one of the reasons why they have been developed increasingly. For instance, these spillways can be used to channel huge floods under low hydraulic heads and to increase the capacity of the reservoir storage (Crookston 2010). As an example of their widespread usage, one can refer to the New Mexico Interstate Stream Commission’s request of The Bureau of Reclamation to increase the storage capacity of the Ute reservoir in New Mexico by using a gated spillway or any other suitable and economic structure. The Bureau suggested a multifaceted spillway made of several smaller triangular and trapezoidal spillways because they believed that it could increase the length of the canal width (Houston 1982). Another example is the inflow design flood of the Hyrum dam which was reevaluated in 1981. It was discovered that the existing structure could not pass the flood; as a result, it was suggested that an ungated auxiliary labyrinth spillway be built (Houston 1983). Moreover, a labyrinth spillway was recommended for increasing the reservoir storage capacity and the discharge flow of the Prado dam built over the Ana Santa River in Los Angeles (Copeland and Fletcher 2000).
A= Half-length of weir apex B= Length of weir side wall H= Upstream piezometric head Hv= Upstream velocity head Ht= Upstream total head
Hd= Downstream piezometric head L= Developed length of one cycle=2B+4A
L
w= Length magnification
Le= Total length of weir=nL n= Number of weir cycles in plan p= Weir height
w= Width of one cycle of weir
w
p= Vertical aspect ratio
W= Total width of spillway= nw α= sidewall angle
HT
p= Total Head to weir height ratio
T= Wall thickness
Figure 1. An overview of linear labyrinth spillways with details (Copeland and Fletcher 2000).
SUMMER 2017, Vol 3, No 1, JOURNAL OF HYDRAULIC STRUCTURES Shahid Chamran University of Ahvaz
quality of the water via an aerated flow controller (Ghare et al. 2008), they can be used as a tilt breaker structure that can reduce energy (Ghare et al. 2008), they can be used as both service and emergency spillways in reservoir dams where the water level is high, as is the flow rate (Tacail et al. 1990), they can be used to stabilize and protect the depth of the flow (Erpicum et al 2012), their low costs of construction and maintenance compared with gated spillways is also another advantage of labyrinth spillways (Erpicum et al 2012). Nevertheless, one of their weaknesses, compared to linear spillways, is that they are more susceptible to damage and blockage caused by ice and floating objects (Taylor 1968).
SUMMER 2017, Vol 3, No 1, JOURNAL OF HYDRAULIC STRUCTURES Shahid Chamran University of Ahvaz
(2016) indicated that trapezoidal labyrinth spillways are superior to linear and circular ones when it comes to the discharge flow rate and their ease of construction.
Most of the researchers have used the tests carried out by themselves or others in order to determine the discharge coefficient. Moreover, in most cases, they have taken into consideration only some of the important factors, for example, they have only focused on the impact of 𝐻𝑝𝑡. These researchers have failed to consider that other factors can also have significant influence on the discharge coefficient. Some of these other factors include: height, thickness, the shape of the crest, the longitudinal magnification ratio, the angle of the side-wall and the main direction of the flow, the length of the apex and the submerging depth of the downstream, etc. (Tacail et al. (1990), Tullis et al. 1995). Due to the fact that it is both time-consuming and costly to consider all of the influential parameters that influence the discharge flow, the present study endeavors to take into account more influential parameters, compared to other studies, and it uses the theory of Buckingham and genetic algorithm to come up with a simple, precise, practical, and common equation that can estimate the discharge flow of labyrinth spillways.
2. Discharge Equation in Labyrinth Spillways
Figure 1 shows a design for a labyrinth spillway. The passing flow through this spillway could be considered as a function of the following parameters.
𝑓(𝑄, 𝐴, 𝐵, 𝐿, 𝑛, 𝐿𝑒, 𝑤, 𝑊, 𝑝, 𝐷, 𝑇, 𝐻𝑡, 𝐻𝐷, 𝑔, 𝜇, 𝜎, 𝑐𝑟𝑒𝑠𝑡 𝑠ℎ𝑎𝑝𝑒, 𝛼) = 0 (1) In this equation, Q is the spillway discharge, A is half the length of the apex (which could be considered zero if it is triangular), B is the length of the crest on the adjacent side, L is the length of the spillway’s crest in one cycle, which equals 4𝐴 + 2𝐵, n is the number of cycles, 𝐿𝑒 the total effective length of the spillway, which equals nL, w is the width of a cycle in the spillway,
W is the total width of the spillway, which equals nw, p is the crest height from the bed of the upstream spillway, D is the crest height from the bed of the downstream spillway, T is the thickness of the spillway’s wall, 𝐻𝑡 is the total hydraulic head in the upstream, which equals the
sum of the hydrostatic head over the (H) spillway and the velocity head (𝐻𝑣), 𝐻𝐷 is the total
hydraulic head in the downstream of the spillway, g is gravitational acceleration, 𝜇 is water viscosity, 𝜎 is the surface tension, and α is the angle formed by the side wall of the spillway and the main flow direction. B ،α ،W and 𝐿𝑒 are dependent parameters; therefore, their impact in
equation (1) will be indirect. For instance, if we know what L and w are, we can then determine α. So, we’ll have:
𝑓(𝑄, 𝐴, 𝐿, 𝑛, 𝑤, 𝑝, 𝐷, 𝑇, 𝐻𝑡, 𝐻𝐷, 𝑔, 𝜇, 𝜎, 𝑐𝑟𝑒𝑠𝑡 𝑠ℎ𝑎𝑝𝑒) = 0 (2)
If the scale of the model and the velocity are chosen carefully, we can then ignore the influence of the surface tension and the viscosity (U. S. Department of Interior 1980).
SUMMER 2017, Vol 3, No 1, JOURNAL OF HYDRAULIC STRUCTURES Shahid Chamran University of Ahvaz
𝑓( 𝑄
𝐿𝑝32√𝑔
,𝐴
𝑤, 𝐿 𝑤, 𝑛,
𝐷 𝑝,
𝑇 𝑝,
𝐻𝑡 𝑝,
𝐻𝐷 𝑝 ,
𝑤
𝑝, 𝑐𝑟𝑒𝑠𝑡 𝑠ℎ𝑎𝑝𝑒) = 0 (4)
If we divide the first non-dimensional parameter 𝑄
𝑤𝐻𝑡 3 2√𝑔
by the fourth parameter (n), we can
write the equation of discharge flow of the labyrinth spillway as:
𝑄 = 𝑛𝑤𝐻𝑡 3
2√𝑔𝑓 (𝐴 𝑤,
𝐿 𝑤,
𝐷 𝑝,
𝑇 𝑝,
𝐻𝑡 𝑝,
𝐻𝐷 𝑝 ,
𝑤
𝑝, 𝑐𝑟𝑒𝑠𝑡 𝑠ℎ𝑎𝑝𝑒) = 𝐶𝑑𝑛𝑤𝐻𝑡 3
2√𝑔 = 𝐶𝑑𝑊𝐻𝑡 3
2√𝑔 (5)
Therefore, the discharge coefficient will be: 𝐶𝑑 = 𝑓 (𝑤𝐴,𝑤𝐿,𝐷𝑝,𝑇𝑝,𝐻𝑡
𝑝 , 𝐻𝐷
𝑝 , 𝑤
𝑝, 𝑐𝑟𝑒𝑠𝑡 𝑠ℎ𝑎𝑝𝑒) (6)
3. Genetic Algorithm
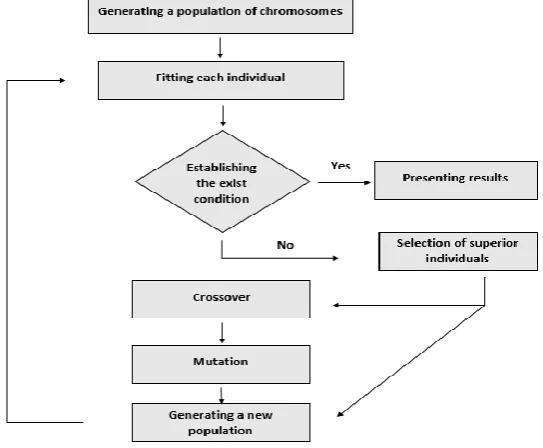
Genetic Algorithm (GM for short) is derived from Evolutionary Algorithms and Darwin’s Natural Selection principle. In fact, the search method is based on optimization algorithms as well as the structure of the genes, chromosomes, and inheritance, and it has three different functions of selection, Crossover, and Mutation. This method was first introduced by Holland (1960) in the University of Michigan and was later expanded and developed by a number of his students (1970) including Goldberg (Coley 1999). In Genetic Algorithms, several answers are generated for a given problem based on the random selection of a few digits in the intended range (fitting). This selection of answers is called the initial population, and each individual answer is called a chromosome. Later, superior chromosomes are selected by the operators of the genetic algorithm and are combined and put together (Crossover). The next stage is mutation which is performed on the combined chromosomes. Finally, the current population is added to the recent population of combined and mutated chromosomes (replacement) (matlabsite.com). The schema of this method is presented in figure 2.
SUMMER 2017, Vol 3, No 1, JOURNAL OF HYDRAULIC STRUCTURES Shahid Chamran University of Ahvaz
4. The Objective Functions and Decision Variables
The decision variables in this study include the coefficients of the discharge equations in table 1 as well as the coefficients of the proposed equations (specified later in this paper). The RMSE index could be used to determine the optimum values of these parameters (Fox 1981).
(7)
21 n
i i i
RMSE O S n
In the above equation, O and S are the observed value and the calculated value of discharge flow in the labyrinth spillway, respectively, and n is the number of data. The RMSE index follows the nature of the data, i.e. if O and S, which are observed and calculated values of discharge flow in the labyrinth spillway, are calculated in liters per second, then the results of this equation will also be in liters per second. The RMSE index could be equal to or greater than zero. However, the ideal value for this index is zero.
5. Material and Method
SUMMER 2017, Vol 3, No 1, JOURNAL OF HYDRAULIC STRUCTURES Shahid Chamran University of Ahvaz
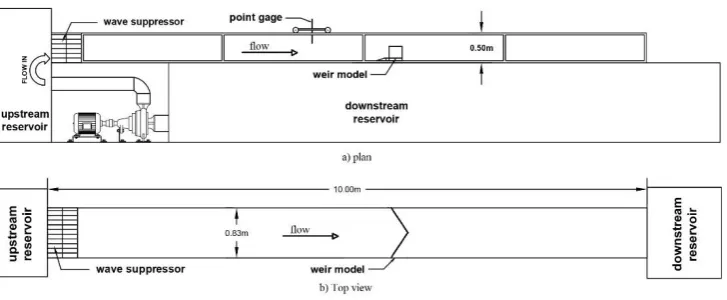
Figure 3. An overview of the laboratory flume used in this study.
The tests were carried out as follows. After a stable and smooth flow was established, the water level in the upstream (the hydrostatic head) was measured by a laminator from a distance where the current was not yet impacted by the spillway. Having established the hydrostatic head in the upstream as well as the height of the spillway, the hydrostatic head in the downstream was also determined. On the other hand, having known the hydrostatic head and cross-sectional area of the canal, the researchers were also able to determine the corresponding velocity head in the upstream of the spillway. Other conditions of this experiment include: the design of labyrinth spillways is usually done in a way that prevents submerging currents in the downstream (Tullis et al. 1995); therefore, these tests were carried out in non-submerging conditions of the spillway. Furthermore, all necessary steps were taken to ignore the interference of overflow tables. The maximum Froude number 0.57 was determined in all of the tests; moreover, Reynolds number is large enough so that we can ignore the effect of viscosity forces. No aerating equipment was used during the tests, and the whole aeration process was done naturally. Finally, it should be noted that the roughness of the floor and the walls of the canal as well as the roughness of the spillway surface were fixed.
6. Results and Discussion
Triangular spillways were chosen for the study of labyrinth spillways (A=0) in this research; therefore, it should be noted that the influence of the shape of the spillway on the discharge rate was not analyzed in this study. Moreover, due to the fact that all the experiments and tests were carried out in non-submerging conditions, and that in such conditions, the depth of the downstream current has no impact on the discharge flow (Falvey 2003), the researchers rewrote equation 6 in the following way:
(8) 𝐶 = 𝑓 (𝐿
𝑤, 𝐷 𝑝,
𝑇 𝑝,
𝐻𝑡 𝑝 ,
𝑤 𝑝)
SUMMER 2017, Vol 3, No 1, JOURNAL OF HYDRAULIC STRUCTURES Shahid Chamran University of Ahvaz
Table 1. Eequations for the calculation of the discharge flow rate of triangular labyrinth spillways
Cd
Researcher
No.
1
𝑘1+ 𝑘2𝑤𝑝 𝑘7
+ 𝑘3𝐻𝑝𝑡
𝑘8
+ 𝑘4𝐷𝑝
𝑘9
+ 𝑘5𝑤𝐿
𝑘10
+ 𝑘6𝑇𝑝
𝑘11
𝑤 𝑝 𝑤 𝑝 + 𝑘12
Author, based on
Lux and Hinchliff
(1985)’s study 1
𝑘1( 𝐻𝑡
𝑝) 𝑘2
(𝐿 𝑤)
𝑘3 Ghodsian (2009)*
2
* Ghodsian (2009) used 𝑄 = 𝐶𝑑√𝑔𝐿𝑒𝑝
3
2 to calculate the discharge flow.
In Table 1, the values of Ki(i= 1, 2, …, 17) are decision variables and are determined through optimization methods and based on the information of the specific spillway. Firstly, the simulation model of the discharge equation (equation 5) was prepared in MATLAB based on each of the discharge coefficient equations in Table 1.
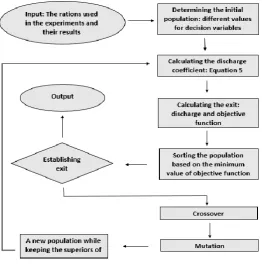
Figure 4. The schema of the suggested model
SUMMER 2017, Vol 3, No 1, JOURNAL OF HYDRAULIC STRUCTURES Shahid Chamran University of Ahvaz
then, the discharge flow of the labyrinth spillway was calculated by using one of the discharge equations in table 2. The next stage of the test included the calculation of the target (objective) function (RMSE), based on the selected discharge equation, for the initial population, followed by the arrangement of the population based on the minimum value of the target function. Furthermore, based on the sorted population and using the roulette wheel method, the parents of the next generation are selected. After mutation and crossover, a new population that keeps the superior individuals is selected. The discharge coefficient is determined based on the new population, and this process continues until the difference between the calculated values and the observed values reaches its minimum value. The schema of this process showed in figure 4.
The suggested model determines the coefficients of the discharge equations (Table 1) based on the test results in a way that there is maximum correspondence between the values of the calculated discharge flow and the observed values in the labyrinth spillway. The values of these coefficients and the RMSE for the suggested equation and that of Ghodsian (2009) are presented in Table 2.
Table 2. Optimized coefficients and the RMSE values for the proposed equation model and that of Ghodsian (2009) RMSE (lit/s) k12 k11 k10 k9 k8 k7 k6 k5 k4 k3 k2 k1 Recommended equation for the discharge coefficient 0.83 0.46 0.03 -0.81 -0.13 0.7 -0.05 -0.32 0.86 -0.55 0.45 -0.19 0.97 Author, based on the
study of Lux and Hinchliff (1985) 1.45 -0.65 1.17 0.77 Ghodsian (2009)*
* Ghodsian (2009) used 𝑄 = 𝐶𝑑√𝑔𝐿𝑒𝑝
3
2 to calculate the discharge flow.
As it is clear from table 2, the equation proposed by the author works better than the one offered by Ghodsian (2009). Unlike other equations, more non-dimensional parameters have been used in this equation; needless to say, all of these parameters influence the determination of the discharge coefficient of labyrinth spillways. Even though the equation proposed by Ghodsian (2009), i.e. equation 2, has an acceptable level of precision, it is less precise than the proposed equation of this study by 75%.
SUMMER 2017, Vol 3, No 1, JOURNAL OF HYDRAULIC STRUCTURES Shahid Chamran University of Ahvaz
Figure 5. The convergence of the objective function towards the optimized value for the suggested equation
7. Verification
In order to investigate the efficiency of the proposed model, the researchers had to use this model in estimating the discharge flow of a similar labyrinth spillway. The most similar conditions were found to be the labyrinth spillway of the Bertletts Ferry dam in the United States whose tests were carried out in the Department of Civil Engineering at the University of Georgia; the tests had been carried out in a glass flume for a spillway with the following characteristics: wL = 4,Dp= 1,Tp= 0.13,wp = 5.33 and a quarter-round crest. Unlike triangular spillways, the spillway promontory isn’t pointed, but rather it’s thin and square-shaped.
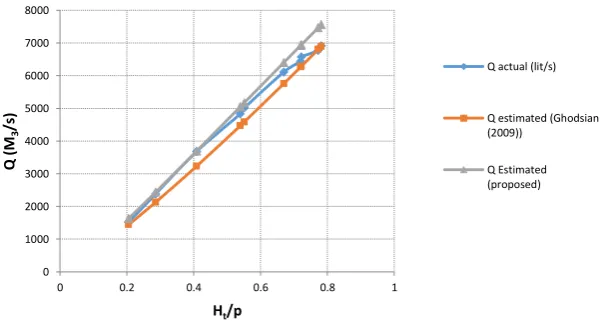
Figure 6. Comparison between the flow of Bartletts Ferry dame in the US in various 𝑯𝒕
𝒑 and the
calculated flow through the equation proposed by the author and Godsian (2009)
0 5 10 15 20 25 30 35
0 200 400 600 800 1000
co
st
Iteration
minimum
mean
0 1000 2000 3000 4000 5000 6000 7000 8000
0 0.2 0.4 0.6 0.8 1
Q (M
3
/s)
Ht/p
Q actual (lit/s)
Q estimated (Ghodsian (2009))
SUMMER 2017, Vol 3, No 1, JOURNAL OF HYDRAULIC STRUCTURES Shahid Chamran University of Ahvaz
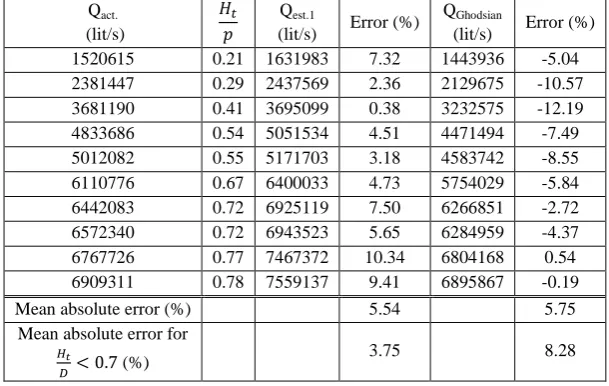
Table 3. Comparison between the flow of Bartletts Ferry dame in the US in various 𝑯𝒕
𝒑 and the
calculated flow through the equation proposed by the author and Godsian (2009)
Error (%) QGhodsian (lit/s) Error (%) Qest.1 (lit/s) 𝐻𝑡 𝑝 Qact. (lit/s) -5.04 1443936 7.32 1631983 0.21 1520615 -10.57 2129675 2.36 2437569 0.29 2381447 -12.19 3232575 0.38 3695099 0.41 3681190 -7.49 4471494 4.51 5051534 0.54 4833686 -8.55 4583742 3.18 5171703 0.55 5012082 -5.84 5754029 4.73 6400033 0.67 6110776 -2.72 6266851 7.50 6925119 0.72 6442083 -4.37 6284959 5.65 6943523 0.72 6572340 0.54 6804168 10.34 7467372 0.77 6767726 -0.19 6895867 9.41 7559137 0.78 6909311 5.75 5.54
Mean absolute error (%)
8.28 3.75
Mean absolute error for
𝐻𝑡
𝐷 < 0.7 (%)
According to the findings of the researchers, the difference between the said spillway and the triangular spillway of the present study is negligible. This dam includes 20.5 cycles, and each cycle has a 120-foot crest length on the adjacent side; also, it is 11 feet and 3 inches height, 18 inches thickness and 60 feet long (Mayer & Paul 1980). The results of the calculations for different discharge flows are presented in Figure 6 and Table 3.
SUMMER 2017, Vol 3, No 1, JOURNAL OF HYDRAULIC STRUCTURES Shahid Chamran University of Ahvaz
8. Conclusion
The present study, endeavored to propose a new equation for the discharge coefficient of triangular labyrinth spillways based on previous experiments, the researches of several scholars of the field, the Genetic Algorithm as well as the dimensional analysis. Furthermore, the author used the equation offered by Ghodsian (2009) in order to investigate the efficiency of the proposed model in comparison with the other equations. And to verify whether or not the proposed equation works properly, the discharge flow estimated by the proposed equation and that of Ghodsian (2009) were compared with the observed values of the Bartletts Ferry dam in the United States. The findings suggest that, compared to Ghodsian’s (2009) equation, the proposed model is more precise in general conditions (about 4%) and even more precise (about 121%) when the flow is not contracted yet. Other findings of this study include,
The equation for the discharge flow of labyrinth spillways could be arrived at by analyzing the information of the specific model of the study as well as dimensional analysis.
Unlike previous studies that considered the discharge coefficient as a function of one or several non-dimensional parameters, this study proved that the discharge coefficient is influenced by such different parameters as: the longitudinal magnification ratio 𝑤𝑙, the ratio of the crest height from the bed of the downstream to the crest height from the bed of the upstream in the spillway 𝐷𝑝, the ratio of the thickness of the spillway walls to the crest height from the bed of the upstream 𝑇𝑝, the ratio of the total hydraulic head in the upstream to the crest height from the bed of the upstream 𝐻𝑝𝑇, the ratio of the width of one cycle of the spillway to the crest height from the bed of the upstream 𝑤𝑝, etc.
Because discharge flow is a function of several non-dimensional parameters, we can propose various equations for the discharge coefficient and the discharge flow. Through analyzing these parameters and based on the studies of Lux and Hinchliff (1985), the equation which had more precision was proposed alongside the one offered by Ghodsian (2009). Then, the results of these equations were compared. The results indicate that the equations proposed in this study work better than the one proposed by Ghodsian (2009).
It is important to take into account a number of other parameters which are usually neglected. These parameters include: the shape of the spillway, head losses drops, the conditions of the approaching current, submergence, scouring, etc.
The optimized coefficients for the proposed discharge equations were derived from test data. Therefore, it is better to determine these coefficients based on the information about any specific spillway.
9. Reference
1. Bilhan, O., Emiroglu, M. and Miller, C. (2016). ”Experimental Investigation of Discharge Capacity of Labyrinth Weirs with and without Nappe Breakers.” World Journal of Mechanics 6(6):207-221.
SUMMER 2017, Vol 3, No 1, JOURNAL OF HYDRAULIC STRUCTURES Shahid Chamran University of Ahvaz
3. Coley D. A., (1999)."An Introduction to Genetic Algorithms for Scientists and Engineers". World Scientific Publishing, Singapore.
4. Crookston B. M. (2010). “Labyrinth weirs.” Ph.D. dissertation, Utah State Univ., Logan, UT.
5. Copeland R. And Fletcher B. (2000). “Model study of Prado Spillway, California, hydraulic model investigation.” Report ERDC/CHL TR-00-17, U.S. Army Corps of Engineers, Research and
Development Center.
6. Erpicum S., Laugier F., Boillat J. L., Pirotton M., Reverchon B.,Schleiss A. (2012)." Labyrinth and Piano Key Weirs – PKW 2011 , Proceedings of the International Conference on Labyrinth and Piano Key Weirs (PKW 2011), Liège, Belgium, 9-11 February 2011", Taylor & Francis Group, London, ISBN 978-0-415-68282-4
7. Falvey H. T. (2003)." Hydraulic Design of Labyrinth Weirs". American Society of Civil Engineers, Reston, Virginia.
8. Fox D. G. (1981)." Judging air quality model performance", Bull. Am. Meteorol. Soc., 62, 599-609.
9. Ghare A.D., Mhaisalkar V.A., Porey, P.D. (2008). “An Approach to Optimal Design of Trapezoidal Labyrinth Weirs", World Applied Sciences Journal 3 (6): 934-938.
10. Ghodsian M. (2009). “Stage-discharge relationship for a triangular labyrinth spillway.” Proc. Inst. Civ. Eng.Water Manage, 162(3), 173–178.
11. Gupta S. and Singh V. (2013). ”"Discussion of “Experimental Studies on Flow over Labyrinth Weir” by B. V. Khode, A. R. Tembhurkar, P. D. Porey, and R. N. Ingle.",” J. Irrig. Drain Eng., 139(12), 1048–1051.
12. Houston K. (1982). “Hydraulic model study of Ute Dam labyrinth spillway.” Report No. GR-82-7, U.S. Bureau of Reclamation, Denver, Colo.
13. Houston, K.L., (1983). "Hydraulic model study of Hyrum Dam auxiliary labyrinth spillway." Report No. GR 82-13, U.S. Bureau of Reclamations, Denver, Colo.
14. Khode B., Tembhurkar A., Porey P., and Ingle R. (2012). ”Experimental Studies on Flow over Labyrinth Weir.” J. Irrig. Drain Eng., 138(6), 548–552.
15. Mayer, Paul G., (1980). "Bartletts Ferry Project Labyrinth Weir Model Studies."Project No. E-20-610, Georgia Institute of Technology, Atlanta, Georgia.
16. Mehboudi A., Attari J., Hosseini, S.A. (2015).”Experimental study of discharge coefficient for trapezoidal piano key weirs.” Flow Measurement and Instrumentation.,Vol. 50 , 65-72.
17. Novak P., Guinot V., Jeffrey A., Reeve D.E. (2010). "Hydraulic Modelling - An Introduction: Principles, Methods and Applications",Spon Press, London and New York.
18. Ramakrishnan K., Banupriya R., Rajashree R. (2014). "Determination of Coefficient of Discharge for Piano Key Weirs of Varying Geometry.", Asian Journal of Applied Sciences, 7: 499-509.
19. Savage B. M., Crookston B. M, and Paxson G.S. (2016). "Physical and Numerical Modeling of Large Headwater Ratios for a 15° Labyrinth Spillway."ASCE Journal of Hydraulic Engineering, Vol. 142, Issue 11, 04016046.
20. Tacail F. G., Evans B., Babb A. (1990)."Case Study of a Labyrinth Weir Spillway", Canadian Journal of Civil Engineering, 1990, 17(1): 1-7.
SUMMER 2017, Vol 3, No 1, JOURNAL OF HYDRAULIC STRUCTURES Shahid Chamran University of Ahvaz
22. Tullis J. P., Amanian N. and Waldron D. (1995). “Design of labyrinth spillway". ASCE Journal of Hydraulic Engineering, 121, No. 3, 247–255.