A DAILY REPORT
by
Md Hasinur Rahaman Khan, PhD
Associate Professor of Applied Statistics University of Dhaka, Bangladesh
Report Number: 3-10042020
No. of hospital beds and doctors per 1000
INTRODUCTION
NEW:
Sex Ratio to infection populationCorrelation plot bet. tests and infections
What is Covid-19?
First Covid-19 Infection in Bangladesh
Current Statistics (as of April 9)
330 33 No. of tests in last 24
21 276 hours: 1097
6175 1
6.4 2
3 0.1 Male: 221
3 37 Female: 109
No. of days to double deaths:
Covid-19 (Coronavirus) in Bangladesh
According to Wikipedia [1], coronavirus disease 2019 (COVID-19) is an infectious disease caused by severe acute respiratory syndrome coronavirus (SARS-CoV-2). The disease was first identified in December 2019 in Wuhan, the capital of China's Hubei province, and has since spread globally,
resulting in the ongoing 2019–20 coronavirus pandemic. Common symptoms include fever, cough and shortness of breath. Other symptoms may include fatigue, muscle pain, diarrhea, sore throat, loss of smell and abdominal pain.
On 8 March, the first three coronavirus cases were confirmed. The IEDCR director Prof. Meerjady Sabrina Flora announced at a press conference that 2 men and 1 woman had tested positive for COVID-19. The patients were aged between 20 and 35. Of them, two men were Italy returnees and the woman was a family member of one of these two. Approximately about 111 tests were conducted in Bangladesh.
No. of days to double infections:
Total recovered: Total active cases: Current serious critical: Total cases per 1 million: Deaths per 1 million: Test per 1 million:
Gender-wise distribution of cases
This report is published by the author himself and the research results are based on the reported data including other secondary sources. The main objective of this report is to analyse the current situation of coronavirus in Bangladesh and to predict Covid-19 infections, deaths and other parameters on daily basis.
PROJECTION
Infection Projection
Figure 1: Projected
and Actual Covid-19 Total Infections in Bangladesh for April 2020
Day
8-Apr 9-Apr
Actual total Infections
190 218
210 330
Covid-19 infection cases are projected based on the assumption that Bangladesh could experience the similar doubling time in days (5 or 5.5days) as India and Pakistan experienced as of April 6, 2020. This is an adhoc non-parametric procedure. The projection has been made on April 7, 2020. Following Figure-1 shows the projection details for infections for the April month of 2020. This graph also shows the actual number of infections as reported by IEDCR for the respective day, which would be updated or embeded with the projection figure on regular basis. The folllowing Figure-3 shows the projected and actual number of infections and deaths together for the month April 2020. This is just the combined figure of Figure 1 and 2.
Absolute deviation
28
120 Projected total Infections
123 462 984 1680 1968 2624 3696 0 500 1000 1500 2000 2500 3000 3500 4000 6 -Ap r 7 -Ap r 8 -Ap r 9 -Ap r 10 -Ap r 11 -Ap r 12 -Ap r 13 -Ap r 14 -Ap r 15 -Ap r 16 -Ap r 17 -Ap r 18 -Ap r 19 -Ap r 20 -Ap r 21 -Ap r 22 -Ap r 23 -Ap r 24 -Ap r 25 -Ap r 26 -Ap r 27 -Ap r 28 -Ap r 29 -Ap r 30 -Ap r
no
o
f c
as
es
Projected and Actual Covid-19 Infections in
Bangladesh for April 2020
(projection is based on 5 days--doubling time as India and
Pakistan)
Death Projection
Figure 2: Projected
and Actual Covid-19 Total Deaths in Bangladesh for April 2020
Day
8-Apr 9-Apr
Covid-19 deaths are projected based on the assumption that Bangladesh could experience the average doubling time (5 days; average of 4 days for India and 6 days for Pakistan days) of India and Pakistan . The doubling time is considered as of April 6, 2020. The projection has been made on April 7, 2020. This is an adhoc non-parametric procedure. Following Figure--2 shows the projected number of deaths for the April month. This graph also shows the actual number of deaths as reported by IEDCR for the respective day, which would be updated or embeded with the projection figure on regular basis.. The folllowing Figure-3 shows the projected and actual number of infections and deaths together for the month April 2020. This is just the combined figure of Figure 1 and 2.
Absolute deviation
0
1 Projected total deaths Actual total deaths
20 20
22 21
17 24 34
48 68 136 192 272 384 0 50 100 150 200 250 300 350 400 450 6 -Ap r 7 -Ap r 8 -Ap r 9 -Ap r 10 -Ap r 11 -Ap r 12 -Ap r 13 -Ap r 14 -Ap r 15 -Ap r 16 -Ap r 17 -Ap r 18 -Ap r 19 -Ap r 20 -Ap r 21 -Ap r 22 -Ap r 23 -Ap r 24 -Ap r 25 -Ap r 26 -Ap r 27 -Ap r 28 -Ap r 29 -Ap r 30 -Ap r
no
o
f c
as
es
Projected and Actual Covid-19 Deaths in
Bangladesh for April 2020
(based on 5 days--doubling time as average of India (4 days) and Pakistan (6 days))
Figure 3: Projected
and Actual Covid-19 Infection and Deaths in Bangladesh for April
2020
Bangladesh may get 3700 total infected people that are reported cases only by the end of April while the total death toll could be 384. Projection of deaths seems to be more accurate than projection of infections. 328 492 840 1312 1968 3040 3696
17 24 34 48
68
136
192272 384 0 500 1000 1500 2000 2500 3000 3500 4000 6 -Ap r 7 -Ap r 8 -Ap r 9 -Ap r 10 -Ap r 11 -Ap r 12 -Ap r 13 -Ap r 14 -Ap r 15 -Ap r 16 -Ap r 17 -Ap r 18 -Ap r 19 -Ap r 20 -Ap r 21 -Ap r 22 -Ap r 23 -Ap r 24 -Ap r 25 -Ap r 26 -Ap r 27 -Ap r 28 -Ap r 29 -Ap r 30 -Ap r no o f c as es
Projected and Actual Covid-19 Infections and
Deaths in Bangladesh for April 2020
(projection on infections is based on 5 days--doubling time as average of India (4 days) and Pakistan (6 days))
(projection of deaths is based on 5 days--doubling time as avera
INFECTION TRAJECTORY
CASE FATALITY RATE
Figure 4: Infection Trajectory as of April 8, 2020 Data for Bangladesh, India, Pakistan
and SriLanka Who Cross 100 Confirmed Cases (figure source: our world in data).
Bangladesh is one of thecountries who have passed the threshold of 100 confirmed cases, with many more countries on the cusp [2]. By comparing infection trajectories from the 100 case mark, we’re able to see a clearer picture of how quickly the virus is spreading within south Asian countries, see Figure 4. Also Bangladesh is heading towards doubling time 5 days based on which the above projections are made.
0.67 0.33
Figure 6: Scatter plot bet. No. of tests and repoted no. of infections based on April data.
Very strong positive correlation is found between the number of tests conducted in last 24 hours
and the reported number of infections by analysing data of
April month. The reported correlation coefficient is
0.89
Sex ratio (males to females) in infected population is
Figure 5: Current Case Fatality Rate as of April 8 Data for Bangladesh, India, Pakistan
and SriLanka (figure source: our world in data).
0 20 40 60 80 100 120
0 200 400 600 800 1000 1200
No
o
f r
ep
or
te
d
in
fe
ct
io
ns
Tests in last 24 hours
USEFUL LINKS
2. COVID-19 Resource Centre - The Lancet. https://www.thelancet.com/coronavirus
REFERENCES
1. Wikipedia. https://en.wikipedia.org/wiki/Coronavirus. Accessed on April 7, 2020 2. Our World in Data. https://ourworldindata.org/coronavirus. Accessed on April 9, 2020 3. Worldometer. https://www.worldometers.info/coronavirus. Accessed on April 9, 2020 4. IEDCR. https://www.iedcr.gov.bd. Accessed on April 9, 2020
How to cite: Khan, M.H.R. (2020). Covid-19 (Coronavirus) in Bangladesh, Report No. 3-10042020
1. Coronavirus disease (COVID-19) advice for the public: Myth busters. WHO.
https://www.who.int/emergencies/diseases/novel-coronavirus-2019/advice-for-public/myth-busters
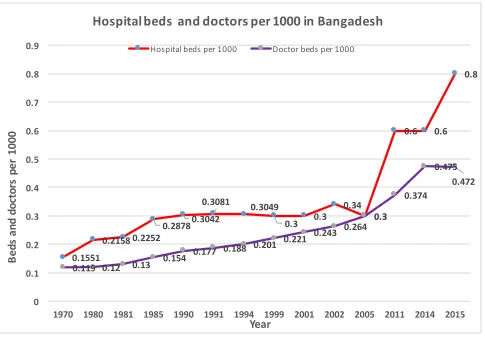
Figure 7: Number of beds and doctors per 1000 in Bangladesh (data source: our world
in data)
0.1551
0.2158 0.2252
0.28780.3042
0.3081 0.3049
0.3 0.3
0.34 0.3
0.6 0.6 0.8
0.119 0.12 0.13 0.154
0.177 0.188 0.201 0.221
0.243 0.264 0.3
0.374 0.475
0.472
0 0.1 0.2 0.3 0.4 0.5 0.6 0.7 0.8 0.9
1970 1980 1981 1985 1990 1991 1994 1999 2001 2002 2005 2011 2014 2015
Be
ds
a
nd
d
oc
to
rs
p
er
1
00
0
Year