1
Creating surface temperature datasets to meet 21st Century challenges
1 2
Met Office Hadley Centre, Exeter, UK
3 4
7th-9th September 2010
5 6
White papers background
7 8
Each white paper has been prepared in a matter of a few weeks by a small set of 9
experts who were pre-defined by the International Organising Committee to represent 10
a broad range of expert backgrounds and perspectives. We are very grateful to these 11
authors for giving their time so willingly to this task at such short notice. They are not 12
intended to constitute publication quality pieces – a process that would naturally take 13
somewhat longer to achieve. 14
15
The white papers have been written to raise the big ticket items that require further 16
consideration for the successful implementation of a holistic project that encompasses 17
all aspects from data recovery through analysis and delivery to end users. They 18
provide a framework for undertaking the breakout and plenary discussions at the 19
workshop. The IOC felt strongly that starting from a blank sheet of paper would not 20
be conducive to agreement in a relatively short meeting. 21
22
It is important to stress that the white papers are very definitely not meant to be 23
interpreted as providing a definitive plan. There are two stages of review that will 24
inform the finally agreed meeting outcome: 25
1. The white papers have been made publicly available for a comment period through 26
a moderated blog. 27
2. At the meeting the approx. 75 experts in attendance will discuss and finesse plans 28
both in breakout groups and in plenary. Stringent efforts will be made to ensure that 29
public comments are taken into account to the extent possible. 30
2
RETRIEVAL OF HISTORICAL DATA
32 33
Peter Thorne1, Scott Woodruff2, Rob Allan3, Amy Luers4, Albert Klein Tank5,
34
William Angel6, Russ Vose7, Stefan Bronnimann8
35 36
1
CICS-NC, NOAA NCDC, Asheville NC, USA 37
2
NOAA EarthSystem Research Laboratory, Boulder CO, USA 38
3
Met Office Hadley Centre, Exeter, UK 39
4
Google.org 40
5
KNMI 41
6
NOAA NCDC CDMP, Asheville NC, USA 42
7
NOAA NCDC, Asheville NC, USA 43
8
Univ. Bern, Switzerland 44
45
White paper topics given: 46
• what other known data sources exist that are not part of the current databases; 47
• other potential sources; 48
• data version reconciliation between data banks; 49
• digitised records that are not made available internationally; 50
• a practical model for the data rescue effort (e.g. whether one or more 51
workshops are required, the best mechanism to solicit data release); 52
• what other efforts are currently under way (avoidance of duplication); 53
• and the potential of crowd sourcing digitisation 54
55 56
Databank introduction – proposed content and structure
57 58
We restrict our databank discussion (this and the other three databank related white 59
papers #4-#6 to be discussed on the first day) to land station meteorological records. 60
Although the focus of the workshop is surface air temperature records we recognise 61
that it is important to the maximum extent practical to create a holistic database 62
covering other meteorological parameters, which will then be of interest to additional 63
researchers and stakeholders. The expense of handling original (e.g. paper) records 64
can provide additional motivations for seeking the most complete possible digitisation 65
(i.e. keying; accompanied ideally by imaging) of the land data and metadata. The 66
images form an integral part of any modern data archaeology recovery and 67
exploration activity (see also e.g. digitization guidance within WMO 2002).1
1 For historical ship logbook data, for example, the marine community struggles with similar
prioritization questions (Wilkinson et al. 2010):
A 68
working assumption therefore is that records for all land station parameters would be 69
recovered and archived wherever possible and not just temperatures. We may also 70
consider thermohygrograph and barograph data. In general, with a change of the 71
research focus from the mean state towards extremes and from the thermal regime to 72
“Difficult cost-benefit decisions must often be made on the scope of information to be digitised. For example, many older ships’ logbooks contain ‘remarks’ (e.g. on employment of the crew and detailed navigation information) not directly connected to the coincident meteorological or oceanographic observations, but nevertheless of potential interest to historians and other non-climatic research applications – but in many cases digitisation projects for climate research have omitted these for cost reasons (in this case, however, having the above images readily available can partly satisfy
3
the water cycle and energy balance and with better numerical techniques becoming 73
available (e.g., in the field of data assimilation), historical data need to be re-valued 74
and often re-digitised. What we are proposing, in effect, is a land ICOADS 75
76
the challenge of climate service requirements in the 21st Century. 77
78
In terms of the duration of the historical record, it is highly likely that monthly records 79
extend further back than do daily records than do synoptic (i.e. individual or 80
“instantaneous”) report records. This is because monthly records were easier to 81
maintain than the instantaneous records. In terms of quasi-global coverage monthly 82
records likely extend back to the mid to late 19th Century, daily to the mid-20th 83
Century and synoptic data to the mid- to late-20th Century. For certain locations much 84
longer records at each resolution will be possible. Whilst finer temporal resolution 85
data can be averaged up to coarser resolution data, it is worth noting that despite 86
formal guidance many countries and institutions have utilised their own methods to 87
calculate daily or monthly statistics from the individual observations. There is 88
therefore the risk of introducing non-climatic effects if uncoordinated or inconsistent 89
attempts are made to backfill daily or monthly records. The databank should 90
ultimately therefore seek to clearly track (where it is possible to determine) the source 91
of computed values (e.g. most simply if they were computed before the data were 92
provided to the international databank, or in the future the databank may include 93
capabilities to consistently backfill data, which data could then be flagged to that 94
effect). Another issue is that the ideas about the optimal way to derive e.g. daily 95
averages from three times a day observations may change over time and may be 96
different among scientists. If the sources are available we can allow for such 97
differences. 98
99
A critical adjunct to the data themselves is metadata describing amongst others 100
changes in instrumentation, siting and observing practices with time. Outside of a 101
handful of countries the availability of this metadata to researchers is currently poor to 102
non-existent. But metadata is a key step in building confidence in the presence of 103
breaks in the station series and therefore an integral component of subsequent 104
processing efforts to create homogeneous timeseries (see white paper #8 on 105
homogenisation). In general, the available metadata have not been archived originally 106
with this goal in mind. Metadata must be in a consistent and machine readable format 107
to be useful for most purposes. It may include a summary of a weather station in the 108
observation network, synoptic hours of observation, units of measured elements, 109
observation precisions, observing instruments and environment conditions of the 110
observation site, whether the station is manned or an automated weather system 111
(AWS), among other elements. For more specifications and requirements, refer to 112
WMO profile of WMO Core Metadata. Photographic and other evidence would also 113
be useful but hard to make machine readable. 114
115
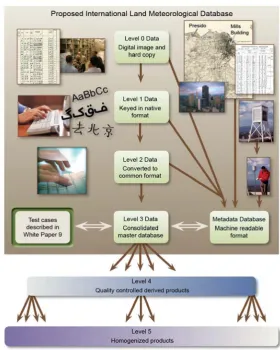
In writing this position paper we are making an implicit assumption regarding the 116
over-arching structure of the databank which we propose herein should be akin to the 117
commonly used satellite data product levels: 118
Level 0 Digital imagery of original hardcopy or initial digital count for automated 119
sensors 120
Level 1 Version of the hardcopy as originally keyed or data converted to 121
4 Level 2 Converted into a common format2 Level 3 Integrated databank
124 123
Higher level products spawned from level 3 may be: 125
Level 4 Quality Controlled 126
Level 5 Homogenised 127
But we would want multiple independently derived versions of these levels and they 128
may be distributed whereas the first four versions alluded to above would be an 129
integral part of the raw databank. The proposed databank structure, and its 130
relationship to other key components discussed in remaining white papers, is outlined 131
in further detail in Figure 1. 132
133
134
Figure 1. Proposed databank in relation to other downstream components of the international
135
initiative. Components highlighted in light green constitute the proposed databank (figure
136
courtesy of Deb Misch, NCDC Graphics team).
137 138
2
5 139
For many stations there may exist multiple versions of level 0 and level 1 and perhaps 140
even level 2 data and these may differ substantially in length and completeness as 141
well as exhibiting substantially different behaviour or resolution characteristics (e.g. 142
monthly, daily or synoptic). For example different versions of level 2 data might exist 143
due to the lack of internationally standardised translations of ancient units3
157
. The work 144
in going to a level 3 product which most end-users would be encouraged to utilise in 145
the first instance cannot therefore be under-estimated. For pre-existing records we 146
may not have or be able to retrieve one or more of the precursor steps to level 3 data. 147
In such a case hard decisions will be required as rejection of this data may badly 148
compromise record completeness or spatial representivity or both. These aspects are 149
discussed in more detail below and in accompanying first-day white papers, but as a 150
key element of the databank design probably mainly it should be the end users who 151
are empowered to make data selection decisions (e.g. through flags – but not actual 152
rejection from the databank – indicating that data values are suspicious or good 153
precursor data do not exist or have not yet been rescued). The ultimate choice made 154
by the user will depend on the application in mind and the associated data 155
requirements. 156
Databank in the bigger picture
158 159
The databank will constitute only one part of a bigger picture effort (levels 4 and 5 160
data, performance benchmarking, education, outreach and user tools and support) that 161
is outlined in remaining white papers (and aspects of what follows are discussed 162
throughout these). However, from a database engineering perspective this white 163
paper’s authors felt it is useful to consider up front in this first paper how the over-164
arching area could be managed. 165
166
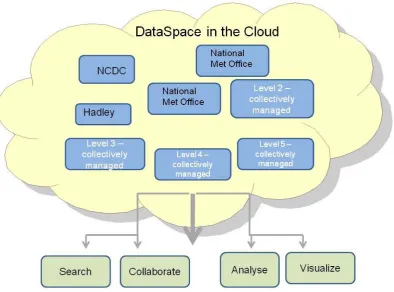
One option that was discussed amongst the authors is a system of distributed 167
management of datasets within a DataSpace including, but not limited to a central 168
databank. This would involve having the multiple derived datasets managed 169
independently in a virtual electronic “cloud” but accessed seamlessly within one 170
working space – with collective visualization, collaboration and computation tools 171
(Figure 2). From this space we would then optimally enable open access and 172
contribution to the development of derivative datasets that would move from level 0 173
to level 5 (Figure 1). Each of the datasets within in the DataSpace could be have 174
varying levels of public/private access for viewing and manipulation, and require 175
tracking of version and QC. 176
3 Also in the marine sphere carefully tested and well documented software libraries have been
6 177
Figure 2. Proposed DataSpace in a cloud concept (courtesy of google.org).
178 179
A distributed cloud-based approach might help to: 180
1. Make this effort truly international and not owned by any single institution or 181
entity – by providing each nation or institution the opportunity to manage and track 182
the use of their contributed data 183
2. Enable broader access to data while providing tracking of how data is used – 184
and potentially supporting micropayments for public uses as needed to meet needs to 185
support data sharing and cost recovery. 186
187
We should also consider how these data could be best accessed by the climate 188
services community as the global dataset is being improved. In other words, the 189
climate adaptation and planning community should be able to access the most updated 190
climate datasets available at any given time. This should be a living space. 191
192
Databank creation
193 194
There undoubtedly exist many paper records which are either available only in hard 195
copy or in digital image form. Because paper records can be subject to deterioration, 196
and to facilitate international distribution for research purposes, efforts should be 197
made, building upon and partnering with pre-existing programs such as ACRE, to 198
digitally image into robust archival-quality formats (e.g. tif, pdf) versions of hard 199
copy only (or microfilm) records. Different options to organize and implement 200
digitization efforts (level 0 to level 1) should be considered. In the ocean sphere for 201
example, currently there are some institutionally funded efforts, some charitably 202
funded efforts and initial efforts to “crowd source” (i.e. distributed outsourcing) of the 203
digitization effort over the Internet. Crowd sourcing of digitization of the land data 204
7
understanding and sense of ownership of the database. On the flip side there are 206
overheads on some organization to quality check (or possibly independently digitize 207
portions of) the data and prevent the possibility of deliberate manipulation by 208
individuals or groups for whatever reason. What is obvious is that there is far more 209
paper data than there is spoken resource to image and digitize it all. A caveat is 210
required in that unless the process of taking the images, hosting them, provenance 211
metadata (e.g. xml) generation and other aspects can be sufficiently streamlined and 212
automated this creates a prohibitive overhead. This likely significantly restricts the 213
number of possible hosting mechanisms for such efforts to a handful of technology 214
organisations rather than science research groups in practice. 215
216
There currently exist three major databases, one each at monthly, daily and synoptic 217
reporting frequencies at the World Data Center (WDC) at the NOAA National 218
Climatic Data Center (NCDC). These constitute probably the most complete 219
databases in existence and arguably would sensibly form the initial baseline from 220
which to start creating an augmented databank. There also exist numerous other 221
national and international archives including records used as ingest to reanalyses 222
products. An estimate from staff at NCDC was that at least as much data exists to be 223
added to their databases as currently exists within them (Stott and Thorne 2010), an 224
estimate also made by the ACRE project. Some of this will be data already in digital 225
form which the rights holders currently do not allow to be used or which simply has 226
not been incorporated yet. Much of it will be available in only paper form and need 227
converting to a digital record to be usable in climate studies. A (finite) listing of these 228
additional resources (“Known knowns”) follows: 229
1. There is a wealth of paper archives from around the world dating back to the 230
mid 1800s that have been internationally exchanged but have yet to be 231
digitized. See 232
scanned images of these available data. 233
2. Some early land station records still reside in paper form at the National 234
Archives and Records Administration (NARA), and possibly at other national 235
archives in the US. 236
3. NCDC hosts over 2,000 (in many cases) large boxes containing historical data 237
from many nations that have never been fully explored or exploited. CDMP is 238
in the process of creating an inventory and comparing to NCDC digital 239
holdings. 240
4. Besides NOAA, many other National Meteorological and Hydrological 241
Services (NMHSs) and probably national archives hold additional data. 242
5. Some nations have large Mesonets (of AWS) which may not yet have long 243
term records but will get there (e.g. Oklahoma Mesonet; GASIR, Mexico) 244
6. There are networks not run by National Met. Services or by non-govermental 245
organisations e.g. there is a large Brazilian network run by a non-NMHS. 246
7. Reanalyses ingest fields. 247
8. An overview of regional activities in this field is given in WMO/TD 248
No.1480 249
250 251
There are doubtless other sources unknown to the white paper authors that could and 252
should be pursued. Some form of prioritization will be required. Most logically in the 253
longer term this would be driven by balancing science or societal requirements against 254
8
such as the contiguous United States which are already very data rich. In the initial 256
phase it would be sensible to go after apparent low-hanging fruit: countries with large 257
data holdings that we think we have a reasonable chance of agreeing to share the data 258
and would lead to a step-change in data holding size, or early colonial data that may 259
substantially improve coverage in the very earliest years to build momentum behind 260
the effort before tackling more complex and challenging cases. Perhaps the best way 261
forwards to prioritise would be to start with a questionnaire to experts (workshop 262
participants, GCOS national offices, ACRE mailing list, International Surface 263
Pressure Data Bank etc.) and to WMO Permanent Representatives as to their 264
knowledge of what exists that is not yet digitised and how easy or otherwise it may be 265
to get at. 266
267
The effort required in reconciling data sources (to go from level 2 to level 3) cannot 268
be under-estimated. This may be required to extend a given station’s record or to 269
blend data held in different holdings using a different identifier nomenclature. Quite 270
often data from apparently the same station will differ between separate archives. A 271
good example of this is in efforts by Andrea Grant and colleagues to digitise very 272
early weather balloon and kite data (Grant et al. 2009). Here data were often available 273
from several sources and often differed substantially leading to substantial issues and 274
an interesting metadata challenge. Early work by the same group for surface data 275
(unpublished) suggests that similar issues pertain to early land records. In theory the 276
best solution is to retrieve, from each country, it’s most recent collection of historical 277
data as well as the metadata to go with it (local ID, WMO id, latitude, longitude, 278
station history etc.). Some work at NCDC has commenced on automating this 279
reconciliation step, but it is not certain that it will work or be applicable to 280
temperature records. 281
282
Another challenging issue is that in many cases land records were digitized e.g. 283
decades ago using what may now be considered inferior techniques, including the 284
possibility that important data and metadata elements were omitted or incompletely 285
captured (sometimes owing to early technological limitations). In some cases the only 286
record that may exist will be the digital record in its current form. Agreement as to 287
mechanisms to consistently handle such cases and reconcile (sometimes competing) 288
priorities is required.4 290
289
We know that many countries hold digital data that are not made available freely. 291
Often this is because of political and / or financial imperatives. Although such data in 292
theory should be covered by WMO Resolution 40 on data sharing they are often 293
exempted (see white paper #5 on data policy). Furthermore, not all data were 294
collected by NMHSs (including many historical data, which may not as clearly fall 295
under Res. 40) and therefore logically fall under their purview. The marine 296
4
The ocean community are facing similar problems as documented in Woodruff et al., 2010: “Work continues to actively catalogue, image, digitize, and ultimately convert digitized data into the IMMA format. However, these are all expensive tasks, and better methods are needed for prioritizing the value of specific collections, and the scope of digitization, for different climate applications, as well as for related research disciplines, including oceanography, fisheries, and ecology.
9
meteorological community has benefited since the early 1960s from having an 297
agreement (i.e. under the WMO Marine Climatological Summaries Scheme) for the 298
exchange of digitized ship logbook data (as discussed in more detail e.g. Woodruff et 299
al. 2010). Exploration of the feasibility of a similar agreement within WMO regarding 300
release and exchange of historical and contemporary land data records would seem 301
appropriate (see also white paper #5 on Data policy). 302
303
In terms of creating a truly international databank we should build upon the pre-304
existing databases (including the International Surface Pressure Databank) and 305
expertise at NCDC and elsewhere rather than starting from scratch, and additionally 306
build on the experiences of other data communities (e.g. marine as is already the case 307
in this paper, radiosondes etc.). For political and practical reasons it is worth 308
considering a greater internationalisation of the effort (including the possibility of 309
mirrored data holdings at other archive centers internationally/WDCs). As discussed 310
above, the creation of an international land surface databank that is not owned by a 311
single institution would seem desirable, and novel approaches such as the DataSpace 312
concept (Figure 2), potentially including hosting (or mirroring) through a non-313
governmental portal like google.org should be actively considered. Due attention 314
should also be given to how this databank is officially recognised (e.g. formally 315
through WMO). For example, in the marine sphere there has been some reluctance by 316
countries to contribute historical data for ICOADS, without the assurance that those 317
data and metadata (in some cases rescued at considerable expense to nations) would 318
become part of a formal and permanent international archive. Therefore the Expert 319
Team on Marine Climatology (ETMC) is developing a proposal for formal 320
recognition of ICOADS through WMO and IOC (the Intergovernmental 321
Oceanographic Commission), which would also allow for the possibility of other 322
qualifying centers internationally mirroring the data (and products) and providing 323
other complementary functions. 324
325
To engender data submission and input one or more (probably several) workshops 326
would seem appropriate. The experience of the WMO Commission for Climatology 327
(CCl/CLIVAR/JCOMM) ETCCDI5
334
regional workshops and ACRE is important here. 328
It is likely that we would be more successful in targeting efforts on data sparse 329
regions and undertaking regional workshops. This has a higher overhead in terms of 330
organization. Resources and a dedicated lead team would be needed in advance to 331
make this a success. Otherwise a single large global workshop may engender input 332
from many institutions. In reality a combination of these approaches may be required. 333
Current or recent specific activities that we should liaise with and ensure against 335
duplication with are: 336
• WMO-CCl groups that have been active on retrieval of historical data / data 337
rescue, in particular on a regional basis e.g. DAta REscue (DARE; 338
339
MEditerranean climate DAta REscue (MEDARE). 340
• The Atmospheric Circulation Reconstructions over the Earth (ACRE) 341
initiative for data rescue and facilitating reanalyses 342
5 The Expert Team on Climate Change Detection and Indices
10
• The International Environmental Data Rescue Organization (IEDRO) 343
344
• NCDC’s Climate Database Modernization Program (CDMP) 345
346
• Data rescue efforts planned with the ERA-CLIM reanalysis 347
• Regional or national data rescue efforts, e.g. in Germany (KLIDADIGI), 348
Portugal (SIGN), Italy (CLIMAGRI), Switzerland (DigiHom) etc. 349
We need to partner with rather than compete with these efforts, remaining open 350
however to the possibility of facilitating new progress through wider and potentially 351
even more integrated international efforts. What this effort should bring at least is 352
some renewed momentum, which we hope will help open up access to a greater set of 353
data, or at least achieve more seamless access globally (recognizing that some highly 354
detailed historical data holdings at the national level are unlikely to become widely 355
available in the foreseeable future). 356
357
Recommendations
358 359
1. A formal governance is required for the databank construction and 360
management effort that will also extend to cover other white paper areas on the 361
databank. This requires a mix of management and people with direct experience 362
wrestling with the thorny issues of data recovery and reconciliation along with 363
expertise in database management and configuration management. 364
2. We should look to create a version 1 of the databank from current holdings at 365
NCDC augmented by other easily accessible digital data to enable some research in 366
other aspects of the surface temperature challenge to start early. We should then seek 367
other easier targets for augmentation to build momentum before tackling more tricky 368
cases. 369
3. Significant efforts are required to source and digitise additional data. This may 370
be most easily achieved through a workshop or series of workshops. More important 371
is to bring the ongoing and planned regional activities under the same international 372
umbrella, in order to guarantee that the planned databank can benefit from these 373
activities. The issue is two-fold: first the releasing of withheld data, and secondly the 374
digitising of data in hard copy that is otherwise freely available. 375
4. The databank should be a truly international and ongoing effort not owned by 376
any single institution or entity. It should be mirrored in at least two geographically 377
distinct locations for robustness. 378
5. The databank should consist of four fundamental levels of data: level 0 (digital 379
image of hard copy); level 1 (keyed data in original format); level 2 (keyed data in 380
common format) and level 3 (integrated databank/DataSpace) with traceability 381
between steps. For some data not all levels will be applicable (digital instruments) or 382
possible (digital records for which the hard copy has been lost/destroyed), in which 383
case the databank needs to provide suitable ancillary provenance information to users. 384
6. Reconciling data from multiple sources is non-trivial requiring substantial 385
expertise. Substantial resource needs to be made available to support this if the 386
databank is to be effective. 387
7. There is more data to be digitised than there is dedicated resource to digitise. 388
Crowd-sourcing of digitisation should be pursued as a means to maximise data 389
recovery efficiency. This would very likely be most efficiently achieved through a 390
technological rather than academic or institutional host. It should be double keyed and 391
11
8. A parallel effort as an integral part of establishing the databank is required to 393
create an adjunct metadata databank that as comprehensively as feasible describes 394
known changes in instrumentation, observing practices and siting at each site over 395
time. This may include photographic evidence, digital images and archive materials 396
but the essential elements should be in machine-readable form. 397
9. Development may be needed of formalized by new WMO arrangements, 398
similar to those used in the marine community, to facilitate more efficient exchanges 399
of historical and contemporary land station data and metadata (including possibilities 400
for further standardization). 401
10. In all aspects these efforts must build upon existing programs and activities to 402
maximise efficiency and capture of current knowledge base. This effort should be an 403
enabling and coordination mechanism and not a replacement for valuable work 404
already underway. 405
406
References
407
Grant, A, S. Brönnimann, T. Ewen and A. Nagurny, 2009: A new look at radiosonde data prior to 408
1958. J. Climate, 22, 3232-3247. 409
410
Stott, P. A., and Thorne, P. W., 2010: How best to log local temperatures? Nature, 465, 158-159 411
412
Wilkinson, C., S.D. Woodruff, P. Brohan, S. Claesson, E. Freeman, F. Koek, S.J. Lubker, C. Marzin, 413
and D. Wheeler, 2010: RECovery of Logbooks And International Marine Data: The RECLAIM 414
Project. Int. J. Climatol. (in press), DOI: 10.1002/joc.2102 [pdf available from: 415
416
417
WMO, 2002: 1. Report of the CLICOM-DARE (San José, Costa Rica, 17-28 July 2000), 2. Report of 418
the International Data Rescue Meeting (Geneva, 11-13 September 2001). WCDMP-No. 49 419
(WMO-TD No. 1128) 420
421
422
423
Woodruff, S.D., N. Scott, D.I. Berry, M.A. Bourassa, E. Charpentier, S. Gulev, H. Haar, E.C. Kent, 424
R.W. Reynolds, G. Rosenhagen, M. Rutherford, V. Swail, S.J. Worley, H.-M. Zhang, R. Zöllner, 425
2010: Surface In situ Datasets for Marine Climatological Applications. In Proceedings of
426
OceanObs'09: Sustained Ocean Observations and Information for Society (Vol. 2), Venice, Italy, 427
21-25 September 2009, Hall, J., Harrison D.E. & Stammer, D., Eds., ESA Publication WPP-306 428