R E S E A R C H
Open Access
Analysis of repeated leukocyte DNA
methylation assessments reveals persistent
epigenetic alterations after an incident
myocardial infarction
Cavin K. Ward-Caviness
1*†, Golareh Agha
2†, Brian H. Chen
3†, Liliane Pfeiffer
4, Rory Wilson
4, Petra Wolf
5,
Christian Gieger
4, Joel Schwartz
6, Pantel S. Vokonas
7,8, Lifang Hou
9,10, Allan C. Just
11, Stefania Bandinelli
12,
Dena G. Hernandez
13, Andrew B. Singleton
13, Holger Prokisch
5,14, Thomas Meitinger
5,14,15, Gabi Kastenmüller
16,
Luigi Ferrucci
3, Andrea A. Baccarelli
2, Melanie Waldenberger
4and Annette Peters
1Abstract
Background:Most research into myocardial infarctions (MIs) have focused on preventative efforts. For survivors, the occurrence of an MI represents a major clinical event that can have long-lasting consequences. There has been little to no research into the molecular changes that can occur as a result of an incident MI. Here, we use three cohorts to identify epigenetic changes that are indicative of an incident MI and their association with gene expression and metabolomics.
Results:Using paired samples from the KORA cohort, we screened for DNA methylation loci (CpGs) whose
change in methylation is potentially indicative of the occurrence of an incident MI between the baseline and follow-up exams. We used paired samples from the NAS cohort to identify 11 CpGs which were predictive in an independent cohort. After removing two CpGs associated with medication usage, we were left with an“epigenetic fingerprint”of MI composed of nine CpGs. We tested this fingerprint in the InCHIANTI cohort where it moderately discriminated incident MI occurrence (AUC = 0.61,P= 6.5 × 10⁻³). Returning to KORA, we associated the epigenetic fingerprint loci with cis-gene expression and integrated it into a gene expression-metabolomic network, which revealed links between the epigenetic fingerprint CpGs and branched chain amino acid (BCAA) metabolism.
Conclusions:There are significant changes in DNA methylation after an incident MI. Nine of these CpGs show consistent changes in multiple cohorts, significantly discriminate MI in independent cohorts, and were independent of medication usage. Integration with gene expression and metabolomics data indicates a link between MI-associated epigenetic changes and BCAA metabolism.
Keywords:Myocardial infarction, DNA methylation, Epigenetics, Fingerprint, Epigenetic fingerprint, Metabolites, Branched chain amino acid metabolism, Systems biology
* Correspondence:[email protected]
†Cavin K. Ward-Caviness, Golareh Agha and Brian H. Chen contributed
equally to this work.
1Institute of Epidemiology II, Helmholtz Zentrum München, Ingolstädter
Landstraβe 1, 85764 Neuherberg, Germany
Full list of author information is available at the end of the article
Background
A myocardial infarction (MI) is characterized by the rup-ture of a vulnerable plaque into the interior of a coron-ary vessel resulting in a clotting cascade that obstructs blood flow [1,2]. Even in the modern era, approximately 5% of MI survivors will experience a recurrent MI within 5 years [3]. For MI survivors, the physiological ef-fects of a MI are widespread and persistent and include anatomical alterations such as ventricular remodeling [4–6]. Additionally, rates of impaired glucose tolerance and diabetes may be high among MI survivors [7, 8], even those without diabetes prior to the MI [7]. Post-MI diabetes is associated with elevated rates of MI recur-rence, stroke, and death [8]. Thus, understanding MI-induced molecular alterations and their potential impact on metabolism and vascular physiology may help reduce post-MI co-morbidities and lower event rates. Epigenetics, particularly DNA methylation, is a promis-ing source of molecular data for understandpromis-ing MI-in-duced molecular changes.
DNA methylation is the most commonly studied epi-genetic mark and is typically an assessment of the frequency with which a methyl group is added to the cytosine in a cytosine-phosphate-guanine (CpG) di-nucleotide. This methyl addition at a CpG locus is a stable, yet modifiable, alteration to DNA with direct implications for gene expression and regulation [9]. Al-though methylation can occur at other dinucleotides, this is mostly restricted to pluripotent cells [10]. DNA methylation at CpG dinucleotides has been associated with MI [11–13], and methylation differences have been observed in healthy versus atherosclerotic tissue from the same individual [14]. Yet, little research has charac-terized the methylation differences that can occur after an incident MI, and their downstream implications. Here, we used paired samples from the Cooperative Health Research in the Region of Augsburg (KORA) co-hort to first identify epigenetic loci that showed methyla-tion changes when comparing pre- and post-MI epigenetic profiles. From these loci, we used KORA and an independent cohort to develop and an “epigenetic fingerprint” of MI, which comprised those loci whose change in methylation is indicative of an incident MI. This epigenetic fingerprint was then evaluated in a third cohort of individuals not used for its development. Fi-nally, we used gene expression and metabolomics data collected in KORA to understand the impact of the epigenetic fingerprint loci on cis-gene expression and peripheral blood metabolites.
Results
Table 1 contains the clinical covariates for all partici-pating cohorts. To develop the epigenetic fingerprint, we only used loci with methylation data available at
both samples for all individuals after all quality control procedures. This high stringency substantially reduced the number of CpGs from the Illumina Infinium Hu-man Methylation 450 K BeadChip array to 24,057 CpGs available for analysis. Of these, 435 CpGs had an FDRP< 0.15 in the initial discovery analysis which was designed to be an inclusive analysis to avoid screening out potentially predictive CpGs (N= 435, Add-itional file 1: Table S1). We retained 174 of these 435 CpGs which has non-zero betas in the elastic net model run on KORA data (Additional file1: Table S2). To further refine the predictive model, we used a sec-ond elastic net model in Normative Aging Study (NAS), and of the 174 CpGs from KORA, retained those 11 CpGs with non-zero betas in the NAS (Add-itional file 1: Table S3). The difference in methylation between baseline and follow-up for these 11 CpGs sig-nificantly discriminated (P< 0.05) occurrence of MI in
KORA, NAS, and Invecchiare nel Chianti
(InCHIANTI), an independent cohort not used to se-lect the CpGs (Additional file1: Table S4).
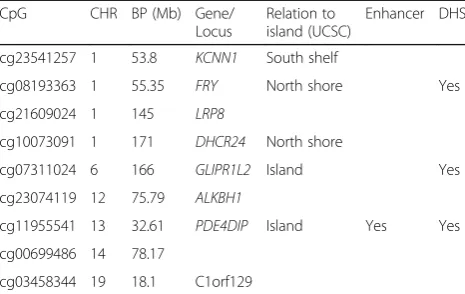
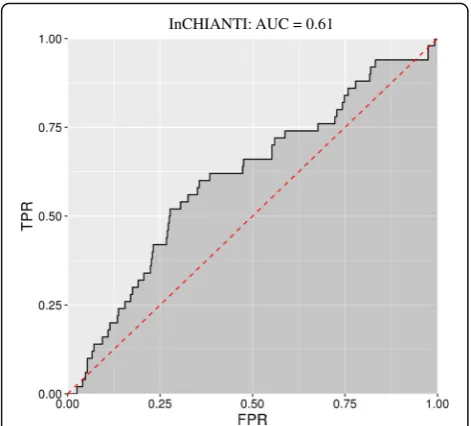
Usage of medication is commonly prescribed after an MI closely correlated with the occurrence of an incident MI (Additional file 1: Table S5). Using KORA F4, we tested for associations between these 11 CpGs and the usage of seven classes of medications commonly pre-scribed after a MI. After a correction for the 77 tests performed, two CpGs were associated with medication usage in KORA F4: one with the stoppage of diuretics (cg19569340) and one with the stoppage of anti-platelet medications (cg02628823, Additional file 1: Table S6). Thus, our final epigenetic fingerprint was composed of nine CpGs (Table 2). These nine CpGs significantly discriminated incident MI occurrence in both KORA and NAS, and this discrimination was independently evaluated in InCHIANTI (Fig.1, Table3).
Association with gene expression
We associated each of the epigenetic fingerprint CpGs with gene expression in KORA F4 using 713 samples. Given the power to detect associations, we only exam-ined cis-gene expression (1 Mb window) and examexam-ined both nominal (P< 0.05) associations and those signifi-cant after a Bonferroni correction for the number of genes within each 1 Mb window (14–87 genes, Additional file1: Table S7). In an age, sex, and technical factor-adjusted model, five epigenetic loci were at least nominally associated with cis-gene expression, with cg100703091 significantly associated with gene expres-sion probes for 24-dehydrocholesterol reductase
(DHCR24) and transcription elongation factor A
Table 1Clinical covariates for KORA, NAS, and InCHIANTI
a. Clinical covariates at baseline and follow-up exams
KORA NAS InCHIANTI
Baseline Follow-up Baseline Follow-up Baseline Follow-up
N 1103 1103 344 344 443 443
NMI – 13 – 14 – 50
Time to MI—years; mean (SD) – 4.08 (2.2) – 2.76 (1.3) – 6.47 (2.9)
FU time—years; mean (SD) – 7.10 (0.22) – 8.52 (3.2) – 9.12 (0.21)
Age—years; mean (SD) 54.5 (8.87) 61.5 (8.9) 70.9 (6.6) 74.5 (6.6) 61.7 (16.2) 70.8 (16.2)
Males—N(%) 558 (50.6%) 558 (50.6%) 100% 100% 206 (46.5%) 206 (46.5%)
BMI—kg/m2; mean (SD) 27.7 (4.5) 28.1 (4.8) 28.1 (4.1) 27.7 (4.1) 27.0 (3.9) 27.0 (4.3)
Current smokers—N(%) 212 (19.2%) 161 (14.6%) 17 (4.94%) 16 (4.65%) 89 (20.1%) 45 (10.2%)
Former smokers—N(%) 417 (37.8%) 469 (42.5%) 220 (64.0%) 222 (64.5%) 105 (23.7%) 151 (34.1%)
LDL-C—mg/dL; mean (SD) 144 (40.1) 140 (35.8) – – 135 (35.9) 124 (31.8)
HDL-C—mg/dL; mean (SD) 57.5 (16.9) 56.2 (14.8) 51.3 (14.1) 50.6 (13.5) 56.1 (14.2) 56.5 (15.2)
Hypertension—N(%) 484 (44.2%) 522 (47.4%) 209 (60.8%) 232 (67.4%) 221 (49.9%) 247 (55.8%)
Type 2 diabetes—N(%) 39 (3.54%) 105 (9.53%) 36 (10.5%) 48 (14.0%) 38 (8.6%) 49 (11.1%)
b. Clinical covariates at baseline for individuals who did not develop an MI (controls) vs those who did (cases)
KORA NAS InCHIANTI
Controls Cases Controls Cases Controls Cases
N 1090 13 330 14 393 50
Age—years; mean (SD) 54.4 (8.9) 58.9 (7.2) 70.9 (6.5) 69.3 (8.4) 60.9 (16.7) 67.8 (9.4)
Males—N(%) 548 (50.3%) 10 (76.9%) 100% 100% 181 (46.1%) 25 (50.0%)
BMI—kg/m2; mean (SD) 27.7 (4.4) 31 (7.1) 28.0 (4.1) 29.0 (4.0) 26.9 (3.9) 27.3 (3.46)
Current smokers—N(%) 208 (19.1%) 4 (30.8%) 16 (4.84%) 1 (7.14%) 80 (20.4%) 9 (18.0%)
Former smokers—N(%) 412 (37.8%) 5 (38.5%) 210 (63.6%) 10 (71.4%) 88 (22.4%) 17 (34.0%)
LDL—mg/dL; mean (SD) 144 (40.2) 144 (36.7) – – 134 (35.9) 144 (34.6)
HDL—mg/dL; mean (SD) 57.7 (16.8) 42 (11.7) 51.7 (14.1) 41.7 (8.5) 56.0 (14.3) 57.6 (13.2)
Hypertension—N(%) 476 (44%) 8 (61.5%) 201 (60.9%) 8 (57.1%) 187 (47.6%) 34 (68.0%)
Type 2 diabetes—N(%) 37 (3.4%) 2 (15.4%) 32 (9.70%) 4 (28.6%) 31 (7.9%) 7 (14.0%)
c. Clinical covariates at follow-up for individuals who did not develop an MI (controls) vs those who did (cases)
KORA NAS InCHIANTI
Controls Cases Controls Cases Controls Cases
N 1090 13 330 14 393 50
Time to MI—years; mean (SD) – 4.08 (2.2) – 2.76 (1.3) – 6.47 (2.9)
FU time—years; mean (SD) 7.1 (0.22) 7.2 (0.38) 8.8 (2.97) 2.8 (1.3) 9.1 (0.21) 9.1 (0.21)
Age—years; mean (SD) 61.4 (8.9) 65.9 (7.2) 74.5 (6.5) 73.3 (8.2) 70.0 (16.7) 76.9 (9.5)
Males—N(%) 548 (50.3%) 10 (76.9%) 100% 100% 181 (46.1%) 25 (50.0%)
BMI—kg/m2; mean (SD) 28.1 (4.71) 32.6 (7.24) 27.7 (4.1) 28.3 (4.2) 27.0 (4.35) 27.0 (3.72)
Current smokers—N(%) 159 (14.6%) 2 (15.4%) 15 (4.6%) 1 (7.1%) 42 (10.7%) 3 (6.0%)
Former smokers—N(%) 462 (42.4%) 7 (53.8%) 212 (64.2%) 10 (71.4%) 128 (32.6%) 23 (46.0%)
LDL-C—mg/dL; mean (SD) 140 (35.8) 111 (16.8) – – 123 (31.9) 127 (31.4)
HDL-C—mg/dL; mean (SD) 56.4 (14.8) 41.5 (10.2) 51.1 (13.6) 40.3 (6.0) 56.4 (15.3) 57.3 (14.6)
Hypertension—N(%) 513 (47.2%) 9 (69.2%) 219 (66.3%) 13 (92.9%) 216 (55.0%) 31 (62.0%)
Type 2 diabetes—N(%) 98 (9.0%) 7 (53.8%) 43 (13.0%) 5 (35.7%) 44 (11.2) 5 (10.0%)
potential replication of the associations (https://genenet-work.nl/biosqtlbrowser/) [15, 16]. BIOS only reported genome-wide significant, independent associations and did not have overlap with our results.
Multi-omic pathway visualization
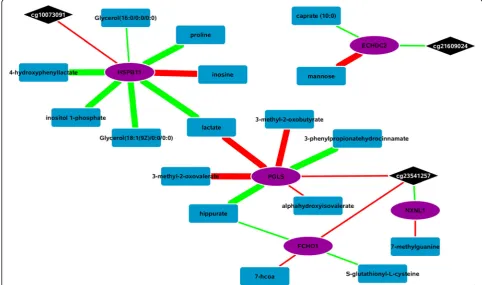
In order to visualize the metabolic pathways associated with our epigenetic fingerprint, we integrated the CpG-gene expression associations (P< 0.05) with a pub-lished Spearman correlation-based gene expression-metabolomics network [17]. Accounting for multiple probes per gene, 3000 associations were examined. There were 12 FDR significant associations, two of which were Bonferroni significant after a multiple-test-ing correction (Fig.2,Additional file1: Table S8). Three epigenetic fingerprint CpGs accounted for all genes with suggestive metabolite associations. Heat shock protein family B (small) member 11 (HSPB11) was the most rep-resented gene in the network, with seven suggestive me-tabolite associations, six of which were FDR significant.
The majority of the network centered on two
“hubs” linked by the metabolite lactate. One hub has
HSBP11 at the center, and the other hub has
6-phosphogluconolactonase (PGLS) at its center. The
PLGS hub has an additional branch that incorporates FCH domain only 1 (FCHO1) and nucleoredoxin like 1
(NXNL1) while all members of the HSPB11hub directly
connect to that gene. Besides the“twin-hub” main body of the network, there is one disconnected section repre-senting the cg21609024–enoyl-CoA hydratase domain containing 2 (ECHDC2) association. ECHDC2 had an FDR significant association with mannose and a suggest-ive association with caparic acid (caparate (10:0)).
Discussion
Epigenetic changes to DNA have a profound impact on cellular regulation and health. Environmental exposures, such as smoking [18–21] and air pollution [22, 23], may cause changes to the epigenome, and aberrant DNA methylation changes may be a risk factor for outcomes such as obesity [24], diabetes [25,26], and cardiovascular disease (CVD) [11, 27, 28]. What is less understood is how changes in health status can produce long-term alterations in the epigenetic profile and the subsequent implications for the downstream regulation of gene ex-pression and biochemical pathways. Here, we have shown that the occurrence of an incident MI is associ-ated with a broad array of epigenetic changes and that a subset of the loci, whose change in methylation is associ-ated with incident MI, compose an “epigenetic finger-print” of MI that generalizes across populations from various geographic regions and ethnicities. The complete map of epigenetic changes as a result of an incident MI is likely to be highly personalized and heterogeneous and will depend on factors such as the timing of the MI (early vs late life), the epigenetic profile of the individual at the time of MI, the risk factors that contributed to the MI, and even the triggering mechanism of the MI. How-ever, we believe the epigenetic loci highlighted by our analyses represent a picture of some of the epigenetic changes that may result from an MI occurrence.
Epigenetic loci which compose the epigenetic fingerprint
There were nine epigenetic loci which composed the epigenetic fingerprint and provided substantial discrim-ination in the occurrence of a first MI (Table 2). These nine loci were not associated with MI risk in either of two recent epigenome-wide association studies for MI [11, 13]. The nine CpGs were annotated to eight genes based on their location. Of these eight genes, two are known to be associated with cardiovascular disease: low-density lipoprotein receptor-related protein 8 (LRP8) and potassium calcium-activated channel sub-family N member 1 (KCNN1). Low-density lipoprotein concentration is a known risk factor for MI with growing evidence for a causal association with vascular disease [29–31].LRP8has been implicated as a diagnostic marker for familial and early-onset CVD [32].KCNN1is a calcium-activated potassium channel expressed in heart and other tissues. Blocking the homolog of this channel in rats can reduce ventricular fibrillation and ventricular tachycardia during induced acute myocardial infarction [33].KCNN1is also involved in the electrical remodeling of the heart during chronic atrial fibrillation [34].
DHCR24and alkB homolog 1, histone H2A dioxygenase
(ALKBH1) were also annotated to epigenetic fingerprint CpGs. DHCR24 encodes a reductase that catalyzes the final step in cholesterol biosynthesis, the conversion of Table 2The 9 CpGs that composes the epigenetic fingerprint
of MI
CpG CHR BP (Mb) Gene/
Locus
Relation to island (UCSC)
Enhancer DHS
cg23541257 1 53.8 KCNN1 South shelf
cg08193363 1 55.35 FRY North shore Yes
cg21609024 1 145 LRP8
cg10073091 1 171 DHCR24 North shore
cg07311024 6 166 GLIPR1L2 Island Yes
cg23074119 12 75.79 ALKBH1
cg11955541 13 32.61 PDE4DIP Island Yes Yes
cg00699486 14 78.17
cg03458344 19 18.1 C1orf129
Annotations to genes are based on physical proximity. Annotations are based on location and provided in the manifest file for the 450 K methylation array by Illumina
desmosterol to cholesterol [35], and the mutations in
DHCR24 cause accumulation of desmosterol [36].
Methylation at DHCR24 is associated with body mass index [24, 37]. Desmosterol accumulation underlies many of the downstream responses to foam cell forma-tion [38], which are causally implicated in MI. DHCR24
also has roles in response to both acute and chronic oxidative stress [39], and methylation inDHCR24is regu-lated by low-density lipoprotein cholesterol and associ-ated with DHCR24 gene expression [40]. Mendelian randomization analyses indicate that methylation in
DHCR24 may be causally regulated by low-density
lipoprotein cholesterol levels in blood [40]. Thus, it is possible that post-MI methylation changes in DHCR24
are driven by changes in blood lipids. ALKBH1 encodes for a response protein to DNA alkylation damage and specifically modifies the methylation and, therefore, regulation of histone H2A [41].
Of the remaining three epigenetic fingerprint CpGs, one was annotated to GLI pathogenesis related 1 like 2
(GLIPR1L2), which is associated with immune system
cells and macrophage differentiation [42], and is regu-lated by DNA methylation [43]. One was annotated to phosphodiesterase 4D interacting protein (PDE4DIP), which is associated with large vessel stroke [44], and the final CpG was annotated to FRY microtubule binding protein (FRY), which is associated with microtubule regulation/spindle formation [45].
Association of fingerprint loci with gene expression
To understand the transcriptional regulatory potential of our epigenetic fingerprint loci, we associated each CpG loci with the expression of genes within 1 Mb (Table 4). The CpG site cg00699486 did not have a location-based annotation in the Illumina annotation files, but was nominally associated with the expression of phosphodiesterase 10A (PDE10A), a gene linked to vascular remodeling [46]. Only cg10073091 (DHCR24) and cg23074119 (ALKBH1) were associated with the expression of the genes to which they were annotated based on proximity. Cg10073091 was the only locus to be associated with gene expression (DHCR24 and
TCEANC2) after a multiple-test correction and was
also nominally associated withTCEANC2and HSPB11
expression. Cg1007391 is located in the first exon of
DHCR24 and overlaps with transcription factors linked
to the vasculature, inflammation, and hypoxia such as STAT3 and ELF-1 [47–49], which may account for its multiple associations.
Integration with metabolomics data
To understand the biochemical impact of epigenetic changes associated with incident MI, we linked our epigenetic fingerprint-gene expression associations with a published network of transcriptome-metabo-lome associations [17]. Three epigenetic fingerprint loci were linked to metabolites via transcriptomic regulation. When considering all suggestive (P< 0.001) transcriptome-metabolome associations, these three CpGs linked to two distinct sub-networks. The larger sub-network was composed of two hubs centered on
HSPB11andPGLSwith lactate linking the two (Fig.2).
The network hub centered on PGLS contained mul-tiple metabolites linked to branched chain amino acid (BCAA) metabolism. BCAAs are associated with obes-ity [50], insulin resistance [51, 52], diabetes [53], cardiovascular disease [54, 55], and mortality [56].
PGLS was also significantly associated with hippurate, a metabolite produced by microbial metabolism in the gut. Hippurate is often used as a marker for renal func-tion and has been associated with diabetes, blood pres-sure, and atherosclerosis, though these associations are InCHIANTI: AUC = 0.61
Fig. 1Receiver operating characteristic (ROC) curves for the epigenetic fingerprint. The ROC curve for InCHIANTI for the epigenetic fingerprint. The fingerprint was developed in KORA and NAS and independently evaluated (replicated) in InCHIANTI where is significantly discriminated MI occurrence (P= 6.5x10⁻³).AUCarea under the curve;FPRfalse positive rate;TPRtrue positive rate
Table 3Model statistics for the epigenetic fingerprint for KORA, NAS, and InCHIANTI
N NMI AUC P(AUC)
KORA 1103 13 1.00 2.7 × 10⁻¹⁰
NAS 344 14 0.94 1.3 × 10−08
InCHIANTI 443 50 0.61 6.5 × 10−03
The epigenetic fingerprint was developed in KORA and NAS and
possibly secondary to renal dysfunction [57,58]. PGLS
encodes for 6-phosphogluconase, which is differentially expressed in the pancreas of diabetic mice as com-pared to wildtype mice [59].
HSBP11 sits at the center of the other network hub
and had the most FDR significant associations (6). Pro-line is associated with immune function in the gut [60] and is metabolized by the gut microbiome to produce
ornithine and arginine [60]. Ornithine and arginine are associated with atherosclerosis [61, 62] and CVD [63, 64]. Mutual association with lactate linked thePGLSand
HSPB11 hubs, and HSPB11 was also linked to a BCAA
metabolite (4-hydroxyphenyllactate). In a study compar-ing obese and lean humans, proline, lactate, and BCAAs were all elevated in the obese individuals [50], and, like the BCAAs, lactate is linked to insulin resistance Table 4Integration of epigenetic fingerprint loci with gene expression
Chrom GEX Probe CpG BP Annotated gene Beta SE P Probe gene
1 ILMN_1725510 cg10073091* 55.35 DHCR24 −1.76 0.51 0.0006 DHCR24
1 ILMN_1673544 cg10073091* 55.35 DHCR24 2.37 0.73 0.0012 TCEANC2
1 ILMN_1681340 cg10073091 55.35 DHCR24 −4.29 1.54 0.0055 HSPB11
19 ILMN_1654571 cg23541257 18.10 KCNN1 −1.52 0.63 0.02 FCHO1
19 ILMN_1742917 cg23541257 18.10 KCNN1 1.00 0.45 0.03 NXNL1
14 ILMN_1758038 cg23074119 78.17 ALKBH1 −25.80 11.89 0.03 ALKBH1
1 ILMN_1671568 cg21609024 53.80 LRP8 2.02 0.94 0.03 ECHDC2
19 ILMN_1797005 cg23541257 18.10 KCNN1 −1.36 0.64 0.03 PGLS
6 ILMN_2121272 cg00699486 166.14 −0.42 0.21 0.04 PDE10A
Betaeffect estimate for gene expression—methylation association,BPchromosomal location of the CpG,PunadjustedPvalue,SEstandard error
Of the nine epigenetic fingerprint loci, five were at least nominally associated (P< 0.05) with cis-gene expression (1 Mb window). Two, marked with an asterisk (*), were associated after adjusting for the number cis-genes, i.e., genes within 1 Mb. Annotated gene refers to the proximity-based annotation of the methylation probe (CpG) to a gene by Illumina. Probe gene refers to the gene associated with the gene expression (GEX) probe
[50–53, 65]. High rates of diabetes and glucose intoler-ance have been reported amongst MI survivors [7, 8], a trend that has been increasing over time [66]. Even indi-viduals without diagnosed diabetes prior to MI have high rates of impaired glucose tolerance and diabetes after an MI [7]. Thus, the component of the epigenetic fingerprint encompassing cg23541257 and cg10073091, and their downstream transcriptomic and metabolomic associa-tions, may reflect post-MI epigenetic regulation related to obesity, insulin resistance, and diabetes.
Of the remaining metabolites, only mannose had a previously reported association with CVD or MI.
ECHDC2 was significantly associated with mannose, a
water-soluble fiber that may have protective effects for MI [67]. ECHDC2 encodes for a mitochondrial protein involved in mediating susceptibility to myocardial ische-mia/reperfusion injury in rats and was shown to increase BCAA metabolism in rats [68].
Limitations
The primary limitation of this study is the low numbers of incident MI events. With fewer than 20 incident MI events in each KORA and NAS, the epigenetic finger-print was developed based on limited event observations. In post hoc power calculations for the initial, screening, EWAS highlight this with many observed effects below the traditional 80% power cutoff (Additional file 1: Figure S1). However, our multi-staged design still allowed for the removal of CpGs that do not contribute to prediction, and the epigenetic fingerprint provided significant discrimination in an independent cohort, with a larger number of events than either KORA or the NAS. A related limitation is the varying follow-up times for the studies and event rate for the cohorts. This could introduce variability which might obscure some CpGs that may have improved our MI discrimination models. However, the varying follow-up times helps insure that the CpGs in the final model are those whose post-MI alterations in methylation are stable over varying follow-up time windows. Showing replicability across cohorts with varying incidence rates, which may occur due to sampling decisions or underlying clinical conditions, helps to demonstrate the robustness of the results. Another limitation of this study is that the vast majority of the CpGs from the 450 K array were missing in > 1 individuals in KORA and thus not used. Though this restriction insured only the highest quality CpGs were used, insured all CpGs could participate in the elastic net model, and improved power in the EWAS, it does mean that CpGs that possibly significantly discrim-inate MI were excluded. Future studies may consider imputation or sequencing methods to improve CpG availability. Another limitation is that we cannot dis-count the possibility that some of the MI fingerprint
discrimination is driven by the effect of lifestyle changes. Though the EWAS did adjust for changes in BMI, physical activity, smoking, and alcohol consumption, it is still possible that unmeasured confounding from lifestyle changes such as diet or occupation remains. Another limitation of this analysis is the generalizability. Both KORA and InCHIANTI contained only European ancestry individuals, and while NAS contained some non-European ancestry individuals, the proportion was extremely small. It would be beneficial for future studies to test these epigenetic loci to see if they change in methylation discriminates between individuals with and without an incident MI in ethnically diverse cohorts. The DNA methylation-gene expression associations observed in KORA were not observed in results published in the BIOS consortium QTL browser (https://genenetwork.nl/biosqtlbrowser/) [15, 16]. The browser only reported the independent results with FDR correctedP< 0.05; thus, our results may simply not have achieved this stringent statistical cutoff. Additionally, epigenetic differences between BIOS and KORA, due to lifestyle or exposure history, may account for the lack of overlap between the results. Leukocyte DNA methyla-tion may not reflect methylamethyla-tion with cardiac tissue; however, it may be a proxy for methylation there or reflect systemic changes indicative of a recent MI. Additionally, because the elastic net model prunes sets of highly correlated predictors at random, the selected loci may only be proxies for those whose change is truly due to the occurrence of an incident MI. Finally, with only one time point after the occurrence of the incident MI, we are unable to determine the rate of change of the epigenetic fingerprint loci after an MI. Whether these epigenetic changes occur immediately and then remain stable or occur slowly and continue to diverge after an incident MI is a topic for future investigations in cohorts with three or more methylation assessments.
Conclusion
Incident MI is significantly associated with changes in methylation at multiple CpGs, nine of which compose an epigenetic fingerprint representing stable, medication-inde-pendent, MI-associated alterations in the epigenetic profile. The loci that composed the epigenetic fingerprint were as-sociated with the expression of genes related to cholesterol metabolism (DCHR24) and vascular remodeling (PDE10A). By integrating the epigenetic-transcriptomic associations with metabolomics data, we were able to visualize an inte-grated ‘omics network revealing the potential biochemical effects of these epigenetic loci. Three of the nine loci were incorporated into this integrated ‘omics network, each of which linked to a gene or metabolite implicated in BCAA metabolism. The most connected genes, PLGS and
metabolites. Taken together, this multi-omic network suggests that epigenetic changes after an incident MI may be linked to BCAA metabolism and possibly inform on the development impaired glucose tolerance and diabetes secondary to MI.
Methods Study cohorts
To develop the epigenetic fingerprint, we used paired samples from the KORA S4 and KORA F4 cohorts. KORA S4 is the baseline examination of individuals liv-ing in the Augsburg region, Germany, with examinations conducted from 1999 to 2001 [69]. KORA F4 is a follow-up survey of KORA S4 and was conducted from 2006 to 2008 [70]. After removing individuals with previous MI at the KORA S4 enrollment, there were 1103 individuals with paired methylation data from KORA S4 (i.e., “baseline”) and KORA F4 (i.e., “follow-up”). Methylation at both time points was assessed via the Illumina Infinium HumanMethylation450k platform. MI events were assessed for all KORA participants via their enrollment in the Augsburg MI registry [71]. There were 13 incident MI occurrences between baseline and follow-up.
We refined the epigenetic fingerprint in the Norma-tive Aging Study (NAS) [72] and replication was per-formed in the Invecchiare nel Chianti (InCHIANTI) cohort [73]. NAS is an ongoing longitudinal study established in 1963. Men free of any known chronic disease or medical conditions and aged 21–80 were recruited at baseline and followed-up with medical examinations every 3–5 years. Examinations included medical and lifestyle questionnaires as well as physical exams and blood collection for laboratory tests. Methylation was assessed using the Illumina Infinium HumanMethylation450k platform. There were 344 NAS participants, 333 of which were of European an-cestry. We observed 14 incident MI events in NAS, with all but one occurring in European ancestry individuals.
InCHIANTI is a population-based cohort selected from residents of the Chianti region of Tuscany, Italy. Individuals aged 20 and older were recruited and assessed at both a baseline (1998–2000) and 9-year follow-up (2007–2009) examination. As in KORA and NAS, methylation was assessed using the Illumina Infinium HumanMethylation450k platform. MI was assessed using questionnaires at both baseline and follow-up examinations, and events adjudicated using data from hospital records, electrocardiogram diagnos-tics, and cardiac enzyme assays. Individuals with preva-lent MI at baseline were excluded. This left 443 InCHIANTI participants for analysis; 50 had an incident MI during follow-up.
Only incident MIs that occurred between the baseline and follow-up examinations were treated as events. All studies received written and informed consent from all participants at all time points and were approved by their respective ethical boards. Complete descriptions of all studies appear in the Additional file 1, and clinical covariates for all cohorts can be found in Table1.
Normalization and technical factors for methylation data
In KORA, the methylation beta values were normalized using a beta-mixture inter-quartile (BMIQ) normalization [74] after background correction. To adjust for technical factors, 20 principal components derived from the control probes on each chip were used [75]. Estimated cell counts [76] were also included in the analysis to adjust for heterogeneity in cell composition. This normalization, technical factor adjustment, and inclusion of the esti-mated cell counts match previous analyses of KORA methylation data [24,77].
NAS also used BMIQ normalization after back-ground correction to normalize the methylation probe values. To adjust for technical factors, variables for the plate and position of the chip, row, and column were included in each analysis as well as estimated cell counts [76]. InCHIANTI used the background correc-tion and dye-bias equalizacorrec-tion method as implemented in noob in the minfi R package [78, 79], and probes were normalized using the approach implemented in
dasen in the wateRmelon R package [80]. Technical
factors adjusted for in the InCHIANTI models were estimated cell counts [76], batch, slide, and array. Full details on the design, methylation assessment and normalization, and technical factor adjustment can be found in the Additional file1.
Development of the epigenetic fingerprint
maximize inclusion of potentially predictive CpGs. False positives are removed by the use of penalized re-gression, elastic net model, in two independent cohorts before the final model is determined. False positive CpGs which are not predictive of the outcome would be eliminated by the elastic net when applied to an independent cohort not used in the CpG discovery. Prior to calculating the change in methylation over time, the methylationβvalues were adjusted for cohort specific technical factors including estimated cell counts [76]. The residuals from this regression were used to estimate the follow-up—baseline methylation difference (ΔCpG). At baseline,ΔCpG was defined as 0 (Additional file1).
We associated ΔCpG in KORA with a binary indica-tor for the occurrence of an incident MI between the two samplings using a single adjustment model which adjusted for age, sex, body mass index (BMI), type 2 diabetes, hypertension, physical activity, pack-years of smoking, and alcohol consumption (g/day) both at baseline and follow-up. Physical activity was a binary variable indicating if the individual considered themselves to be active or not. Pack-years of smoking was defined as the packs of cigarettes smoked per day (1 pack = 20 cigarettes) times the years spent smoking. In order to be able to calculate the methylation differ-ence for each individual and each methylation locus, we restricted the EWAS to those CpGs with no missing values (N= 24,057). This allowed any CpGs identified in the EWAS to be carried forward into the elastic net model, which does not allow for missing values in the predictors. We created the epigenetic fingerprint from those CpGs with a false discovery rate (FDR) [81] P< 0.15. We used a liberal FDR cutoff at this stage to maximize inclusion of CpGs that showed even a weakly suggestive level of association, while acknowledging the potential inclusion of many “false positive” CpGs which were to be eliminated using an elastic net model in the next stage of analysis. We used the longpower package in R to conduct a post hoc power analysis which accounted for the disparity in observed MI events versus total samples as well as the correlation of the CpGs between examinations and among those who had an MI versus those who did not (Additional file 1: Figure S1). The expectation of low power in this initial, screening, EWAS is a primary motivation for the use of a penalized regression method (elastic net) in an independent sample to down weight predictors that initially arose due to noise and low power. Those CpGs that did not contribute to the fingerprint discrimination would be excluded in the elastic net model.
We used an elastic net model (logit link) implemented in KORA for the initial selection of the epigenetic
fingerprint CpGs from those with FDR P< 0.15 in the EWAS. Given that the model would be overfit, we re-fined the elastic net using independent samples from NAS, by estimating a second elastic net model using only those CpGs with non-zero coefficients from the initial KORA elastic net model. We assessed the predictive power of these models via the area under the receiver operating characteristic curve (AUC) [82, 83]. As these epigenetic loci could be associated with post-MI medication usage [84, 85], we used KORA to associate each medication type commonly prescribed post-MI with the CpGs retained in the NAS elastic net model. The CpGs in the model had already been assessed for associates with MI independent of age, body mass index, smoking, alcohol consumption, type 2 diabetes, and hypertension in the EWAS; thus, those confounders were not retested here. We used ΔCpG as our outcome and tested each locus in the epigenetic fingerprint for associations with the use of seven commonly prescribed medication types: beta-blockers, ACE-inhibitors, diuretics, angiotensin receptor blockers, calcium channel blockers, statins, and anti-platelet med-ications [86, 87]. We encoded each medication as a fac-tor variable and tested for epigenetic differences associated with either stopping or starting the medica-tion. A Bonferroni correction was used to determine medication-associated CpGs, and any associated CpGs were removed from the CpGs that composed the epi-genetic fingerprint. We used a Bonferroni correction to reduce the probability of removing epigenetic loci not truly associated with medication usage.
Thus, the final epigenetic fingerprint loci were com-posed of those CpGs retained in NAS but not associated with medication usage. The discrimination of this final list of CpGs was retested via logistic regression in KORA and NAS, to allow for reweighting of the coeffi-cients after removing medication-associated CpGs. The independent out-of-sample discrimination of the epigen-etic fingerprint was evaluated, using logistic regression, in InCHIANTI.
All analyses were performed in R [88]. Generalized es-timating equations used in the EWAS were implemented
in geepack [89], and the elastic net models used were
implemented in glmnet [90]. The packages ROCR [91]
and verification were used for plotting and calculating
statistics associated with receiver operating characteristic (ROC) curves.
Association of epigenetic fingerprint with gene
expression and integration with metabolomics networks
was assessed on the Illumina HumanHT-12v3 array. A total of 713 individuals had both methylation and gene expression in KORA F4. We associated each epigenetic fingerprint CpG with the gene expression of all genes within 1 Mb of the loci (cis-genes). We adjusted for age and sex in the models as well as estimated cell counts and technical factors. As a multiple-testing correction, we used a Bonferroni correction for the num-ber of genes within the 1 Mb window for each CpG.
We created a multi-omics network model by integrating the CpG-gene expression associations with integrated metabolomics data using gene expression-metabolomics associations based on KORA F4 data. The KORA F4 data came from a published Spearman correlation-based blood metabolome-transcriptome network [17]. We extracted the relevant gene expression probes and metabolites from this network, removing any metabolites of unknown structure. Based on the reported Spearman correlation, we calculated thePvalues and used an FDR correction to determine significant associations. Finally, we used Cytoscape® [92] to integrate all suggestive (P< 0.001) gene expression-metabolomics associations with any nominal (P< 0.05) methylation-gene expression associations. Both
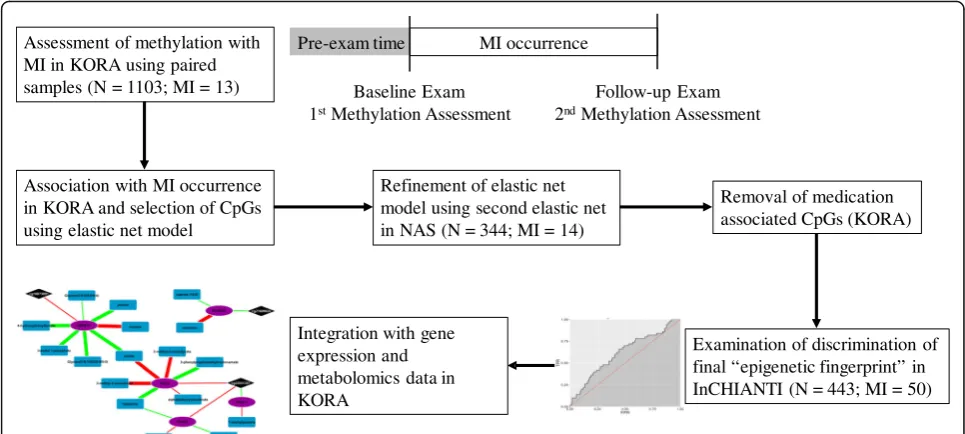
P value cutoffs were selected to allow for better visualization of the implicated pathways with a more strin-gent cutoff used for the gene expression-metabolomics data to account for the larger number of tests. A diagram of the procedure for the development of the epigenetic fingerprint and integration with gene expression and metabolomics data is given in Fig.3.
Additional file
Additional file 1:Supplemental methods,Table S1.CpGs from KORA EWAS. Those CpGs with a false discovery rateP< 0.15 in an epigenome-wide association study in KORA using the difference in methylation between the baseline and follow-up exams as the outcome (after adjustment for technical factors) and the occurrence of an MI as the predictor while adjusting for clinical covariates (at both baseline and follow-up) in a generalized estimating equations model.Table S2.The 174 CpGs which were retained from the initial elastic net model performed in KORA.Table S3.Epigenetic loci with non-zero coefficients from the NAS elastic net model.Table S4.AUC for the model fit with the loci with non-zero betas from the NAS elastic net in KORA, NAS, and InCHIANTI.Table S5.Medication usage in KORA at baseline and follow-up. We divide out the medication usage in KORA at (a) baseline and (b) follow-up for those individuals who did not develop and incident MI during the observation time (MI free) vs those that did (MI cases).
Table S6.Association between 11 epigenetic fingerprint loci and
medications. Associations were performed relative to both starting and stopping six classes of medications: diuretic, beta-blockers, anti-platelet, calcium channel blocker, statins, ACE-inhibitor, and angiotensin inhibitor.
Table S7.Count of the genes within 1 Mb of each epigenetic fingerprint
loci.Table S8. Integration of methylation, gene expression, and metabolomics for the suggestive (P< 0.001) gene expression-metabolite associations.Figure S1.Post hoc power estimations for the observed ef-fects at our FDR cutoff of 0.15 for the initial screening EWAS. (ZIP 196 kb)
Abbreviations
CVD:Cardiovascular disease; MI: Myocardial infarction
Acknowledgements
We would like to thank participants from all studies for their participation in the respective cohorts, without which this study would not have been possible. The views expressed in this article do not necessarily represent EPA policy. Mention of products or trade names does not constitute
endorsement by the EPA. The US Department of Veterans Affairs (VA) Normative Aging Study (NAS) is supported by the Cooperative Studies Program/ERIC, US Department of Veterans Affairs, and is a research Assessment of methylation with
MI in KORA using paired samples (N = 1103; MI = 13)
Association with MI occurrence in KORA and selection of CpGs using elastic net model
Refinement of elastic net model using second elastic net in NAS (N = 344; MI = 14)
Removal of medication associated CpGs (KORA)
Integration with gene expression and metabolomics data in KORA
Pre-exam time MI occurrence
Baseline Exam 1stMethylation Assessment
Follow-up Exam 2ndMethylation Assessment
Examination of discrimination of final “epigenetic fingerprint” in InCHIANTI (N = 443; MI = 50)
component of the Massachusetts Veterans Epidemiology Research and Information Center (MAVERIC). The views expressed in this paper are those of the authors and do not necessarily represent the views of the US Department of Veterans Affairs.
Funding
The following funding agencies were involved in the funding of this research. None of the funding agencies had any role in the design, collection, analysis, interpretation, or writing of this manuscript. KORA: Helmholtz Zentrum München—German Research Center for Environmental Health; German Federal Ministry of Education and Research (BMBF) and the State of Bavaria, Germany; Munich Center of Health Sciences (MC-Health); Ludwig-Maximilians-Universität, as part of LMUinnovativ; e:Med research and funding concept (e:AtheroSysMed, grant 01ZX1313A-2014); European Union’s Seventh Framework Programme (FP7/2007-2013; grant agreement no. 603288 (SysVasc))
NAS:
InCHIANTI: Italian Ministry of Health (ICS110.1/RF97.71); U.S. National Institute on Aging (Contracts 263 MD 9164 and 263 MD 821336); National Institutes of Health (NIH) High Performance Computing (http://hpc.nih.gov); Intramural Research Program of the NIH, National Institute on Aging
Availability of data and materials
The datasets analyzed during this current study are available from the corresponding author upon request and approval of said request from the respective committees for each cohort.
Authors’contributions
CKW-C, AP, and LP did the study concept and design. LP, GK, PW, MW, GA, AAB, JS, PSV, LH, ACJ, SB, DGH, and LF took part in the data acquisition. CKW-C, RW, GA, BHC, and ACJ are responsible for the analysis. CKW-C and LP drafted the manuscript. CKW-C, LP, RW, MW, and GA gave critical revision of the manuscript. TM, GK, HP, CG, MW, AP, AAB, JS, SB, and LF contributed to the funding. All authors read and approved the final manuscript.
Ethics approval and consent to participate
All studies were approved by their respective ethics committees. For all studies, subjects provided written and informed consent. Details on informed consent and the studies ethics committees can be found in the Additional file1.
Consent for publication Not applicable
Competing interests
The authors declare that they have no competing interests.
Publisher’s Note
Springer Nature remains neutral with regard to jurisdictional claims in published maps and institutional affiliations.
Author details
1Institute of Epidemiology II, Helmholtz Zentrum München, Ingolstädter
Landstraβe 1, 85764 Neuherberg, Germany.2Mailman School of Public Health, Columbia University, 722 W 168th St, New York, NY 10032, USA. 3
Longitudinal Studies Section, Translational Gerontology Branch, Intramural Research Program, National Institute on Aging, National Institutes of Health, Baltimore, MD 21224, USA.4Research Unit Molecular Epidemiology, Helmholtz Zentrum München, Ingolstädter Landstraβe 1, 85764 Neuherberg, Germany.5Institute of Human Genetics, Helmholtz Zentrum München, Ingolstädter Landstraβe 1, 85764 Neuherberg, Germany.6Department of Epidemiology, Harvard T.H. Chan School of Public Health, 677 Huntington Ave, Boston, MA 02115, USA.7VA Normative Aging Study, Veterans Affairs Boston Healthcare System and the Department of Medicine, Boston University School of Medicine, Boston, MA, USA.8Department of Medicine, Boston University School of Medicine, 72 E Concord St, Boston, MA 02118, USA.9Department of Preventive Medicine, Feinberg School of Medicine, Northwestern University, 680 N Lake Shore Dr, Chicago, IL 60611, USA. 10Robert H. Lurie Comprehensive Cancer Center, Feinberg School of
Medicine, Northwestern University, 675 N. St. Clair, Chicago, IL 60611, USA. 11Department of Preventive Medicine, Icahn School of Medicine at Mount
Sinai, 1468 Madison Ave, New York, NY 10029, USA.12Geriatric Rehabilitation Unit, Azienda Sanitaria Firenze, Via del Cassero 19, San Casciano in Val di pesa, 50026 Florence, Italy.13Laboratory of Neurogenetics, Intramural Research Program, National Institute on Aging, National Institutes of Health, Bethesda, MD 20814, USA.14Institut für Humangenetik, Technische Universität München, Arcistrasse 12, 80333 Munich, Germany.15DZHK (German Center for Cardiovascular Disease), partner site Munich Heart Alliance, Munich, Germany.16Institute of Bioinformatics and Systems Biology, Helmholtz Zentrum München, Ingolstädter Landstraβe 1, 85764 Neuherberg, Germany.
Received: 15 August 2017 Accepted: 19 November 2018
References
1. Scott J. Pathophysiology and biochemistry of cardiovascular disease. Curr Opin Genet Dev. 2004;14:271–9.
2. Tabas I. Pulling down the plug on atherosclerosis: finding the culprit in your heart. Nat Med. 2011;17:791–3.
3. Nakatani D, Sakata Y, Suna S, Usami M, Matsumoto S, Shimizu M, Sumitsuji S, Kawano S, Ueda Y, Hamasaki T, et al. Incidence, predictors, and subsequent mortality risk of recurrent myocardial infarction in patients following discharge for acute myocardial infarction. Circ J. 2013;77:439–46. 4. Pfeffer MA, Braunwald E. Ventricular remodeling after myocardial infarction.
Experimental observations and clinical implications. Circulation. 1990;81:1161–72. 5. Jugdutt B. Prevention of ventricular remodelling post myocardial infarction:
timing and duration of therapy. Can J Cardiol. 1992;9:103–14. 6. Jugdutt BI. Ventricular remodeling after infarction and the extracellular
collagen matrix: when is enough enough? Circulation. 2003;108:1395–403. 7. Rathmann W, Icks A, Haastert B, Giani G, Lowel H, Mielck A. Undiagnosed
diabetes mellitus among patients with prior myocardial infarction. Z Kardiol. 2002;91:620–5.
8. Janzon M, Hasvold LP, Thuresson M, Hjelm H, Jernberg T. Myocardial infarction survivors with diabetes have a substantially increased event rate: impact of PEGASUS-TIMI 54 trial risk factors in a nationwide real LIFE setting in SWEDEN. J Am Coll Cardiol. 2015;65:A1598.
9. Jones PA. Functions of DNA methylation: islands, start sites, gene bodies and beyond. Nat Rev Genet. 2012;13:484–92.
10. Ziller MJ, Müller F, Liao J, Zhang Y, Gu H, Bock C, Boyle P, Epstein CB, Bernstein BE, Lengauer T, et al. Genomic distribution and inter-sample variation of non-CpG methylation across human cell types. PLoS Genet. 2011;7:e1002389.
11. Rask-Andersen M, Martinsson D, Ahsan M, Enroth S, Ek WE, Gyllensten U, Johansson Å. Epigenome wide association study reveals differential DNA methylation in individuals with a history of myocardial infarction. Hum Mol Genet. 2016;25(21):4739–48.
12. Zhong J, Agha G, Baccarelli AA. The role of DNA methylation in cardiovascular risk and disease. Circ Res. 2016;118:119–31. 13. Nakatochi M, Ichihara S, Yamamoto K, Naruse K, Yokota S, Asano H,
Matsubara T, Yokota M. Epigenome-wide association of myocardial infarction with DNA methylation sites at loci related to cardiovascular disease. Clin Epigenetics. 2017;9:54.
14. Zaina S, Heyn H, Carmona FJ, Varol N, Sayols S, Condom E, Ramírez-Ruz J, Gomez A, Gonçalves I, Moran S. DNA methylation map of human atherosclerosis. Circ Cardiovasc Genet. 2014;7:692–700.
15. Bonder MJ, Luijk R, Zhernakova DV, Moed M, Deelen P, Vermaat M, van Iterson M, van Dijk F, van Galen M, Bot J, et al. Disease variants alter transcription factor levels and methylation of their binding sites. Nat Genet. 2016;49:131.
16. Zhernakova DV, Deelen P, Vermaat M, van Iterson M, van Galen M, Arindrarto W, Van‘t Hof P, Mei H, van Dijk F, Westra H-J, et al. Identification of context-dependent expression quantitative trait loci in whole blood. Nat Genet. 2016;49:139.
17. Bartel J, Krumsiek J, Schramm K, Adamski J, Gieger C, Herder C, Carstensen M, Peters A, Rathmann W, Roden M. The human blood metabolome-transcriptome interface. PLoS Genet. 2015;11:e1005274.
19. Wan ES, Qiu W, Baccarelli A, Carey VJ, Bacherman H, Rennard SI, Agusti A, Anderson W, Lomas DA, DeMeo DL. Cigarette smoking behaviors and time since quitting are associated with differential DNA methylation across the human genome. Hum Mol Genet. 2012;21:3073–82.
20. Dogan MV, Shields B, Cutrona C, Gao L, Gibbons FX, Simons R, Monick M, Brody GH, Tan K, Beach SR, Philibert RA. The effect of smoking on DNA methylation of peripheral blood mononuclear cells from African American women. BMC Genomics. 2014;15:151.
21. Joehanes R, Just AC, Marioni RE, Pilling LC, Reynolds LM, Mandaviya PR, Guan W, Xu T, Elks CE, Aslibekyan S. Epigenetic signatures of cigarette smoking. Circ: Cardiovasc Genet. 2016;9(5):436–47.
22. Panni T, Mehta AJ, Schwartz JD, Baccarelli AA, Just AC, Wolf K, Wahl S, Cyrys J, Kunze S, Strauch K. A genome-wide analysis of DNA methylation and fine particulate matter air pollution in three study populations: KORA F3, KORA F4, and the Normative Aging Study. Environ Health Perspect. 2016. 23. Bind M-AC, Coull BA, Peters A, Baccarelli AA, Tarantini L, Cantone L, Vokonas
PS, Koutrakis P, Schwartz JD. Beyond the mean: quantile regression to explore the association of air pollution with gene-specific methylation in the normative aging study. Environ Health Perspect. 2015;123:759–65. 24. Dick KJ, Nelson CP, Tsaprouni L, Sandling JK, Aïssi D, Wahl S, Meduri E,
Morange P-E, Gagnon F, Grallert H. DNA methylation and body-mass index: a genome-wide analysis. Lancet. 2014;383:1990–8.
25. Toperoff G, Aran D, Kark JD, Rosenberg M, Dubnikov T, Nissan B, Wainstein J, Friedlander Y, Levy-Lahad E, Glaser B, Hellman A. Genome-wide survey reveals predisposing diabetes type 2-related DNA methylation variations in human peripheral blood. Hum Mol Genet. 2012;21:371–83.
26. Dayeh T, Volkov P, Salö S, Hall E, Nilsson E, Olsson AH, Kirkpatrick CL, Wollheim CB, Eliasson L, Rönn T, et al. Genome-wide DNA methylation analysis of human pancreatic islets from type 2 diabetic and non-diabetic donors identifies candidate genes that influence insulin secretion. PLoS Genet. 2014;10:e1004160.
27. Sharma P, Garg G, Kumar A, Mohammad F, Kumar SR, Tanwar VS, Sati S, Sharma A, Karthikeyan G, Brahmachari V, Sengupta S. Genome wide DNA methylation profiling for epigenetic alteration in coronary artery disease patients. Gene. 2014;541:31–40.
28. Aavik E, Lumivuori H, Leppänen O, Wirth T, Häkkinen S-K, Bräsen J-H, Beschorner U, Zeller T, Braspenning M, van Criekinge W, et al. Global DNA methylation analysis of human atherosclerotic plaques reveals extensive genomic hypomethylation and reactivation at imprinted locus 14q32 involving induction of a miRNA cluster. Eur Heart J. 2014.
29. Lamarche B, Tchernof A, Moorjani S, Cantin B, Dagenais GR, Lupien PJ, Després J-P. Small, dense low-density lipoprotein particles as a predictor of the risk of ischemic heart disease in men. Prospective results from the Que’bec Cardiovascular Study. Circulation. 1997;95:69–75.
30. Ballantyne FC, Clark RS, Simpson HS, Ballantyne D. High density and low density lipoprotein subfractions in survivors of myocardial infarction and in control subjects. Metabolism. 1982;31:433–7.
31. Cholesterol SotEoARi, Homocysteine collaborative group. Intensive lowering of LDL cholesterol with 80 mg versus 20 mg simvastatin daily in 12 064 survivors of myocardial infarction: a double-blind randomised trial. Lancet. 2010;376:1658–69.
32. Shen G-Q, Girelli D, Li L, Rao S, Archacki S, Olivieri O, Martinelli N, Park JE, Chen Q, Topol EJ, Wang QK. A novel molecular diagnostic marker for familial and early-onset coronary artery disease and myocardial infarction in the LRP8 gene. Circ Cardiovasc Genet. 2014;7:514–20.
33. Gui L, Bao Z, Jia Y, Qin X, Cheng ZJ, Zhu J, Chen QH. Ventricular
tachyarrhythmias in rats with acute myocardial infarction involves activation of small-conductance Ca2+-activated K+ channels. Am J Physiol Heart Circ Physiol. 2013;304:H118–30.
34. Yu T, Deng C, Wu R, Guo H, Zheng S, Yu X, Shan Z, Kuang S, Lin Q. Decreased expression of small-conductance Ca2+-activated K+ channels SK1 and SK2 in human chronic atrial fibrillation. Life Sci. 2012;90:219–27. 35. Zerenturk EJ, Sharpe LJ, Ikonen E, Brown AJ. Desmosterol and DHCR24:
unexpected new directions for a terminal step in cholesterol synthesis. Prog Lipid Res. 2013;52:666–80.
36. Waterham HR, Koster J, Romeijn GJ, Hennekam RC, Vreken P, Andersson HC, FitzPatrick DR, Kelley RI, Wanders RJ. Mutations in the 3β-hydroxysterolΔ 24-reductase gene cause desmosterolosis, an autosomal recessive disorder of cholesterol biosynthesis. Am J Hum Genet. 2001;69:685–94.
37. Hedman ÅK, Mendelson MM, Marioni RE, Gustafsson S, Joehanes R, Irvin MR, Zhi D, Sandling JK, Yao C, Liu C, et al. Epigenetic patterns in blood
associated with lipid traits predict incident coronary heart disease events and are enriched for results from genome-wide association studies. Circ Cardiovasc Genet. 2017;10:e001487.https://doi.org/10.1161/CIRCGENETICS. 116.001487.
38. Spann NJ, Garmire LX, McDonald JG, Myers DS, Milne SB, Shibata N, Reichart D, Fox JN, Shaked I, Heudobler D. Regulated accumulation of desmosterol integrates macrophage lipid metabolism and inflammatory responses. Cell. 2012;151:138–52.
39. Kuehnle K, Crameri A, Kälin RE, Luciani P, Benvenuti S, Peri A, Ratti F, Rodolfo M, Kulic L, Heppner FL, et al. Prosurvival effect of DHCR24/ Seladin-1 in acute and chronic responses to oxidative stress. Mol Cell Biol. 2008;28:539–50.
40. Dekkers KF, van Iterson M, Slieker RC, Moed MH, Bonder MJ, van Galen M, Mei H, Zhernakova DV, van den Berg LH, Deelen J, et al. Blood lipids influence DNA methylation in circulating cells. Genome Biol. 2016;17:138.
41. Ougland R, Lando D, Jonson I, Dahl JA, Moen MN, Nordstrand LM, Rognes T, Lee JT, Klungland A, Kouzarides T. ALKBH1 is a histone H2A dioxygenase involved in neural differentiation. Stem Cells. 2012;30:2672–82.
42. Gingras M-C, Margolin JF. Differential expression of multiple unexpected genes during U937 cell and macrophage differentiation detected by suppressive subtractive hybridization. Exp Hematol. 2000;28:65–76. 43. Xiao Y-H, Li X-H, Tan T, Liang T, Yi H, Li M-Y, Zeng G-Q, Wan X-X, Qu J-Q, He
Q-Y. Identification of GLIPR1 tumor suppressor as methylation-silenced gene in acute myeloid leukemia by microarray analysis. J Cancer Res Clin Oncol. 2011;137:1831–40.
44. Auer PL, Nalls M, Meschia JF, Worrall BB, Longstreth W, Seshadri S, Kooperberg C, Burger KM, Carlson CS, Carty CL. Rare and coding region genetic variants associated with risk of ischemic stroke: the NHLBI Exome Sequence Project. JAMA Neurol. 2015;72:781–8.
45. Ikeda M, Chiba S, Ohashi K, Mizuno K. Furry protein promotes aurora A-mediated polo-like kinase 1 activation. J Biol Chem. 2012;287:27670–81. 46. Tian X, Vroom C, Ghofrani HA, Weissmann N, Bieniek E, Grimminger F,
Seeger W, Schermuly RT, Pullamsetti SS. Phosphodiesterase 10A upregulation contributes to pulmonary vascular remodeling. PLoS One. 2011;6:e18136.
47. Milner JD, Vogel TP, Forbes L, Ma CA, Stray-Pedersen A, Niemela JE, Lyons JJ, Engelhardt KR, Zhang Y, Topcagic N, et al. Early-onset
lymphoproliferation and autoimmunity caused by germline STAT3 gain-of-function mutations. Blood. 2015;125:591–9.
48. Hillmer EJ, Zhang H, Li HS, Watowich SS. STAT3 signaling in immunity. Cytokine Growth Factor Rev. 2016;31:1–5.
49. Oettgen P. Regulation of vascular inflammation and remodeling by ETS factors. Circ Res. 2006;99:1159–66.
50. Newgard CB, An J, Bain JR, Muehlbauer MJ, Stevens RD, Lien LF, Haqq AM, Shah SH, Arlotto M, Slentz CA. A branched-chain amino acid-related metabolic signature that differentiates obese and lean humans and contributes to insulin resistance. Cell Metab. 2009;9:311–26.
51. Newgard Christopher B. Interplay between lipids and branched-chain amino acids in development of insulin resistance. Cell Metab. 2012;15:606–14. 52. Würtz P, Soininen P, Kangas AJ, Rönnemaa T, Lehtimäki T, Kähönen M,
Viikari JS, Raitakari OT, Ala-Korpela M. Branched-chain and aromatic amino acids are predictors of insulin resistance in young adults. Diabetes Care. 2013;36:648–55.
53. Wang TJ, Larson MG, Vasan RS, Cheng S, Rhee EP, McCabe E, Lewis GD, Fox CS, Jacques PF, Fernandez C. Metabolite profiles and the risk of developing diabetes. Nat Med. 2011;17:448–53.
54. Huang Y, Zhou M, Sun H, Wang Y. Branched-chain amino acid metabolism in heart disease: an epiphenomenon or a real culprit? Cardiovasc Res. 2011; 90:220–3.
55. Shah SH, Bain JR, Muehlbauer MJ, Stevens RD, Crosslin DR, Haynes C, Dungan J, Newby LK, Hauser ER, Ginsburg GS, et al. Association of a peripheral blood metabolic profile with coronary artery disease and risk of subsequent cardiovascular events. Circ Cardiovasc Genet. 2010;3:207–14. 56. Shah SH, Sun J-L, Stevens RD, Bain JR, Muehlbauer MJ, Pieper KS, Haynes C,
Hauser ER, Kraus WE, Granger CB, et al. Baseline metabolomic profiles predict cardiovascular events in patients at risk for coronary artery disease. Am Heart J. 2012;163:844–850.e841.
58. Holmes E, Loo RL, Stamler J, Bictash M, Yap IKS, Chan Q, Ebbels T, De Iorio M, Brown IJ, Veselkov KA, et al. Human metabolic phenotype diversity and its association with diet and blood pressure. Nature. 2008;453:396–400. 59. Pérez-Vázquez V, Guzmán-Flores JM, Mares-Álvarez D, Hernández-Ortiz M,
Macías-Cervantes MH, Ramírez-Emiliano J, Encarnación-Guevara S. Differential proteomic analysis of the pancreas of diabetic db/db mice reveals the proteins involved in the development of complications of diabetes mellitus. Int J Mol Sci. 2014;15:9579–93.
60. Wu G. Amino acids: metabolism, functions, and nutrition. Amino Acids. 2009;37:1–17.
61. Harrison D, Griendling KK, Landmesser U, Hornig B, Drexler H. Role of oxidative stress in atherosclerosis. Am J Cardiol. 2003;91:7–11.
62. Napoli C, Ignarro LJ. Nitric oxide and atherosclerosis. Nitric Oxide. 2001; 5:88–97.
63. Vaarhorst AA, Verhoeven A, Weller CM, Böhringer S, Göraler S, Meissner A, Deelder AM, Henneman P, Gorgels AP, van den Brandt PA. A metabolomic profile is associated with the risk of incident coronary heart disease. Am Heart J. 2014;168:45–52. e47.
64. Tousoulis D, Böger RH, Antoniades C, Siasos G, Stefanadi E, Stefanadis C. Mechanisms of disease:L-arginine in coronary atherosclerosis—a clinical perspective. Nat Clin Pract Cardiovasc Med. 2007;4:274–83.
65. Adeva-Andany M, López-Ojén M, Funcasta-Calderón R, Ameneiros-Rodríguez E, Donapetry-García C, Vila-Altesor M, Ameneiros-Rodríguez-Seijas J. Comprehensive review on lactate metabolism in human health. Mitochondrion. 2014;17:76–100.
66. Sprafka JM, Burke GL, Folsom AR, McGovern PG, Hahn LP. Trends in prevalence of diabetes mellitus in patients with myocardial infarction and effect of diabetes on survival. The Minnesota Heart Survey. Diabetes Care. 1991;14:537–43.
67. Theuwissen E, Mensink RP. Water-soluble dietary fibers and cardiovascular disease. Physiol Behav. 2008;94:285–92.
68. Du J, Li Z, Li Q-Z, Guan T, Yang Q, Xu H, Pritchard KA, Camara AKS, Shi Y. Enoyl coenzyme a hydratase domain–containing 2, a potential novel regulator of myocardial ischemia injury. J Am Heart Assoc. 2013;2. 69. Holle R, Happich M, Löwel H, Wichmann H. KORA--a research platform for
population based health research. Gesundheitswesen (Bundesverband der Arzte des Offentlichen Gesundheitsdienstes (Germany)). 2005;67:S19–25. 70. Rückert I-M, Heier M, Rathmann W, Baumeister SE, Döring A, Meisinger C.
Association between markers of fatty liver disease and impaired glucose regulation in men and women from the general population: the KORA-F4-study. PLoS One. 2011;6:e22932.
71. Ziegler D, Rathmann W, Meisinger C, Dickhaus T, Mielck A. Prevalence and risk factors of neuropathic pain in survivors of myocardial infarction with pre-diabetes and diabetes. The KORA Myocardial Infarction Registry. Eur J Pain. 2009;13:582–7.
72. Bell B, Rose CL, Damon A. The veterans administration longitudinal study of healthy aging. The Gerontologist. 1966;6:179–84.
73. Ferrucci L, Bandinelli S, Benvenuti E, Iorio A, Macchi C, Harris TB, Guralnik JM. Subsystems contributing to the decline in ability to walk: bridging the gap between epidemiology and geriatric practice in the InCHIANTI study. J Am Geriatr Soc. 2000;48:1618–25.
74. Teschendorff AE, Marabita F, Lechner M, Bartlett T, Tegner J, Gomez-Cabrero D, Beck S. A beta-mixture quantile normalization method for correcting probe design bias in Illumina Infinium 450 k DNA methylation data. Bioinformatics. 2013;29:189–96.
75. Lehne B, Drong AW, Loh M, Zhang W, Scott WR, Tan S-T, Afzal U, Scott J, Jarvelin M-R, Elliott P. A coherent approach for analysis of the Illumina HumanMethylation450 BeadChip improves data quality and performance in epigenome-wide association studies. Genome Biol. 2015;16:1.
76. Houseman EA, Accomando WP, Koestler DC, Christensen BC, Marsit CJ, Nelson HH, Wiencke JK, Kelsey KT. DNA methylation arrays as surrogate measures of cell mixture distribution. BMC Bioinformatics. 2012;13:86. 77. Pfeiffer L, Wahl S, Pilling LC, Reischl E, Sandling JK, Kunze S, Holdt LM, Kretschmer A, Schramm K, Adamski J. DNA methylation of lipid-related genes affects blood lipid levels. Circ: Cardiovasc Genet. 2015.https://doi.org/ 10.1161/CIRCGENETICS.114.000804.
78. Triche TJ, Weisenberger DJ, Van Den Berg D, Laird PW, Siegmund KD. Low-level processing of Illumina Infinium DNA methylation beadarrays. Nucleic Acids Res. 2013;41:e90.
79. Aryee MJ, Jaffe AE, Corrada-Bravo H, Ladd-Acosta C, Feinberg AP, Hansen KD, Irizarry RA. Minfi: a flexible and comprehensive Bioconductor package
for the analysis of Infinium DNA methylation microarrays. Bioinformatics. 2014;30:1363–9.
80. Pidsley R, Wong CC, Volta M, Lunnon K, Mill J, Schalkwyk LC. A data-driven approach to preprocessing Illumina 450K methylation array data. BMC Genomics. 2013;14:1.
81. Benjamini Y, Hochberg Y. Controlling the false discovery rate: a practical and powerful approach to multiple testing. J R Stat Soc Ser B Methodol. 1995:289–300.
82. Hanley JA, McNeil BJ. The meaning and use of the area under a receiver operating characteristic (ROC) curve. Radiology. 1982;143:29–36. 83. Huang J, Ling CX. Using AUC and accuracy in evaluating learning
algorithms. IEEE Trans Knowl Data Eng. 2005;17:299–310. 84. Non AL, Binder AM, Kubzansky LD, Michels KB. Genome-wide DNA
methylation in neonates exposed to maternal depression, anxiety, or SSRI medication during pregnancy. Epigenetics. 2014;9:964–72.
85. Csoka AB, Szyf M. Epigenetic side-effects of common pharmaceuticals: a potential new field in medicine and pharmacology. Med Hypotheses. 2009; 73:770–80.
86. Steg PG, James SK, Atar D, Badano LP, Lundqvist CB, Borger MA, Di Mario C, Dickstein K, Ducrocq G, Fernandez-Aviles F. ESC Guidelines for the management of acute myocardial infarction in patients presenting with ST-segment elevation. Eur Heart J. 2012:ehs215.
87. Bassand J-P, Hamm CW, Ardissino D, Boersma E, Budaj A, Fernández-Avilés F, Fox KA, Hasdai D, Ohman EM, Wallentin L. Guidelines for the diagnosis and treatment of non-ST-segment elevation acute coronary syndromes. Eur Heart J. 2007;28:1598–660.
88. R Core Team. R: a language and environment for statistical computing, vol. 3.1.0. Vienna: R Foundation for statistical Computing; 2015.
89. Halekoh U, Højsgaard S, Yan J. The R package geepack for generalized estimating equations. J Stat Softw. 2006;15:1–11.
90. Friedman J, Hastie T, Tibshirani R. Regularization paths for generalized linear models via coordinate descent. J Stat Softw. 2010;33:1.
91. Sing T, Sander O, Beerenwinkel N, Lengauer T. ROCR: visualizing classifier performance in R. Bioinformatics. 2005;21:3940–1.