Journal of Chemical and Pharmaceutical Research, 2015, 7(8):249-256
Research Article
CODEN(USA) : JCPRC5
ISSN : 0975-7384
Response surface methodology based optimization of diesel- mustard
biodiesel-diethyl ether ternary blend ratios to improve engine performance
M. Krishnamoorthi
Department of Mechanical Engineering, Sri Shakthi Institute of Engg. & Tech., Coimbatore, India
_____________________________________________________________________________________________
ABSTRACT
The objective of this work is to optimize direct injection, single cylinder diesel engine with respect to brake power, fuel economy and exhaust emissions through experimental investigation and response surface methodology (RSM). As far as the application in rural agricultural sector of a developing nation in concerned, such engines should preferable utilize alternative fuels of bio-origin. In this test, the mustard biodiesel and diesel blending with diethyl ether (DEE) in the ratio of 0:100:0, 20:80:0, 30:70:0, 40:60:0, 15:80:5, 25:70:5 and 35:60:5 by volume were tested in CI Engine. The results shows that compared with neat diesel, there is slightly lower brake specific fuel consumption (BSFC) for DEE blend. Strong reduction in emission is observed with diesel-biodiesel-DEE at various engine loads. Methyl ester of mustard biodiesel of 25% and diesel-biodiesel-DEE 5% blend with diesel gave best performance in terms of low smoke intensity, emissions of HC,CO,CO2,and NOx.
Keywords: Diesel engine, SVO, DEE, Optimization, Response surface methodology.
__________________________________________________________________________________________
INTRODUCTION
Several alternative fuels have been studied to either substitute the diesel fuels partially or completely. Alternative fuels derived from biological sources provide a means for sustainable development, energy conservation, energy efficiency and environmental protection [1,2]. Some of the alternative fuels explored are biogas, ethanol, vegetable oils etc. The high viscosity of vegetable oils and their low volatility affects the atomization and spray model of fuel, leading to incomplete combustion and severe carbon deposits, injector choking and piston ring sticking [3]. In particular, biodiesel has received broad attention as an alternate for diesel fuel because it is biodegradable, nontoxic and can significantly reduce exhaust emissions from the engine when burned as a fuel [4,5]. Many researches show that using biodiesel in diesel engines can reduce hydrocarbon (HC), carbon monoxide (CO) and opacity emissions, but nitrogen oxide (NOx) emission may increase [6]. Biodiesel can be used in the existing engines without any modifications and the biodiesel obtained from vegetable sources does not contain any metals, aromatic hydrocarbons and sulfur or crude oil residues. Biodiesel is an oxyfuel; emissions of carbon monoxide and soot tend to reduce. The oxygen content of biodiesel is an important factor in the NOx formation, because it causes to high local temperatures due to excess hydrocarbon oxidation [7]. The use of vegetable oils as an alternative fuels for internal combustion engines is limited by some unfavorable fuel properties, mainly their high viscosity and density, which cause problems in poor fuel atomization, incomplete combustion and ring carbonization in the combustion chamber. These problems can be overcome by four methods: blending, micro emulsion, trans-esterifaction and pyrolysis [2]. Additional research needs to develop diesel specific additives for better performance, combustion and emissions of diesel engines. DEE has required characteristics and projected to improve low temperature flow properties. Earlier studies have recommended that the weight percent of oxygen content in the fuel is the most important factor for opacity reduction [8-10].
several chemical and physical processes [11-12]. Initially, RSM was developed to model experimental responses and then migrated into the modeling of numerical experiments [13]. The nonlinear optimization techniques such as RSM, artificial neural network, genetic algorithm fuzzy logic and Taguchi method were used for optimizing the performance and emission characteristics of diesel engine [14,15]. Studies regarding the investigation of optimum blend ratios for vegetable oil blends were reported by researchers. But, the current literature concerning the investigation of the optimum diesel- SVO-DEE oil ternary blend ratio at which there is high fuel conversion efficiency and low exhaust emissions are absent [16-18]. The main technical advantage of optimization for percentage of bio-origin components in diesel fuel is improving engine performance and exhaust emissions and utilizing optimization blends in a diesel engine without any engine modification such as injector pressure nozzle diameter or injection time [19,20].
EXPERIMENTALSECTION
2.1 Fuel preparations
Mustard (Brassica juncea) oil is obtained from the seeds of Brassica family, including canola (rapeseed) and turnip, have high levels of omega-3 (6–11%) and are a common, cheap, mass-produced source of plant-base omega-3 fatty acids. Flax (linseed) oil has 55% plant-based omega-3 but is uncommon as a table or cooking oil. Mustard oil was procured from an oil mill. The oil was filtered to remove the impurities. Flash point and fire point was determined by using of fire point apparatus. The viscosity was determined at different temperatures using redwood viscometer to find the effect of temperature on the viscosity of mustard oil. The viscosity of mustard oil was found to be approximately 7 times higher than that of diesel fuel. The flash point of mustard oil was higher than diesel and hence it is safer to store. It is seen that the boiling range of mustard oil was different from that of diesel [21-24].
These vegetable oils trans-esterified before it blended with diesel because of the oils have glycerol. It must extract from the bio-fuel because it will affect the engine performance. Among these, the trans-esterification is the most commonly used commercial process to produce clean and environmental friendly fuel. Methyl/ethyl/butyl esters of mustard oil have been successfully tested on C.I. engines and their performance has been studied. Trans-esterification is the process of conversion of triglyceride to glycerol and ester in the presence of alcohol and catalyst. This reaction, also known as alcoholics in whom the displacement of alcohol from an ester by another alcohol in a process similar to hydrolysis except that an alcohol is used instead of water. This reaction has been widely used to reduce the viscosity of the triglycerides [25-28]. The properties of biodiesel, diesel and DEE as shown in Table 1 and the blended fuel properties are shown in Table 2.
2.2 Response Surface Methodology (RSM)
Response surface methodology is a collection of statistical and mathematical techniques useful for developing, improving and optimizing processes. With this technique the effect of two or more factors on quality criteria can be investigated and optimum values are obtained. In RSM design there should be at least three levels for each factor. RSM also quantifies relationships among one or more measured responses and the vital input factors. MINITAB software was used to develop the experimental plan for RSM. By conducting experiments and the posterior application of regression analysis a model of the response variable of interest is obtained. The real relationship between the response and the independent variables is unknown. For that reason, the first step in RSM is to find an approximation of the true functional relationship between the response and the independent variables. The observed response " " can be written as a function of the independent variables x1, x2, x3,…xn as follows
= (x1, x2, x3,…xn) +ɛ
Where ɛ is random error.
Plotting the expected response a surface known as the response surface obtained. As remarked previously, the form of ƒ is unknown and can be complicated this is why an approximation is needed. Frequently, a low order polynomial function is employed in some region. If the response is well modelled with a linear function, the approximation function is a first order model. If the system has curvature a higher order polynomial model must be used, such as a quadratic model.
= β0 + ∑ +∑ +∑ ∑ + ɛ
gives the optimal response can be obtained. The same software was also used to analyse the data collected by following the steps as follows:
1. Conduct the experiment with the independent variables varying around the present operating point.
2. Obtain a fitted equation with data obtained in the experiment. Normally, regression methods are used in this step. Frequently, a linear model represents the model sufficiently well.
3. Move the experimental point in the direction of steepest ascent (or descent if a minimum is sought) and repeat
the previous steps.
4. When little improvement is obtained, the optimum is near. 5. Conduct a 3- level factorial experiment around this point. 6. Obtain a fitted quadratic equation by regression methods. 7. Based on this quadratic equation, determine the optimum. 8. Conduct further experiments to verify the obtained results.
Previously, if there are a lot of possible input factors, a screening experiment should to be conducted in order to eliminate the less important factors. Obtaining the optimal values of the independent variables can be very complicated if, instead of a simple response, more than one response is sought (multi-response). Reaching the optimum is even more difficult when the response involves several independent process variables that often are constrained to a certain range in certain parameters. For the case in which more than one response is taken into account, a surface model is built for each response. Then a set of operating parameters that optimizes all the responses within their range is selected. Finally, the contour plots of all the responses are overlaid and the best operating point or range is selected. With the increase of both the number of responses and the number of independent process variables, the search becomes more complex. In addition, the optimal values of the process variables can differ of contradict one another. A consequence of this is that the search space is even more complex with multiple constraints and many local optimal points. All these facts make it more and more difficult to apply traditional mathematical methods (such as the steepest ascent) that search for the global (or near global) optimum. In this study three parameters have been chosen for analysis. They are percentage of biodiesel, percentage of diethyl ether and applied load (kg). Several trail runs were conducted to determine the range for parameters. The levels for the parameters finally chosen are shown in the Table 4.
2.3 Experimental Setup
Test has been conducted on a Kirloskar TV1 Engine, four strokes, single cylinder, water-cooled, direct injection and naturally aspirated diesel engine with a bowl type piston combustion chamber. Specification of test engine is shown in Table 3. For high pressure fuel injection, a high-pressure fuel pump is used and three hole in injector nozzle. The injector nozzle was located at the center of the combustion chamber and has an operating pressure of 220bar.
2.4 Experimental procedure
To estimate the performance parameters i.e operating parameters such as engine speed, power output, and fuel consumption were measured. Significant engine performance parameters such as brake specific fuel consumption and brake thermal efficiency for the test fuels were calculated.
• In the first phase experiments were conducted with neat diesel
• In the second phase of the work, the engine was operated diesel- BD blend ratio of 80: 20, 70:30 and 60:40. • In the third phase, BD and diesel blend with DEE in the ratio of 15:80:5, 25:70:5 and 35:60:5.
RESULTS AND DISCUSSION
The principal model analysis was based on the analysis of variations which provides numerical information for the y value. The different models for the response were developed in terms of actual factors and the output parameters in experimental work as a function of biodiesel, load, diethyl ether and it can be expressed as
T=f (L,BD,DEE)
For the three factors, the full quadratic equation was developed using response surface methodology in minitab 17 as follows
Brake thermal efficiency (BTE) = 0.507 + 7.301 L (kg) + 0.0237 BD (%) - 0.196 DEE (%) - 0.4811 L (kg)*L 0.001212 BD (%)*BD (%) -0.00136 L (kg)*BD (%) + 0.0141 L (kg)* DEE (%) + 0.00707 BD (%)*DEE (%)
Brake specific fuel consumption (BSFC)=0.6703- 0.07097 L (kg)- 0.00047 BD (%)-0.00016 DEE(%)
Hydrocarbon emission (HC) = 26.41 - 0.755 L (kg) - 0.066 BD (%) - 0.624 DEE (%) - 0.0431 L (kg)*L (kg) + 0.00273 BD (%)*BD (%) - 0.0037 L (kg)*BD (%) + 0.0260 L (kg) *DEE (%) - 0.0006 BD (%)*DEE (%)
Carbon monoxide(CO)= 0.04947 + 0.00525 L (kg) - 0.001080 BD (%) - 0.00093 DEE (%) - 0.000689 L (kg)*L (kg) + 0.000023 BD (%)*BD (%)+ 0.000006 L (kg)*BD (%)- 0.000178 L (kg)*DEE (%)+ 0.000046 BD (%)*DEE (%)
Oxides of nitrogen (NOx)=83.0- 12.28 L (kg)- 2.003 BD (%)- 0.88 DEE (%)+ 6.939 L (kg) *L (kg)+ 0.0497 BD (%)*BD (%) + 0.0013 L (kg)*BD (%) - 1.010 L (kg)*DEE (%)+ 0.042 BD (%)*DEE (%)
Carbon dioxide (CO2)=1.967+ 0.1302 L (kg)- 0.0385 BD (%)- 0.0771 DEE (%) + 0.01760 L (kg)*L (kg)+ 0.000738
BD (%)*BD (%)+ 0.003453 L (kg)*BD (%) + 0.00586 L (kg)*DEE (%) + 0.00276 BD (%)*DEE (%)
Opacity=0.719+ 0.610 L (kg)-0.0255 BD (%)+ 0.028 DEE (%)+ 0.0971 L (kg)*L (kg) + 0.001039 BD (%)*BD (%) + 0.00268 L (kg) *BD (%) - 0.0558 L (kg)*DEE (%)+ 0.00005 BD (%)*DEE (%)
By using above quadratic equation predicted output parameters is calculated and compared with the experimental values.
3.1 Performance Characteristics
Brake specific fuel consumption: The BSFC variation of the test fuels with respect to load is shown in Fig. 1. The fuel mass flow rate is calculated from the respective measured volume flow rate value and the fuel density. BSFC of D80+M20 oil blend is 1.5% lower than neat diesel at load 4 kg and D80+M20 blend is approximately same with diesel ant 6kg load. BSFC of D80+M15+A5 is 1.3% lower than that of neat diesel at 4kg and almost similar to neat diesel in remaining loads. D70+M25+A5 fuel has similar BSFC values up to 4-8kg load and slightly higher for higher loads compared to neat diesel. The main reason may be due to the higher volatility of DEE which speeds up the mixing velocity of air/fuel mixture, improves the combustion process and increases the combustion efficiency. Brake thermal efficiency: The variations of BTE at different loads for various fuel blends has been shown in Fig.2. BTE for diesel is higher than that of all other blended fuels up to 4 kg applied load. BTE for D70+M25+A5 blend has 5%, 2% higher than neat diesel at 6kg, 8kg load. This is due the addition of DEE reduces the viscosity which in turn increases the atomization and leads to the enhancement of combustion.
3.2 Emission Characteristics
Opacity: The smoke is produced due to incomplete combustion of fuel. The variation of opacity with load for the fuels is shown in Fig. 3. It can seen that higher load, the smoke intensity for blended fuels lower comparing to neat diesel. D70+M25+A5 blend has 24%, 19% lower opacity than neat diesel at 6kg, 8kg load. The improvement in spray atomization and air fuel mixing with the addition of DEE decrease the rich mixture and also smoke emission. However DEE added blends, the smoke intensity also increase but it is still lower than biodiesel-diesel, diesel. This may due to phase separation of the blends which results in incomplete combustion.
Carbon monoxide (CO): The variation of CO emissions with load is shown in Fig.4. At full load, the CO emission decreases by 30% for D70+M25+A5 blend compared to neat diesel. The improvement in spray atomization and fuel air mixing reduces the rich region in cylinder and reduces the CO emission. The high temperature promotes the CO oxidation in the cylinder. Biodiesel-diesel blend has slightly higher CO emissions due to poor atomization and do not have time to undergo complete combustion.
Carbon dioxide (CO2): As could be seen CO2 emissions increase when increases of biodiesel in diesel- biodiesel
blends. At lower engine loads CO2 is lower than neat diesel and higher loads it becomes higher than neat diesel. At
6kg load, D70+M25+A5 blend has approximately 13% higher CO2 values than neat diesel. This may due to better
combustion taking place in higher loads because of fine atomization and very high CO2 emissions are undesirable.
Oxides of nitrogen (NOx): nitric oxides emission is shown in Fig.5. The NOx emission is function of lean fuel with higher temperature, high peak combustion temperature and spray characteristics. A fuel with high HRR at rapid combustion and lower HRR at mixing controlled combustion will causes of NOx emission. NOx emission increases with increase in load for all experimental fuels. D70+M25+A5 blend has 37%, 28%, 13% lower NOx emissions than neat diesel corresponding to 4-8kg loads. The addition of DEE in blends increases the evaporation and lowers the charge temperature. It makes beneficial effect on NOx emission level. In biodiesel- diesel blends, NOx emission is higher due to high HRR and excess oxygen supplied by biodiesel.
been reduced. Initially, the increase of HC may be due to higher latent heat of evaporation of DEE causes lower combustion temperature, especially the temperature near the cylinder walls during the mixture formation. In this case higher HC will be produced from the cylinder boundary. D70+MA25+A5 blend has approximately 20% lower HC emission throughout the engine operation comparing to diesel.
Table1 Properties of diesel, mustard biodiesel and DEE
Property Diesel Biodiesel DEE
Chemical structure C16H34 C17H34O2 C2H5OC2H5
Density (kg/m3) 830 882 713
Kinematic vis. 35 o C (cS) 2.7 18.1 0.23 Auto ignition point (o C) 200-400 - 160
Cetane number 48 55 >125 Boiling point (o C) 180-330 - 35
Pour point (o C) -20 -2 -110
Lower heating value ((MJ/kg) 42.8 38.0 33.9 Stoichiometric A/F ratio 14.9 13.5 11.1
Table 2 Properties of fuel blends
Blend Flash point 0c Fire point 0c Density in g/cc at 320c Calorific value
MJ/kg
Diesel (100%) 68 78 .8878 42.80
Biodiesel (100%) 146 156 .8930 38.00
D80+M20 71 80 .8901 41.84
D70+M30 75 84 .8920 41.36
D60+M40 82 91 .8950 40.88
D80+M15+A5 42 52 .8900 41.63
D70+M25+A5 45 53 .8910 41.15
D60+M35+A5 49 60 .8923 40.67
Table 3 Specification details of kirloskar TV1 engine
Type Vertical, water cooled Number of cylinders/ Number of strokes 01/04
Rated power 3.7 kW/ 5 hp @ 1500rpm Bore (m)/Stroke(m) 0.08/.11
Piston offset (m) 0.00002 Con-rod length (m) 0.235 Piston head ratio 1 Compression ratio 16.7
Speed 1500 Rev/min
Fig.1 BSFC Vs Load, BD
5 4 30 0
3 . 0
1 5
4 . 0
5 0
6 . 0
0.0 2 5.
5.0 0
5 . 7 0
6 . 0 0.75
) r h W k / J k ( C F S B
) % ( D B )
g k ( L
urface Plot of BSFC (kJkWhr) vs BD
Fig.2 BTE Vs Load, BD
Fig.3 OPACITY Vs Load, BD
Fig.4 CO Vs Load, BD
Fig.5 NOx Vs Load, BD
5 4 30 0 10 15 0 2 0.0 30 2.5 5.0 0 7.5 ) % ( E T B ) % ( D B ) g k ( L
urface Plot of BTE (%) vs BD (%
S ), L (kg)
45 0 3 0 5 15 10 0.0 5 1 2.5 5.0 0 7.5 ) % ( y t i c a p o ) % ( D B ) g k ( L
urface Plot of op
S acity (%) vs BD (%), L (kg)
5 4 0 3 0.03
0.04
5 1 5 0 . 0 0.0 5 . 2 0 . 5 0 5 . 7 5 0 . 0 0.06 ) % ( O C ) % ( D B ) g k ( L
urface Plot of CO ( ) vs BD (
S % %), L (kg)
5 4 30 0 0 5 1 5 1 0 0 3 0 0. 450 5 . 2 0 . 5 0 5 . 7 ) m p p ( x O N ) % ( D B ) g k ( L
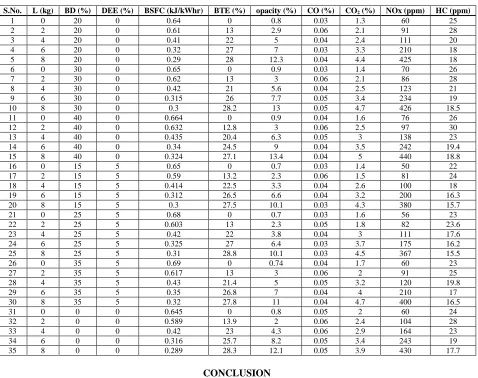
Table 4 Experimental design matrix
S.No. L (kg) BD (%) DEE (%) BSFC (kJ/kWhr) BTE (%) opacity (%) CO (%) CO2 (%) NOx (ppm) HC (ppm)
1 0 20 0 0.64 0 0.8 0.03 1.3 60 25
2 2 20 0 0.61 13 2.9 0.06 2.1 91 28
3 4 20 0 0.41 22 5 0.04 2.4 111 20
4 6 20 0 0.32 27 7 0.03 3.3 210 18
5 8 20 0 0.29 28 12.3 0.04 4.4 425 18
6 0 30 0 0.65 0 0.9 0.03 1.4 70 26
7 2 30 0 0.62 13 3 0.06 2.1 86 28
8 4 30 0 0.42 21 5.6 0.04 2.5 123 21
9 6 30 0 0.315 26 7.7 0.05 3.4 234 19
10 8 30 0 0.3 28.2 13 0.05 4.7 426 18.5
11 0 40 0 0.664 0 0.9 0.04 1.6 76 26
12 2 40 0 0.632 12.8 3 0.06 2.5 97 30
13 4 40 0 0.435 20.4 6.3 0.05 3 138 23
14 6 40 0 0.34 24.5 9 0.04 3.5 242 19.4
15 8 40 0 0.324 27.1 13.4 0.04 5 440 18.8
16 0 15 5 0.65 0 0.7 0.03 1.4 50 22
17 2 15 5 0.59 13.2 2.3 0.06 1.5 81 24
18 4 15 5 0.414 22.5 3.3 0.04 2.6 100 18
19 6 15 5 0.312 26.5 6.6 0.04 3.2 200 16.3
20 8 15 5 0.3 27.5 10.1 0.03 4.3 380 15.7
21 0 25 5 0.68 0 0.7 0.03 1.6 56 23
22 2 25 5 0.603 13 2.3 0.05 1.8 82 23.6
23 4 25 5 0.42 22 3.8 0.04 3 111 17.6
24 6 25 5 0.325 27 6.4 0.03 3.7 175 16.2
25 8 25 5 0.31 28.8 10.1 0.03 4.5 367 15.5
26 0 35 5 0.69 0 0.74 0.04 1.7 60 23
27 2 35 5 0.617 13 3 0.06 2 91 25
28 4 35 5 0.43 21.4 5 0.05 3.2 120 19.8
29 6 35 5 0.35 26.8 7 0.04 4 210 17
30 8 35 5 0.32 27.8 11 0.04 4.7 400 16.5
31 0 0 0 0.645 0 0.8 0.05 2 60 24
32 2 0 0 0.589 13.9 2 0.06 2.4 104 28
33 4 0 0 0.42 23 4.3 0.06 2.9 164 23
34 6 0 0 0.316 25.7 8.2 0.05 3.4 243 19
35 8 0 0 0.289 28.3 12.1 0.05 3.9 430 17.7
CONCLUSION
In the present study, RSM was used to investigate the optimum blend ratios of diesel fuel, biodiesel and DEE in ternary blend for the wide of operations of diesel engine. RSM powered to be a powerful tool for the optimization of biodiesel blends while used as fuel in diesel engine. The main conclusions can be summarized as in the following points:
1.RSM based design of experiments was used to design and carry out statistical analysis to determine parameters
which have the most significant influence on the performance and smoke emission characteristics. Desirability approach of the RSM was used to find out optimum parameters for optimization of performance and smoke emission characteristics.
2.The optimum blend of three fuels was determined by using mathematical models of RSM as 25% BD, 5% DEE
and 70% diesel.
3.Mathematical models used in this study also enable users to perform predictions for unexperimented factor levels. 4.Brake power of engine almost remains the same for all blends implemented.
5.Brake power, brake torque, BTE and BMEP of BD blends decreased, however BSFC increased due to lower heating values, related to oxygen contents of DEE and BD, compared to those of diesel fuel.
6.The formation of NOx, CO and HC emissions of BD, DEE and diesel blends drastically decreased as 28%, 30%
and 20% respectively.
REFERENCES
[1]S.Sivalakshmi, T.Balusamy Fuel, 2013, 106;106-110.
[2]Soo –young no Renewable and sustainable energy reviews, 2011,15; 131-149.
[3]Peterson C. L, wagner C.L and Auld D.L. ASAE 1991: 81-3578.
[4]J.Blin, C.Brunschwig, A.Chapuis, O.Changotade, S.S.Sidibe, E.S.Noumi, P.Girard Renewable and Sustainable
[5]Dr.B.balakrishnan ijest 2012, 4 : 4687-4690
[6]Erdi Tosun, Ali Can Yilmaz, Mustafa Ozcanli, Kadir Aydin Fuel 2014, 126; 38-43.
[7]A.s.ramadhas, C.Muraleedhran, S.Jayaraj, Renewable energy 2005, 30; 1789-1800.
[8]Obed M.Ali , Rizalman mamat, che ku M.Faizal Ijast, , 2013, vol.52, 111-120
[9]Rejeev MJ, Anil KR, Biomass Bioenergy, 1995, vol. 8, 91-98.
[10]Peterson C. L, wagner C.L and Auld D.L. ASAE 1991: 81-3578.
[11]Jagannath B.Hirkude, Atul S.Padalkar fuel 2014, vol.119, 266-273.
[12]Abdullah Abuhahabaya, John Fieldhouse, David Brown, energy, 2013, vol.59, 56-62.
[13]Jagannath Hirkude, Atul Padalkar, Deepa Vedartham, energy procedia 2014, vol.54, 606-614.
[14]Alpaslan Atmanli, Bedri Yuksel, Erol Ileri, A.Deniz Karaoglan, energy conversion and management 2015, vol.
90, pp 383-394.
[15]Zhenbin Chen, Kimian Li, Jun Liu, “Optimal design of glucose solution emulsified diesel and its effects on the performance and emissions of a diesel engine” fuel, doi:10.1016/j.fuel.2015.04.049.
[16]Katarina M.Rajkovic, Jelena M.Avramovic, chemical engineering journal 2013, 216, pp 82-89.
[17]Purnanand Vishwanathrao Bhale, V.Nishikant, Deshpande, B.Shashikant Thombre Renewable energy 2009,
vol.34, 794-800.
[18]E.I. Bello, A.O.Akinola , JETEAS 2013, vol.4, 111-114.
[19]K.Sivarakrishnan, P.Ravikumar “optimization of operational parameters on performance and emissions of a diesel engine using biodiesel” Springer, doi.10.1007/s 13762-013-0273-5
[20]Murat Karabektas , Gokhan ergen, Murat hosoz Fuel 2013, doi 10.1016/j.fuel.2012.12.062
[21]Y.Ohta, H.Takahashi AIAA 1983, 236-247
[22]C.Swaminathan and J.Sarangan. Biomass and bioenergy, 2012,168-174
[23]Zannatul Moiet Hasib, Jomir Hossain, Saikat Biswas, Asif Islam Modern mechanical engineering 2011, vol.19,
77-83.